| Param | Original file | Final file |
|---|---|---|
| Filename | modeM0/AS1A05_072T04_9000002802_18730cztM0_level2.evt | modeM0/AS1A05_072T04_9000002802_18730cztM0_level2_quad_clean.evt |
| Size (bytes) | 546,537,600 | 66,214,080 |
| Size | 521.2 MB | 63.1 MB |
| Events in quadrant A | 4,074,424 | 400,409 |
| Events in quadrant B | 4,377,880 | 399,348 |
| Events in quadrant C | 3,463,295 | 394,058 |
| Events in quadrant D | 4,202,982 | 364,684 |
| Mode SS | |||
|---|---|---|---|
| Quadrant | BADHDUFLAG | Total packets | Discarded packets |
| A | 0 | 130 | 0 |
| B | 0 | 130 | 0 |
| C | 0 | 130 | 0 |
| D | 0 | 130 | 0 |
| Mode M9 | |||
|---|---|---|---|
| Quadrant | BADHDUFLAG | Total packets | Discarded packets |
| A | 0 | 13 | 0 |
| B | 0 | 13 | 0 |
| C | 0 | 13 | 0 |
| D | 0 | 13 | 0 |
| Mode M0 | |||
|---|---|---|---|
| Quadrant | BADHDUFLAG | Total packets | Discarded packets |
| A | 0 | 16035 | 1 |
| B | 0 | 17239 | 1 |
| C | 0 | 14069 | 1 |
| D | 0 | 16495 | 1 |
| Quadrant | Total seconds | Saturated seconds | Saturation percentage |
|---|---|---|---|
| A | 6392 | 169 | 2.643930% |
| B | 6393 | 256 | 4.004380% |
| C | 6393 | 122 | 1.908337% |
| D | 6392 | 351 | 5.491239% |
Noise dominated data is calculated using 1-second bins in cleaned event files. If a bin has >2000 counts, and if more than 50% of those come from <1% of pixels, then it is considered to be noise-dominated and hence unusable.
| Quadrant | # 1 sec bins | Bins with >0 counts | Bins with >2000 counts | High rate bins dominated by noise | Noise dominated (total time) | Noise dominated (detector-on time) | Marked lightcurve |
|---|---|---|---|---|---|---|---|
| A | 7697 | 6393 | 33 | 33 | 0.43% | 0.52% | 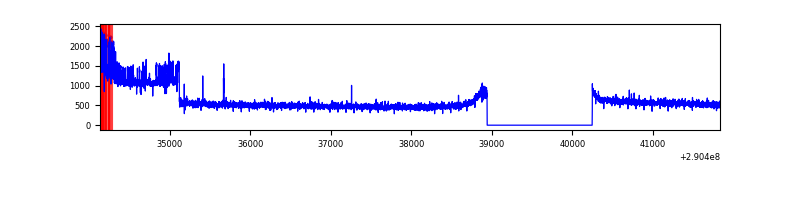 |
| B | 7698 | 6394 | 88 | 88 | 1.14% | 1.38% | 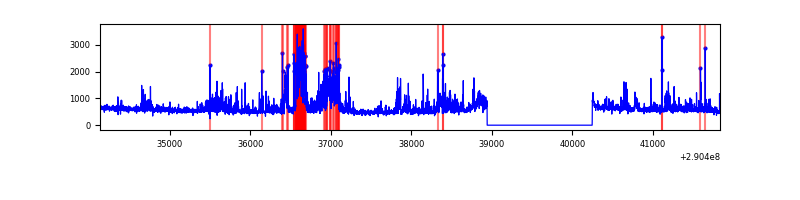 |
| C | 7698 | 6393 | 0 | 0 | 0.00% | 0.00% | 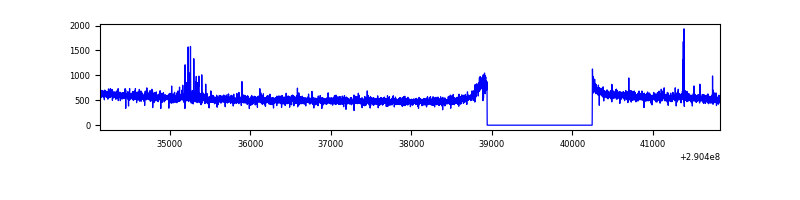 |
| D | 7697 | 6393 | 256 | 256 | 3.33% | 4.00% | 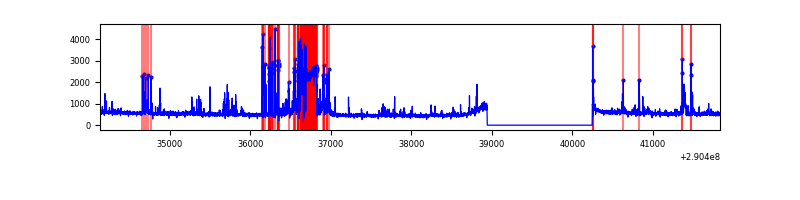 |
Top three noisy pixels from each quadrant. If the there are fewer than three noisy pixels in the level2.evt file, extra rows are filled as -1
| Pixel properties | Quadrant properties | ||||||
|---|---|---|---|---|---|---|---|
| Quadrant | DetID | PixID | Counts | Sigma | Mean | Median | Sigma |
| A | 14 | 4 | 674722 | 3854.4 | 879 | 862 | 174.8 |
| A | 13 | 254 | 11300 | 59.7 | 879 | 862 | 174.8 |
| A | 15 | 192 | 8724 | 44.97 | 879 | 862 | 174.8 |
| B | 10 | 245 | 843381 | 5258.44 | 863 | 846 | 160.2 |
| B | 7 | 220 | 87532 | 541.03 | 863 | 846 | 160.2 |
| B | 4 | 216 | 21672 | 129.98 | 863 | 846 | 160.2 |
| C | 14 | 238 | 133224 | 688.14 | 838 | 845 | 192.4 |
| C | 0 | 207 | 39144 | 199.09 | 838 | 845 | 192.4 |
| C | 3 | 233 | 21040 | 104.98 | 838 | 845 | 192.4 |
| D | 7 | 238 | 785440 | 3875.0 | 836 | 811 | 202.5 |
| D | 10 | 70 | 141745 | 696.02 | 836 | 811 | 202.5 |
| D | 14 | 34 | 77343 | 377.96 | 836 | 811 | 202.5 |
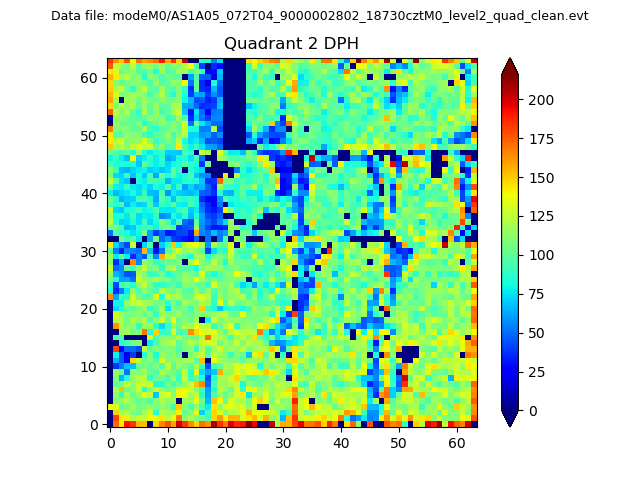
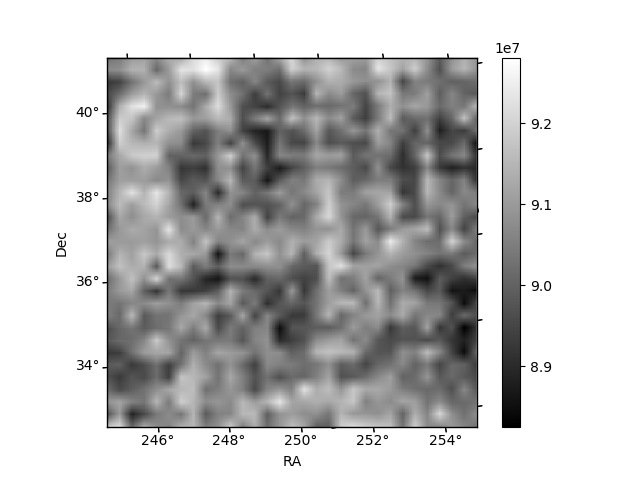
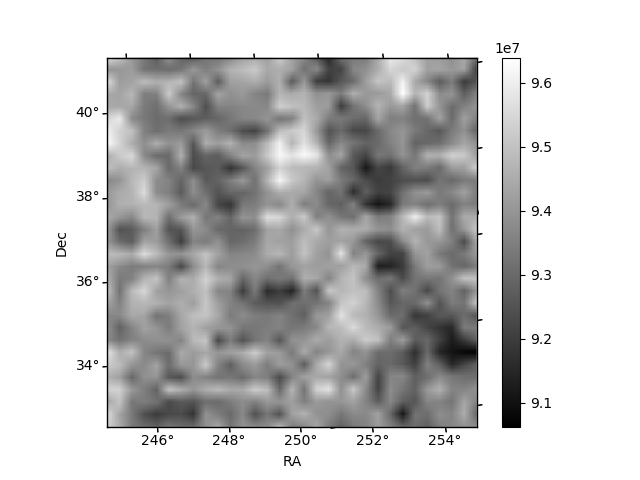
Histogram calculated using DETX and DETY for each event in the final _common_clean file
| Quadrant A | 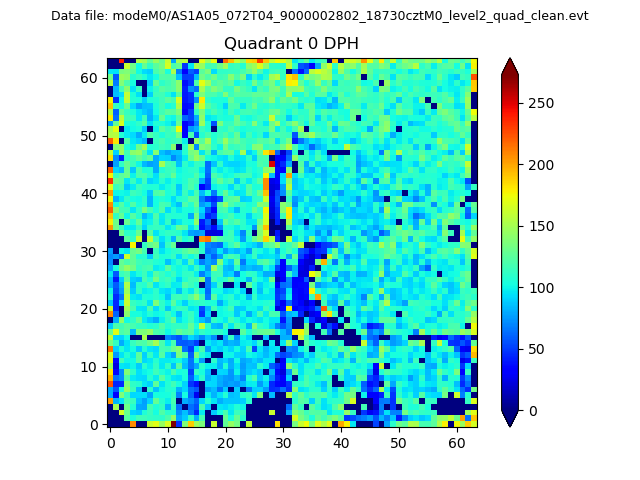 |
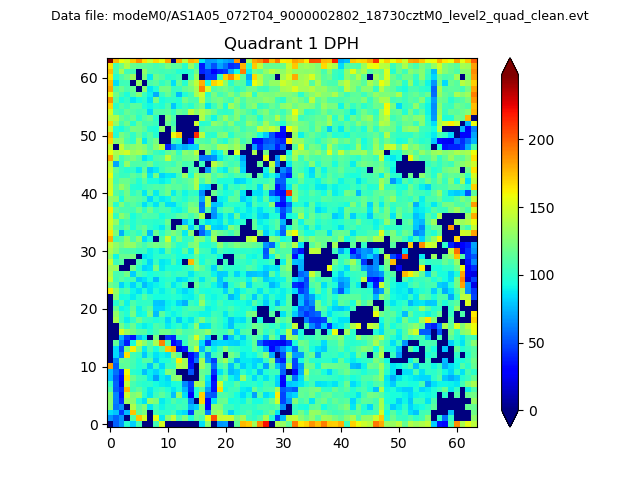 |
Quadrant B |
|---|---|---|---|
| Quadrant D | 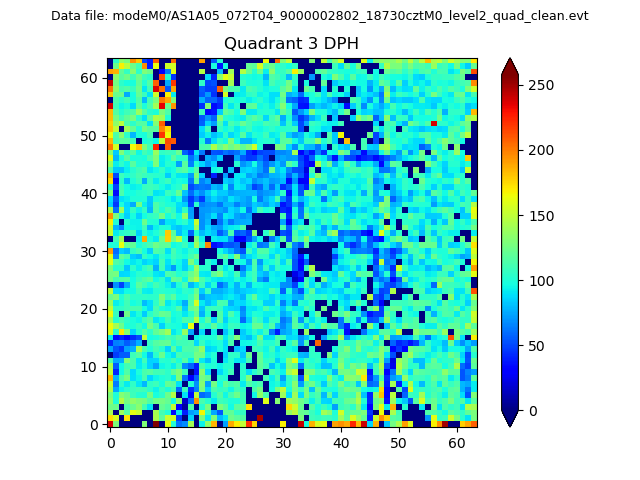 |
 |
Quadrant C |
| Plot type | Count rate plots | Images |
|---|---|---|
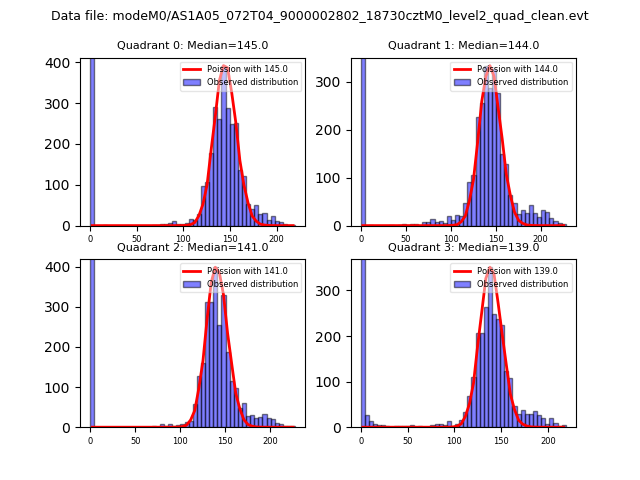
| Comparison with Poisson distribution Blue bars denote a histogram of data divided into 1 sec bins. Red curve is a Poisson curve with rate = median count rate of data. |
 |
 |
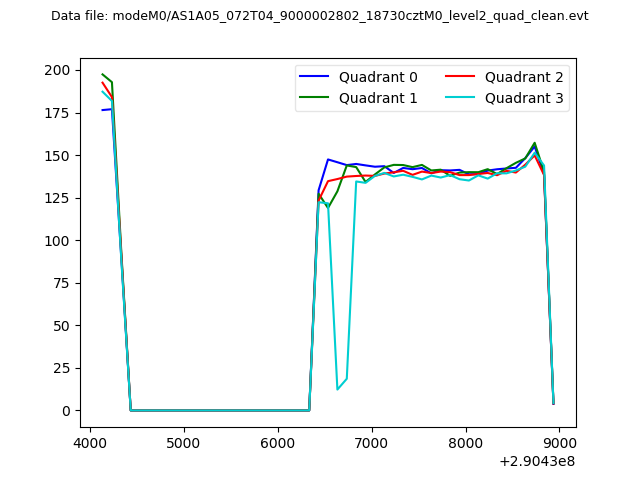
| Quadrant-wise count rates Data is divided into 100 sec bins |
 |
|
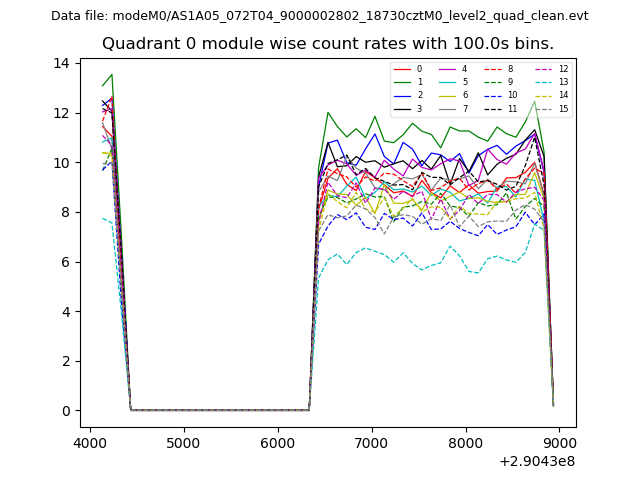
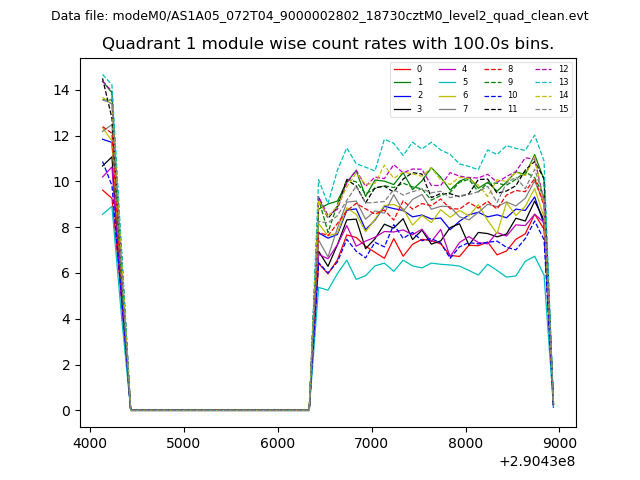
| Module-wise count rates for Quadrant A Data is divided into 100 sec bins |
 |
 |
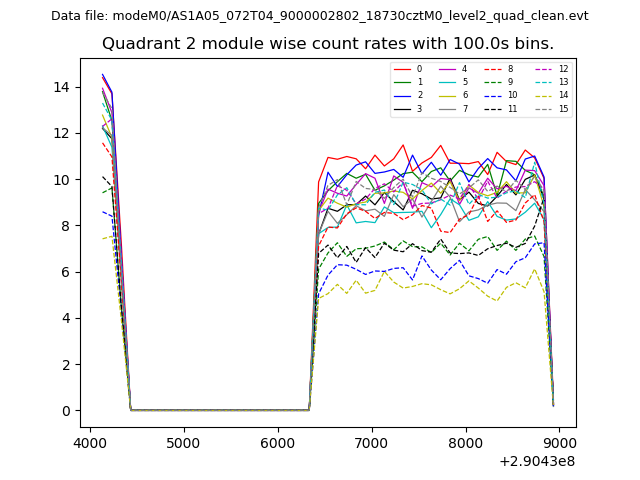
| Module-wise count rates for Quadrant B Data is divided into 100 sec bins |
 |
 |
| Module-wise count rates for Quadrant C Data is divided into 100 sec bins |
 |
 |
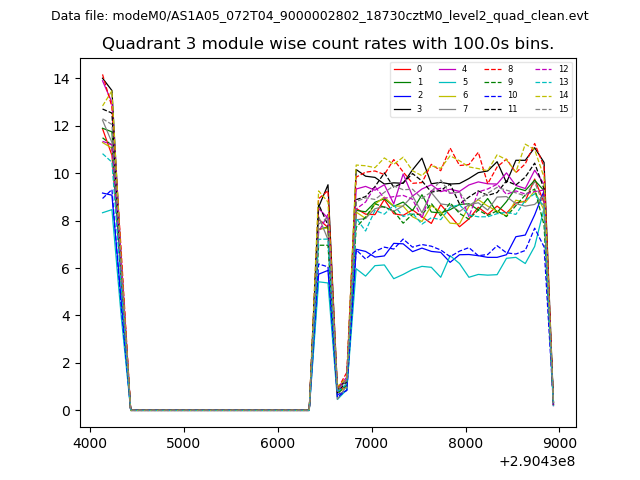
| Module-wise count rates for Quadrant D Data is divided into 100 sec bins |
 |
 |
| Parameter | Plot |
|---|---|
| CZT HV Monitor | 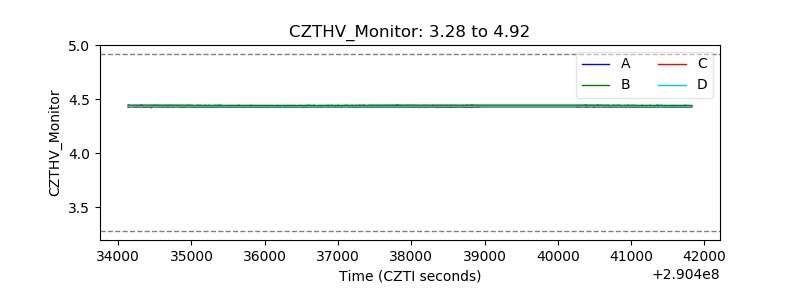 |
| D_VDD | 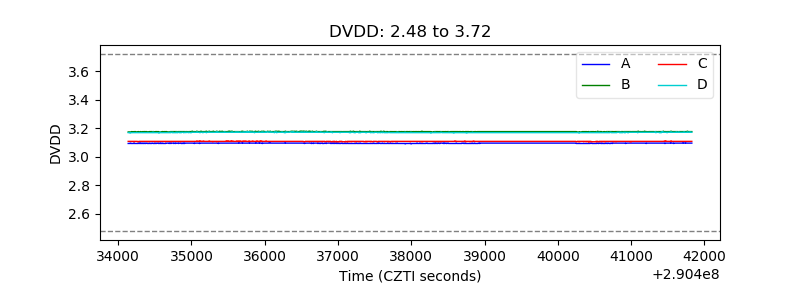 |
| Temperature 1 | 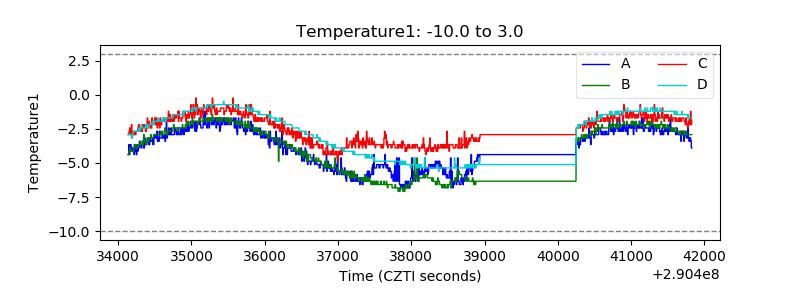 |
| Veto HV Monitor | 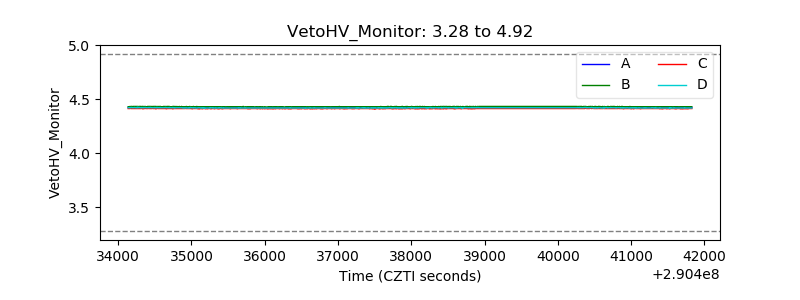 |
| Veto LLD | 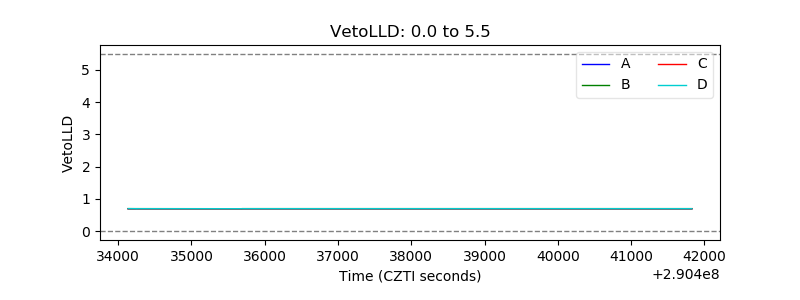 |
| Alpha Counter | 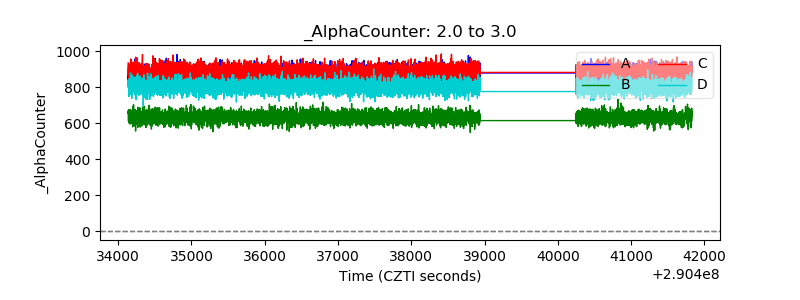 |
| _CPM_Rate | 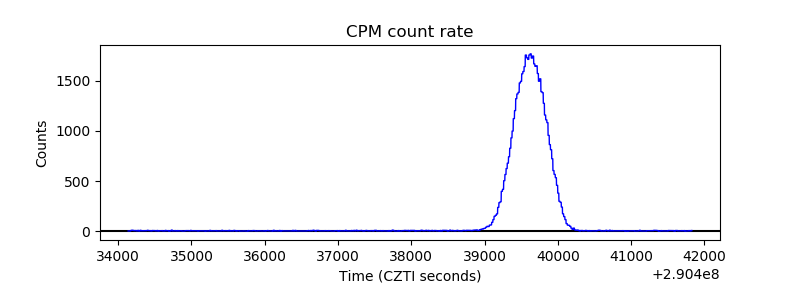 |
| CZT Counter | 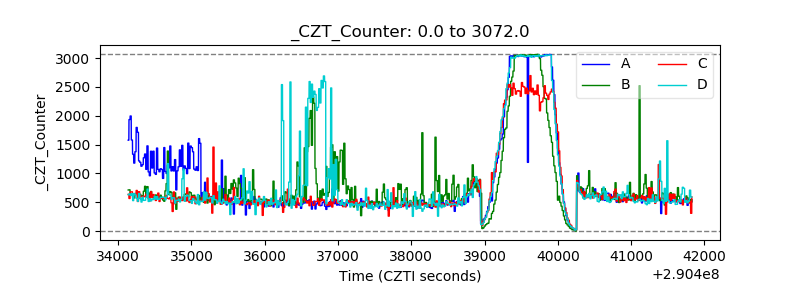 |
| +2.5 Volts monitor |  |
| +5 Volts monitor |  |
| _ROLL_ROT | 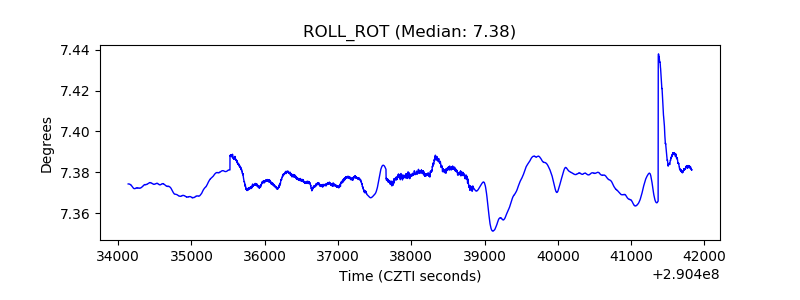 |
| _Roll_DEC | 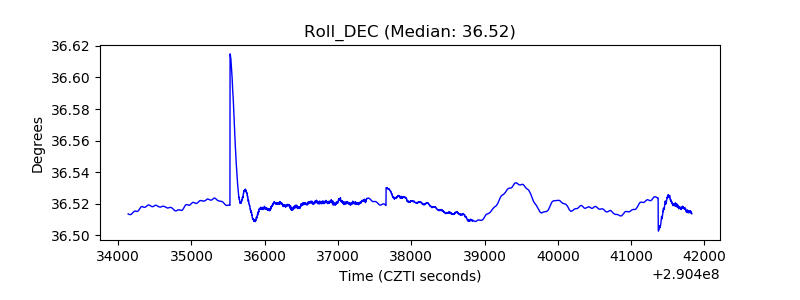 |
| _Roll_RA | 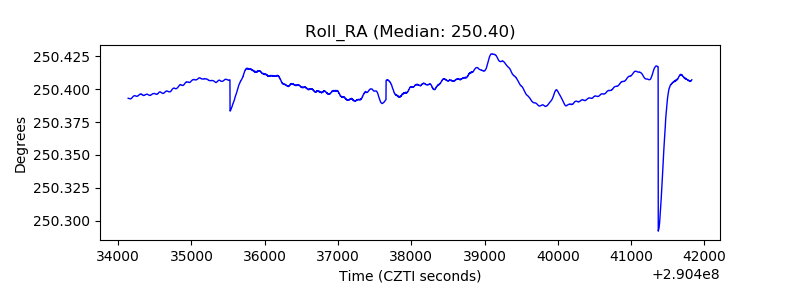 |
| Veto Counter |  |