| Param | Original file | Final file |
|---|---|---|
| Filename | modeM0/AS1A05_072T04_9000002802_18731cztM0_level2.evt | modeM0/AS1A05_072T04_9000002802_18731cztM0_level2_quad_clean.evt |
| Size (bytes) | 497,214,720 | 69,246,720 |
| Size | 474.2 MB | 66.0 MB |
| Events in quadrant A | 3,378,794 | 416,275 |
| Events in quadrant B | 4,275,990 | 416,160 |
| Events in quadrant C | 3,446,510 | 408,101 |
| Events in quadrant D | 3,517,100 | 404,034 |
| Mode SS | |||
|---|---|---|---|
| Quadrant | BADHDUFLAG | Total packets | Discarded packets |
| A | 0 | 132 | 0 |
| B | 0 | 132 | 0 |
| C | 0 | 132 | 0 |
| D | 0 | 132 | 0 |
| Mode M9 | |||
|---|---|---|---|
| Quadrant | BADHDUFLAG | Total packets | Discarded packets |
| A | 0 | 15 | 0 |
| B | 0 | 16 | 0 |
| C | 0 | 16 | 0 |
| D | 0 | 16 | 0 |
| Mode M0 | |||
|---|---|---|---|
| Quadrant | BADHDUFLAG | Total packets | Discarded packets |
| A | 0 | 13997 | 2 |
| B | 0 | 16951 | 2 |
| C | 0 | 14065 | 2 |
| D | 0 | 14599 | 2 |
| Quadrant | Total seconds | Saturated seconds | Saturation percentage |
|---|---|---|---|
| A | 6480 | 70 | 1.080247% |
| B | 6480 | 181 | 2.793210% |
| C | 6480 | 117 | 1.805556% |
| D | 6480 | 88 | 1.358025% |
Noise dominated data is calculated using 1-second bins in cleaned event files. If a bin has >2000 counts, and if more than 50% of those come from <1% of pixels, then it is considered to be noise-dominated and hence unusable.
| Quadrant | # 1 sec bins | Bins with >0 counts | Bins with >2000 counts | High rate bins dominated by noise | Noise dominated (total time) | Noise dominated (detector-on time) | Marked lightcurve |
|---|---|---|---|---|---|---|---|
| A | 7750 | 6481 | 0 | 0 | 0.00% | 0.00% | 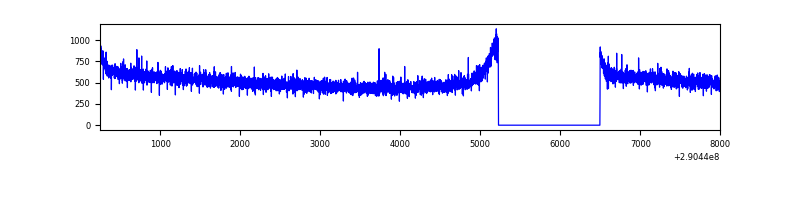 |
| B | 7750 | 6481 | 56 | 56 | 0.72% | 0.86% | 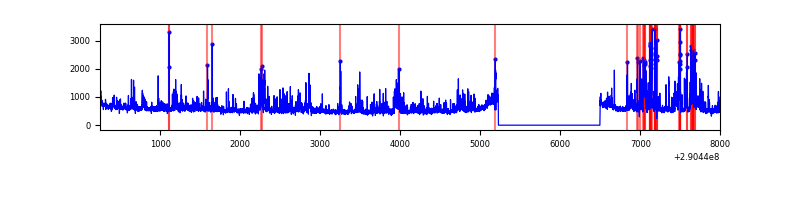 |
| C | 7750 | 6481 | 0 | 0 | 0.00% | 0.00% | 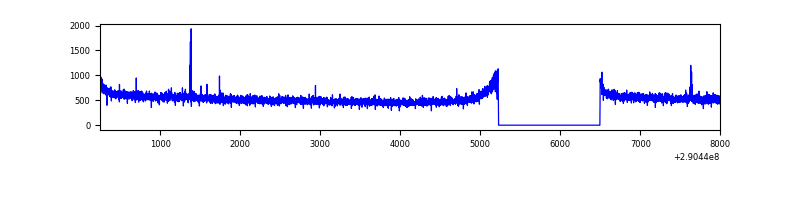 |
| D | 7750 | 6481 | 24 | 24 | 0.31% | 0.37% | 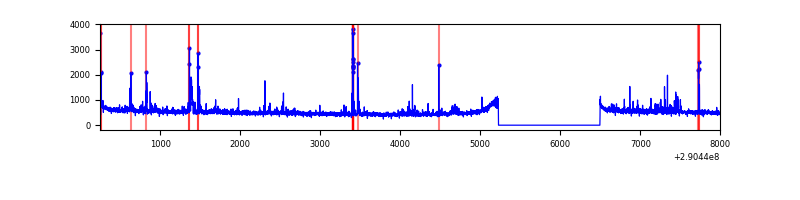 |
Top three noisy pixels from each quadrant. If the there are fewer than three noisy pixels in the level2.evt file, extra rows are filled as -1
| Pixel properties | Quadrant properties | ||||||
|---|---|---|---|---|---|---|---|
| Quadrant | DetID | PixID | Counts | Sigma | Mean | Median | Sigma |
| A | 13 | 254 | 11376 | 60.01 | 875 | 860 | 175.2 |
| A | 0 | 226 | 7538 | 38.11 | 875 | 860 | 175.2 |
| A | 3 | 137 | 6430 | 31.79 | 875 | 860 | 175.2 |
| B | 10 | 245 | 805186 | 4971.99 | 860 | 843 | 161.8 |
| B | 7 | 220 | 29816 | 179.09 | 860 | 843 | 161.8 |
| B | 0 | 197 | 23164 | 137.98 | 860 | 843 | 161.8 |
| C | 14 | 238 | 130922 | 673.98 | 840 | 850 | 193.0 |
| C | 3 | 233 | 21703 | 108.05 | 840 | 850 | 193.0 |
| C | 0 | 207 | 16676 | 82.0 | 840 | 850 | 193.0 |
| D | 10 | 70 | 153334 | 738.48 | 856 | 833 | 206.5 |
| D | 7 | 238 | 72884 | 348.91 | 856 | 833 | 206.5 |
| D | 2 | 234 | 28786 | 135.36 | 856 | 833 | 206.5 |
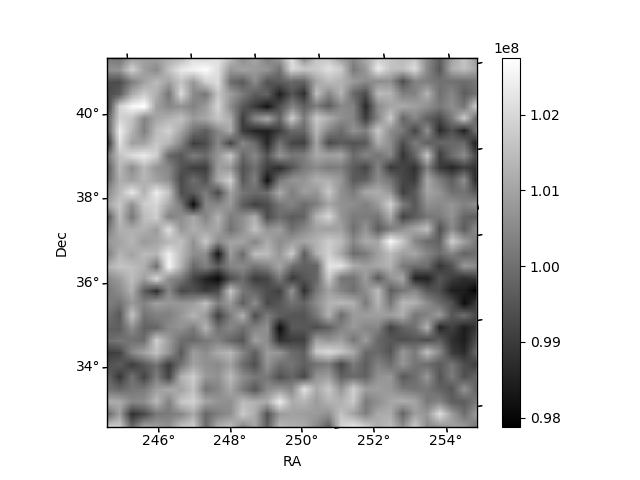
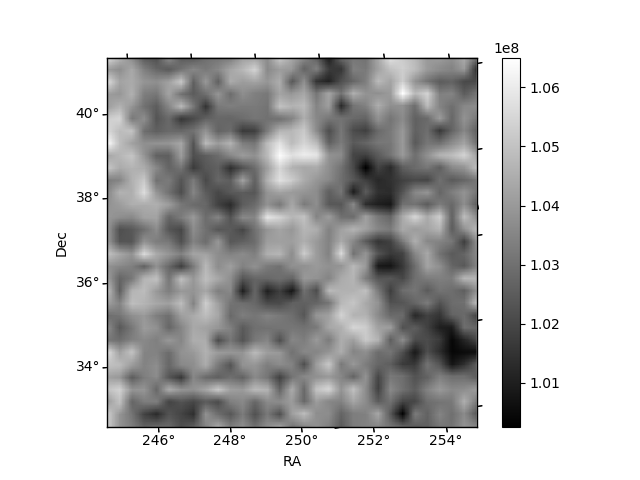
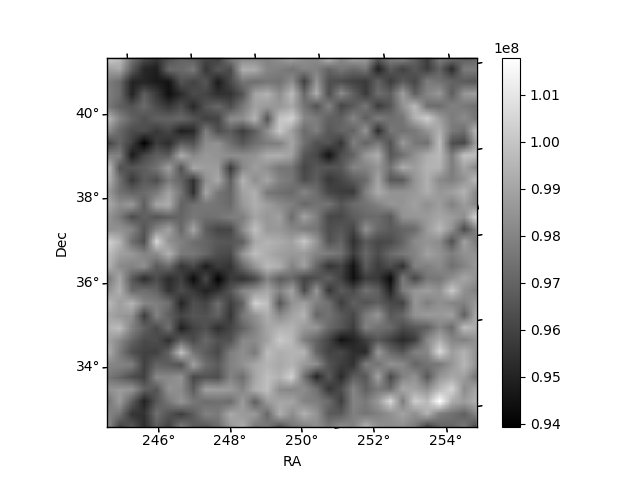
Histogram calculated using DETX and DETY for each event in the final _common_clean file
| Quadrant A | 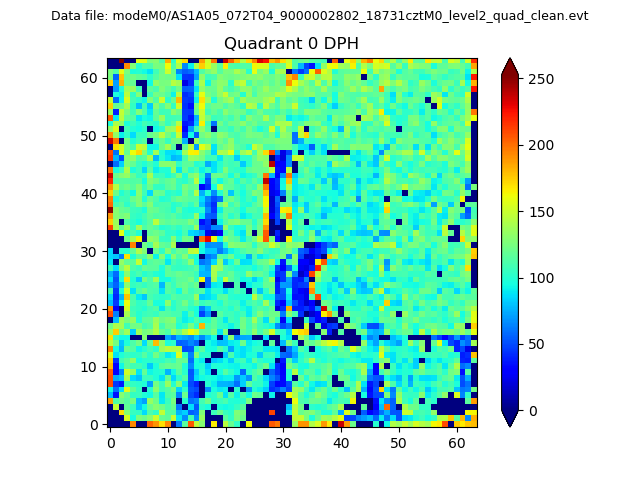 |
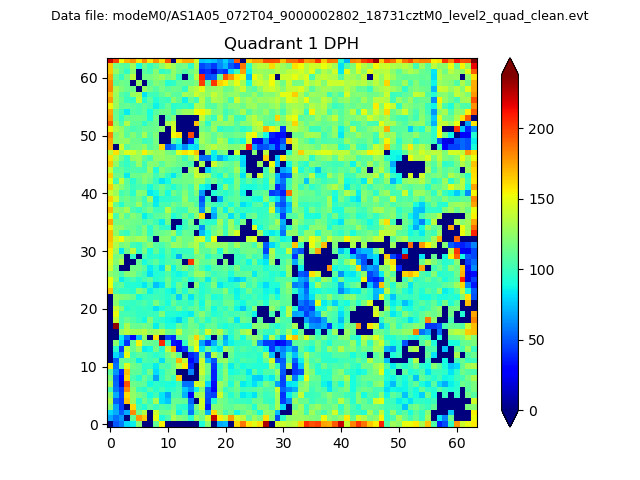 |
Quadrant B |
|---|---|---|---|
| Quadrant D | 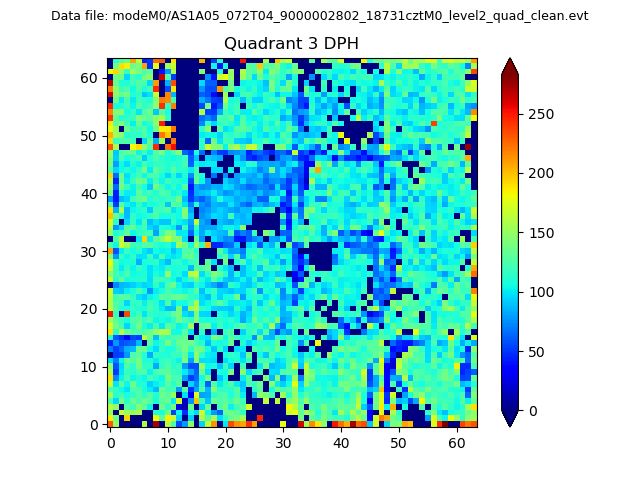 |
 |
Quadrant C |
| Plot type | Count rate plots | Images |
|---|---|---|
| Comparison with Poisson distribution Blue bars denote a histogram of data divided into 1 sec bins. Red curve is a Poisson curve with rate = median count rate of data. |
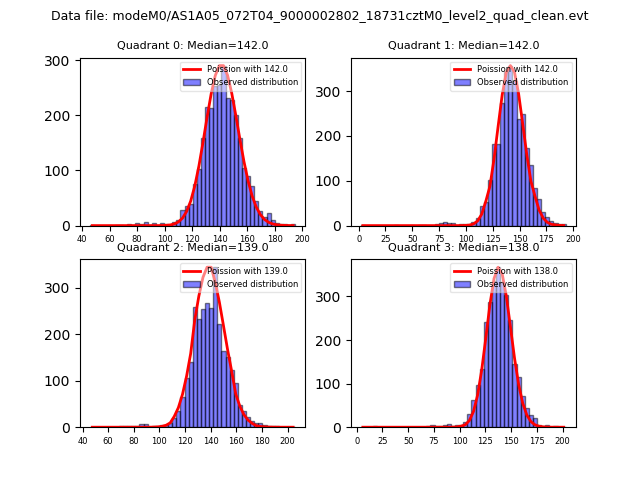 |
 |
| Quadrant-wise count rates Data is divided into 100 sec bins |
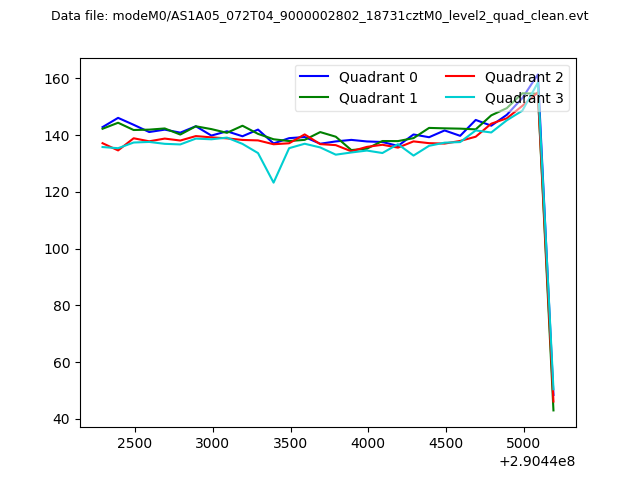 |
|
| Module-wise count rates for Quadrant A Data is divided into 100 sec bins |
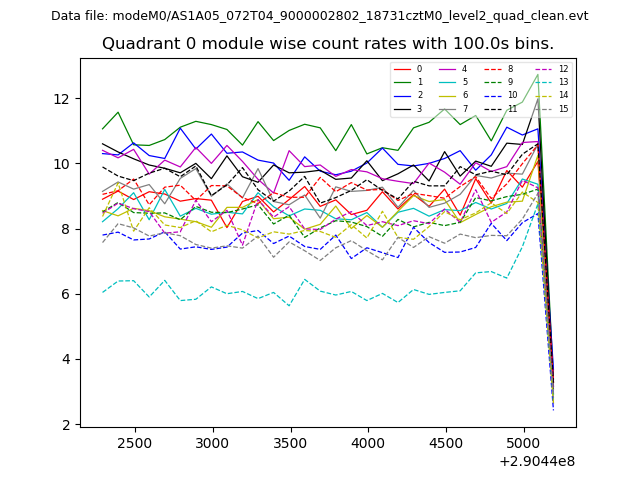 |
 |
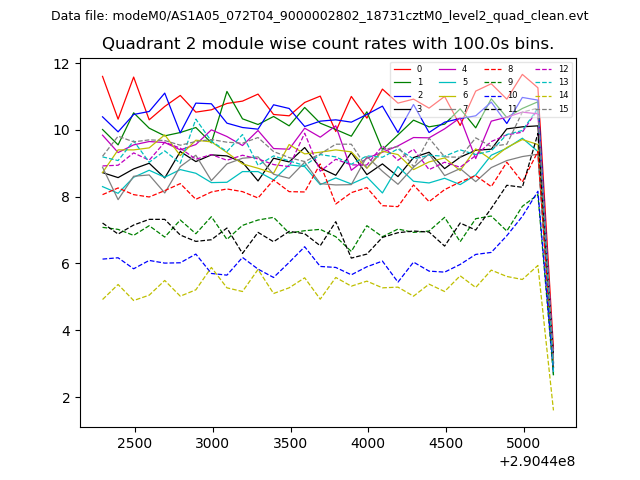
| Module-wise count rates for Quadrant B Data is divided into 100 sec bins |
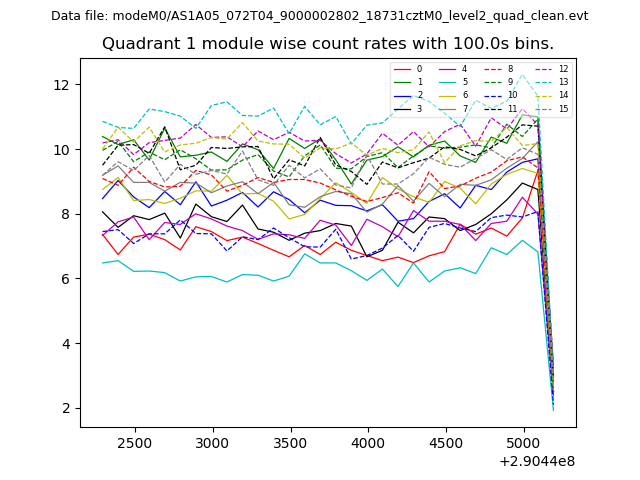 |
 |
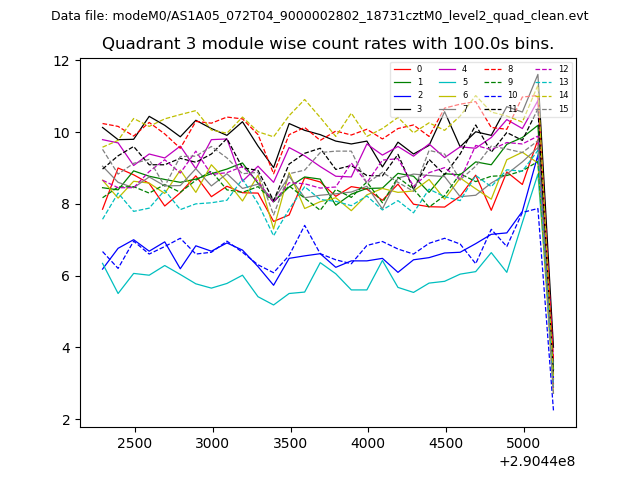
| Module-wise count rates for Quadrant C Data is divided into 100 sec bins |
 |
 |
| Module-wise count rates for Quadrant D Data is divided into 100 sec bins |
 |
 |
| Parameter | Plot |
|---|---|
| CZT HV Monitor | 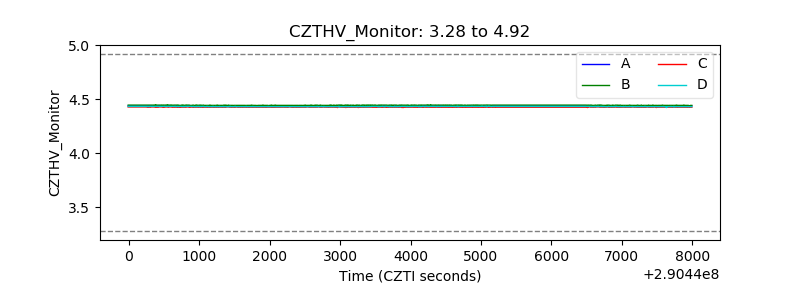 |
| D_VDD |  |
| Temperature 1 | 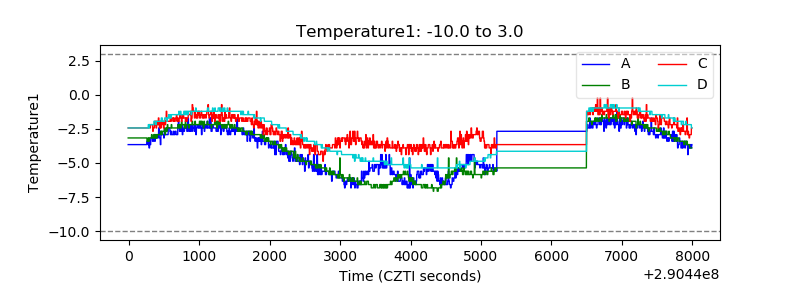 |
| Veto HV Monitor | 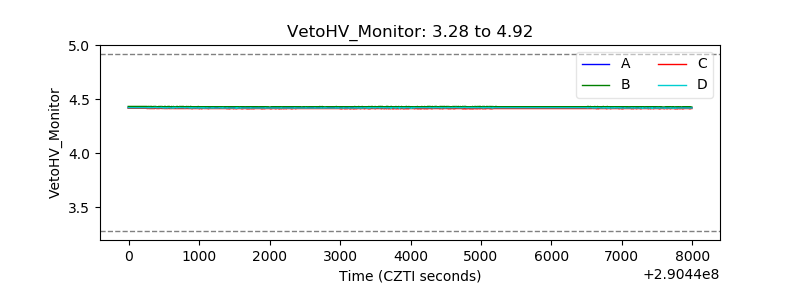 |
| Veto LLD | 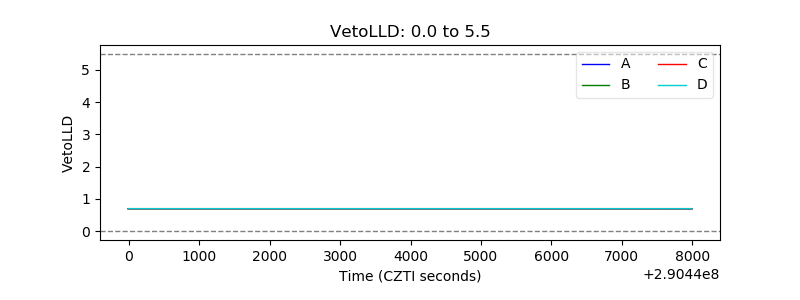 |
| Alpha Counter | 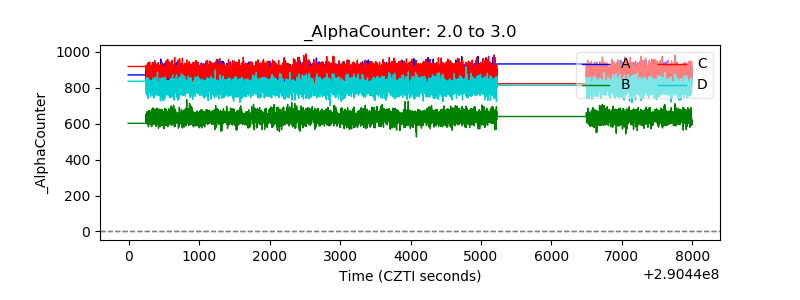 |
| _CPM_Rate | 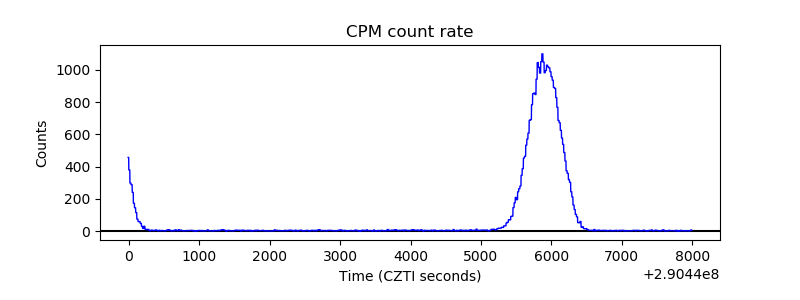 |
| CZT Counter |  |
| +2.5 Volts monitor |  |
| +5 Volts monitor |  |
| _ROLL_ROT | 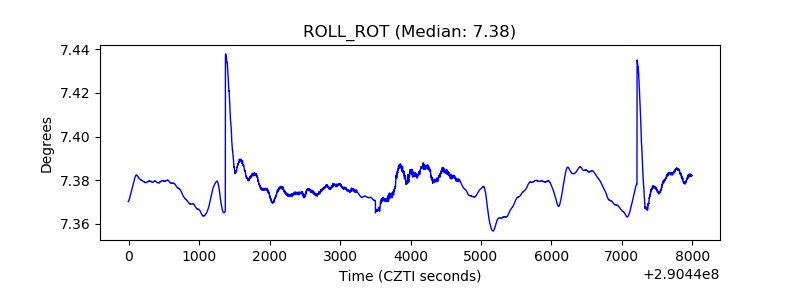 |
| _Roll_DEC | 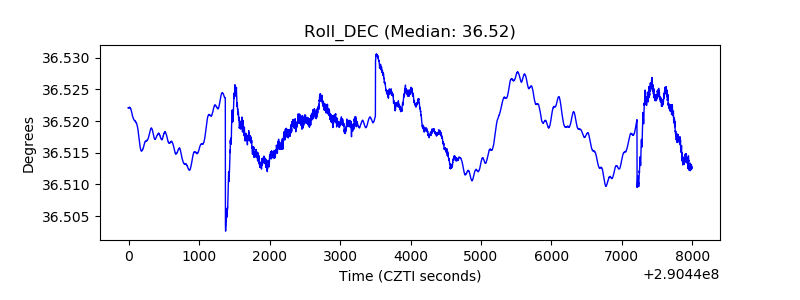 |
| _Roll_RA |  |
| Veto Counter | 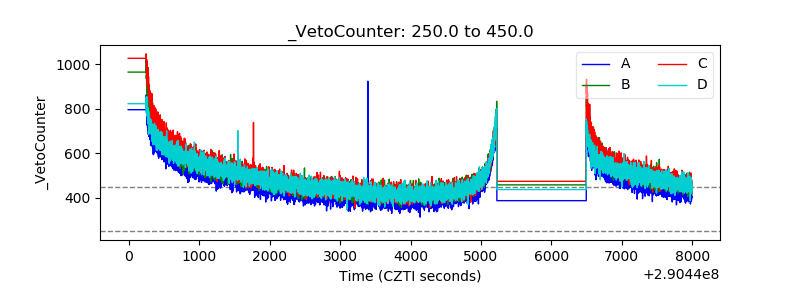 |