| Param | Original file | Final file |
|---|---|---|
| Filename | modeM0/AS1A05_072T04_9000002802_18733cztM0_level2.evt | modeM0/AS1A05_072T04_9000002802_18733cztM0_level2_quad_clean.evt |
| Size (bytes) | 493,606,080 | 90,429,120 |
| Size | 470.7 MB | 86.2 MB |
| Events in quadrant A | 3,427,995 | 567,254 |
| Events in quadrant B | 3,797,211 | 571,633 |
| Events in quadrant C | 3,571,715 | 560,095 |
| Events in quadrant D | 3,674,351 | 549,940 |
| Mode SS | |||
|---|---|---|---|
| Quadrant | BADHDUFLAG | Total packets | Discarded packets |
| A | 0 | 146 | 0 |
| B | 0 | 146 | 0 |
| C | 0 | 146 | 0 |
| D | 0 | 146 | 0 |
| Mode M9 | |||
|---|---|---|---|
| Quadrant | BADHDUFLAG | Total packets | Discarded packets |
| A | 0 | 16 | 0 |
| B | 0 | 16 | 0 |
| C | 0 | 16 | 0 |
| D | 0 | 16 | 0 |
| Mode M0 | |||
|---|---|---|---|
| Quadrant | BADHDUFLAG | Total packets | Discarded packets |
| A | 0 | 14701 | 2 |
| B | 0 | 15837 | 2 |
| C | 0 | 14886 | 2 |
| D | 0 | 15670 | 2 |
| Quadrant | Total seconds | Saturated seconds | Saturation percentage |
|---|---|---|---|
| A | 7025 | 112 | 1.594306% |
| B | 7025 | 180 | 2.562278% |
| C | 7025 | 168 | 2.391459% |
| D | 7025 | 181 | 2.576512% |
Noise dominated data is calculated using 1-second bins in cleaned event files. If a bin has >2000 counts, and if more than 50% of those come from <1% of pixels, then it is considered to be noise-dominated and hence unusable.
| Quadrant | # 1 sec bins | Bins with >0 counts | Bins with >2000 counts | High rate bins dominated by noise | Noise dominated (total time) | Noise dominated (detector-on time) | Marked lightcurve |
|---|---|---|---|---|---|---|---|
| A | 8725 | 7027 | 0 | 0 | 0.00% | 0.00% | 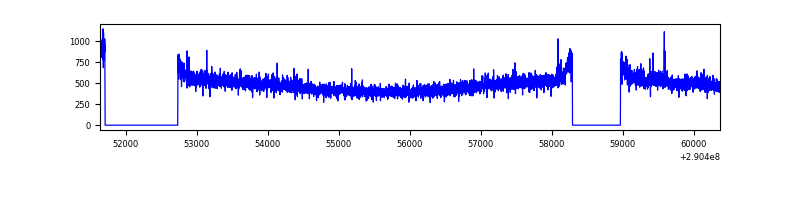 |
| B | 8725 | 7027 | 19 | 19 | 0.22% | 0.27% | 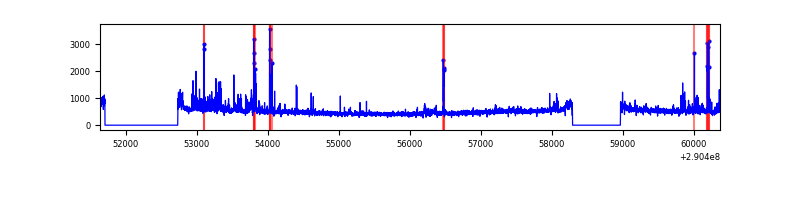 |
| C | 8725 | 7027 | 0 | 0 | 0.00% | 0.00% | 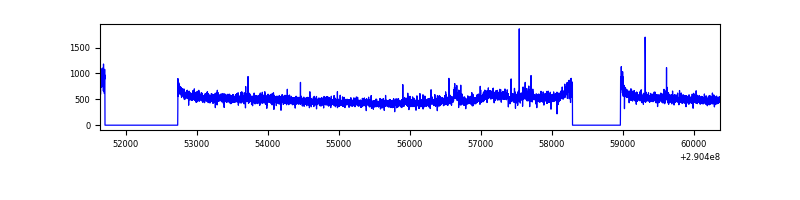 |
| D | 8725 | 7027 | 47 | 47 | 0.54% | 0.67% | 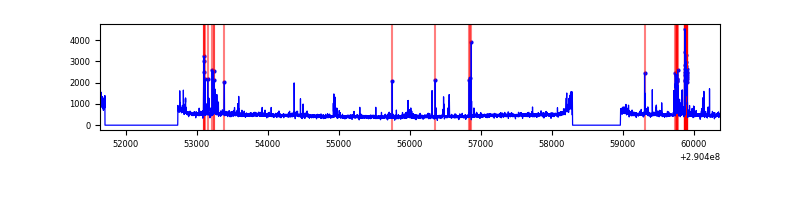 |
Top three noisy pixels from each quadrant. If the there are fewer than three noisy pixels in the level2.evt file, extra rows are filled as -1
| Pixel properties | Quadrant properties | ||||||
|---|---|---|---|---|---|---|---|
| Quadrant | DetID | PixID | Counts | Sigma | Mean | Median | Sigma |
| A | 11 | 29 | 23328 | 126.69 | 877 | 858 | 177.4 |
| A | 15 | 192 | 17178 | 92.01 | 877 | 858 | 177.4 |
| A | 13 | 254 | 11722 | 61.25 | 877 | 858 | 177.4 |
| B | 7 | 220 | 163197 | 981.48 | 872 | 852 | 165.4 |
| B | 10 | 245 | 112891 | 677.35 | 872 | 852 | 165.4 |
| B | 0 | 229 | 21635 | 125.65 | 872 | 852 | 165.4 |
| C | 14 | 238 | 130968 | 660.64 | 843 | 848 | 197.0 |
| C | 3 | 233 | 126539 | 638.15 | 843 | 848 | 197.0 |
| C | 8 | 128 | 11871 | 55.97 | 843 | 848 | 197.0 |
| D | 14 | 34 | 176347 | 847.42 | 855 | 831 | 207.1 |
| D | 10 | 70 | 100896 | 483.13 | 855 | 831 | 207.1 |
| D | 7 | 238 | 62720 | 298.81 | 855 | 831 | 207.1 |
Histogram calculated using DETX and DETY for each event in the final _common_clean file
| Quadrant A | 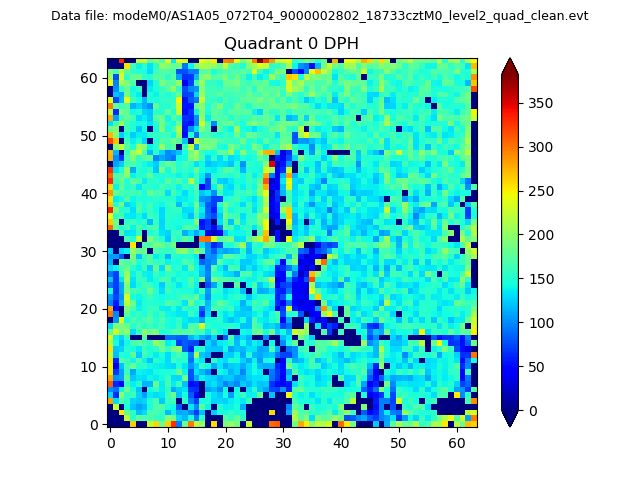 |
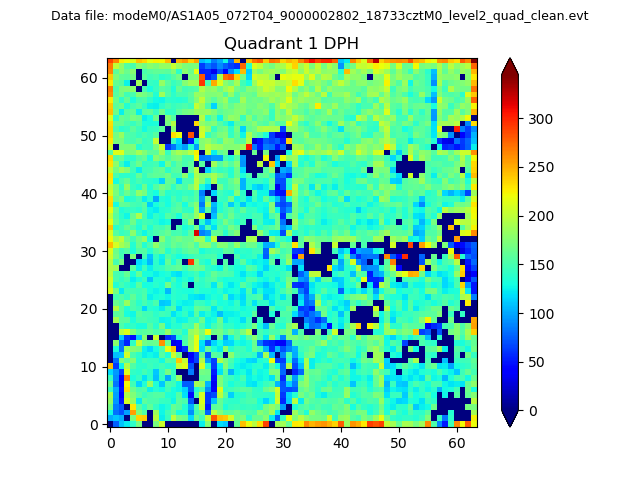 |
Quadrant B |
|---|---|---|---|
| Quadrant D | 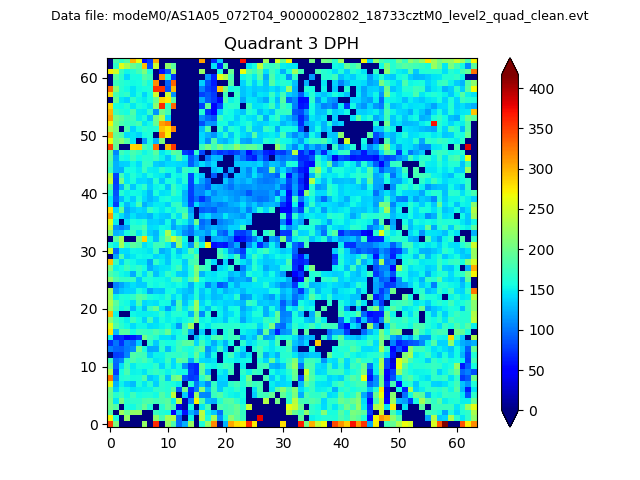 |
 |
Quadrant C |
| Plot type | Count rate plots | Images |
|---|---|---|
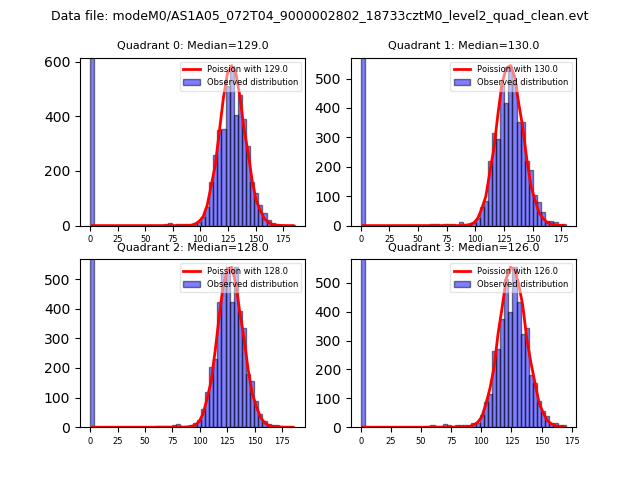
| Comparison with Poisson distribution Blue bars denote a histogram of data divided into 1 sec bins. Red curve is a Poisson curve with rate = median count rate of data. |
 |
 |
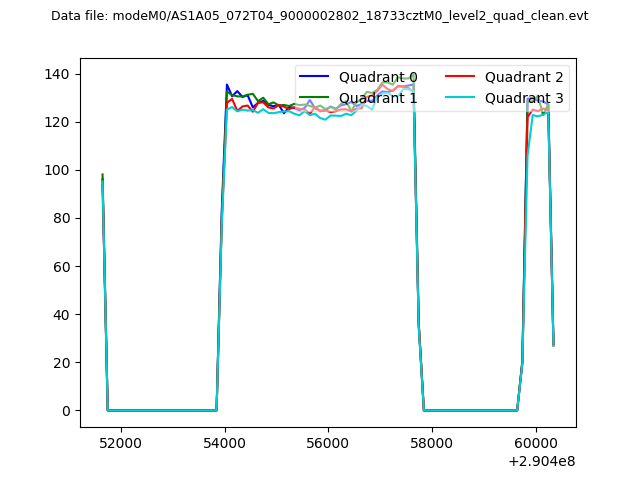
| Quadrant-wise count rates Data is divided into 100 sec bins |
 |
|
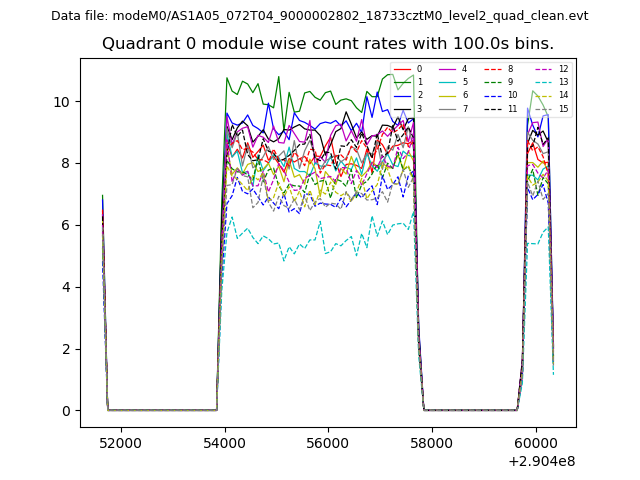
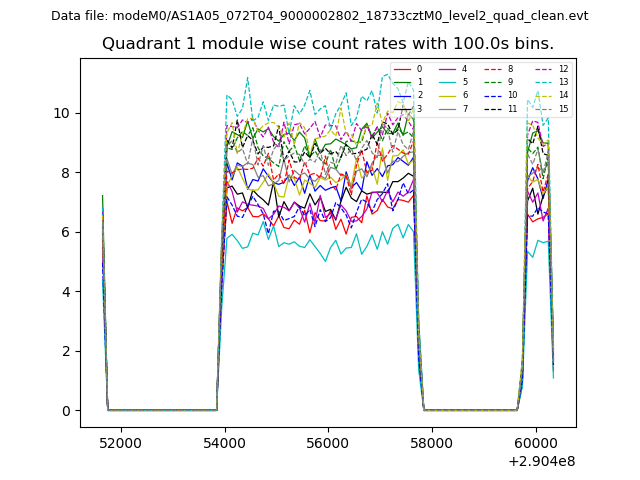
| Module-wise count rates for Quadrant A Data is divided into 100 sec bins |
 |
 |
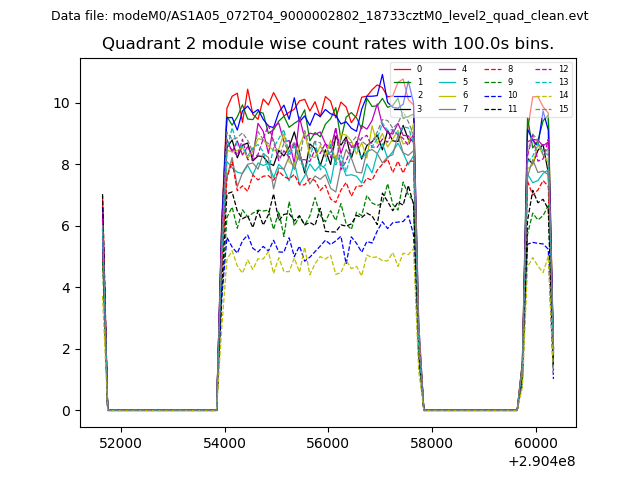
| Module-wise count rates for Quadrant B Data is divided into 100 sec bins |
 |
 |
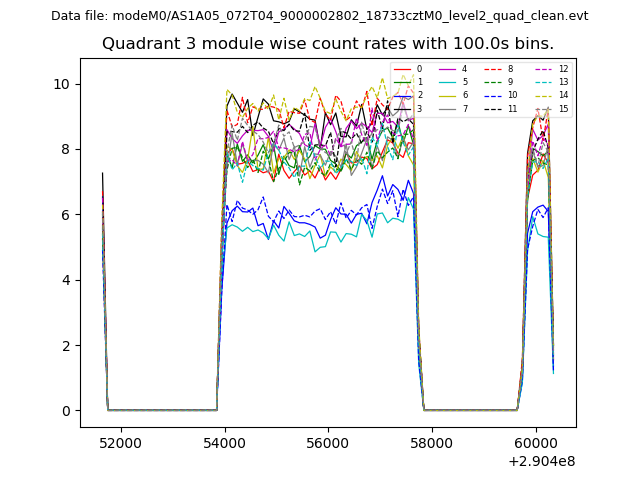
| Module-wise count rates for Quadrant C Data is divided into 100 sec bins |
 |
 |
| Module-wise count rates for Quadrant D Data is divided into 100 sec bins |
 |
 |
| Parameter | Plot |
|---|---|
| CZT HV Monitor | 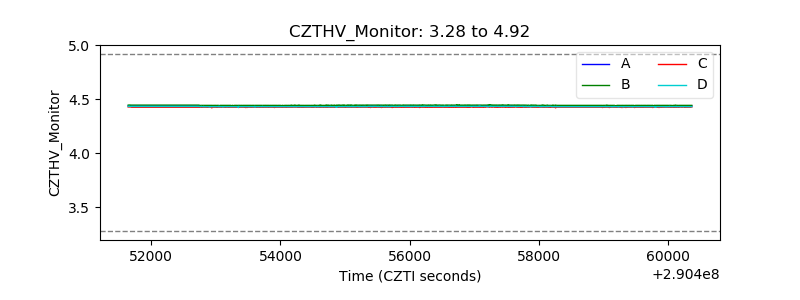 |
| D_VDD |  |
| Temperature 1 | 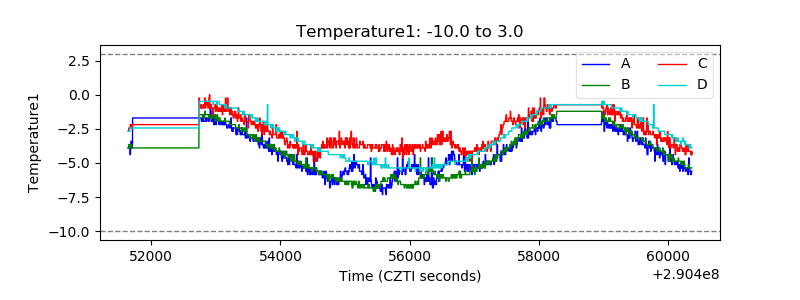 |
| Veto HV Monitor | 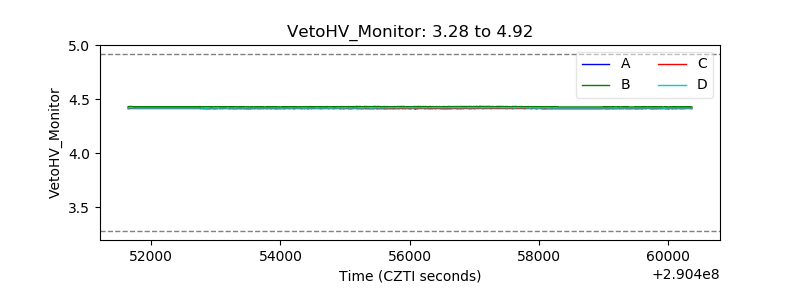 |
| Veto LLD | 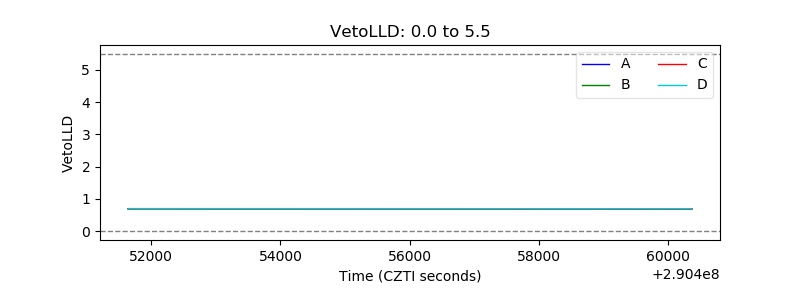 |
| Alpha Counter | 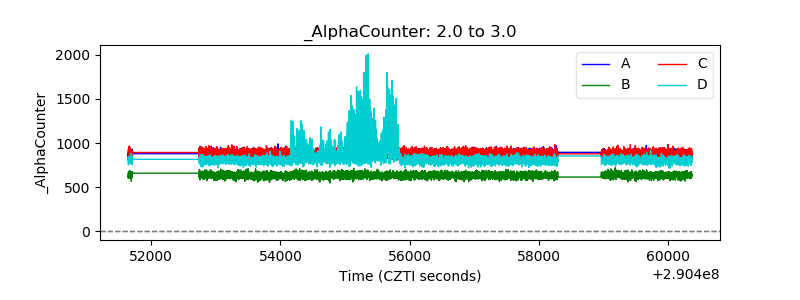 |
| _CPM_Rate | 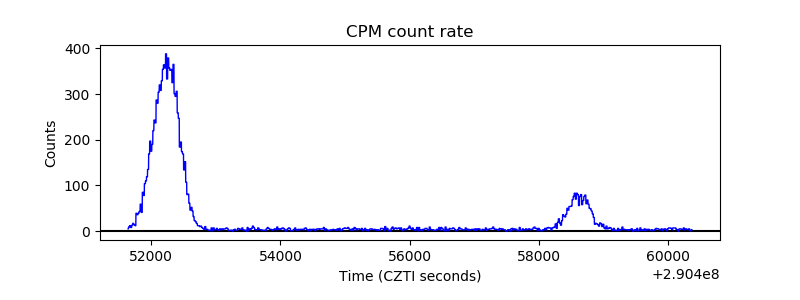 |
| CZT Counter | 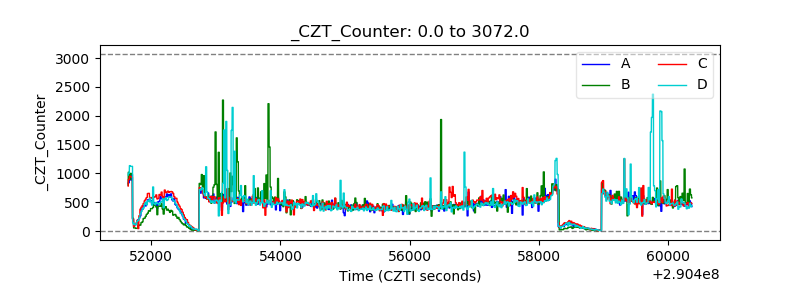 |
| +2.5 Volts monitor |  |
| +5 Volts monitor |  |
| _ROLL_ROT | 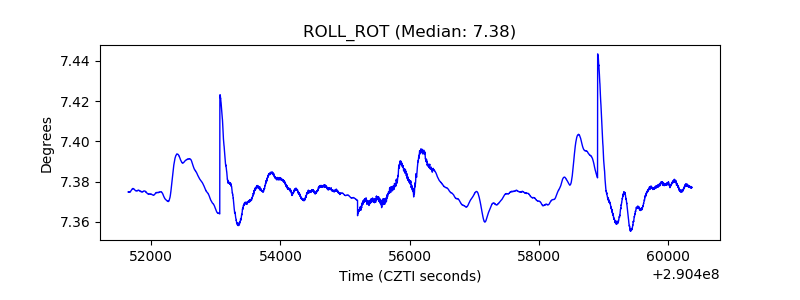 |
| _Roll_DEC | 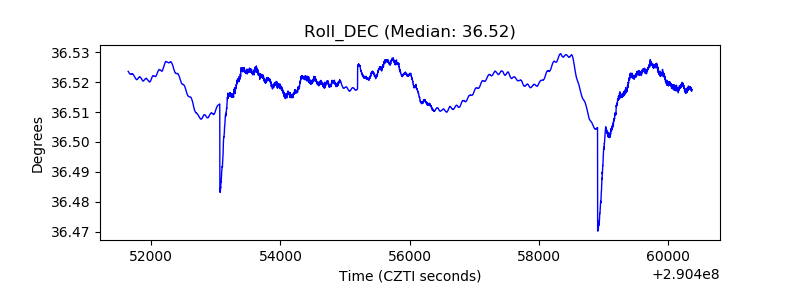 |
| _Roll_RA |  |
| Veto Counter | 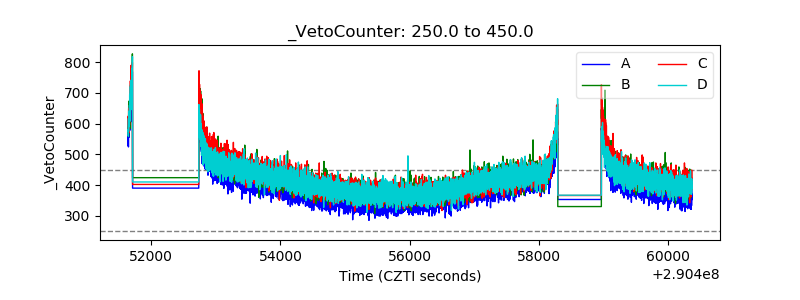 |