| Param | Original file | Final file |
|---|---|---|
| Filename | modeM0/AS1A05_072T04_9000002802_18734cztM0_level2.evt | modeM0/AS1A05_072T04_9000002802_18734cztM0_level2_quad_clean.evt |
| Size (bytes) | 505,667,520 | 94,201,920 |
| Size | 482.2 MB | 89.8 MB |
| Events in quadrant A | 3,405,419 | 593,122 |
| Events in quadrant B | 4,559,046 | 595,579 |
| Events in quadrant C | 3,417,209 | 589,150 |
| Events in quadrant D | 3,449,449 | 579,415 |
| Mode SS | |||
|---|---|---|---|
| Quadrant | BADHDUFLAG | Total packets | Discarded packets |
| A | 0 | 146 | 0 |
| B | 0 | 146 | 0 |
| C | 0 | 146 | 0 |
| D | 0 | 146 | 0 |
| Mode M9 | |||
|---|---|---|---|
| Quadrant | BADHDUFLAG | Total packets | Discarded packets |
| A | 0 | 3 | 0 |
| B | 0 | 3 | 0 |
| C | 0 | 3 | 0 |
| D | 0 | 3 | 0 |
| Mode M0 | |||
|---|---|---|---|
| Quadrant | BADHDUFLAG | Total packets | Discarded packets |
| A | 0 | 14730 | 2 |
| B | 0 | 18189 | 1 |
| C | 0 | 14637 | 1 |
| D | 0 | 15223 | 1 |
| Quadrant | Total seconds | Saturated seconds | Saturation percentage |
|---|---|---|---|
| A | 7108 | 43 | 0.604952% |
| B | 7109 | 206 | 2.897735% |
| C | 7109 | 74 | 1.040934% |
| D | 7109 | 68 | 0.956534% |
Noise dominated data is calculated using 1-second bins in cleaned event files. If a bin has >2000 counts, and if more than 50% of those come from <1% of pixels, then it is considered to be noise-dominated and hence unusable.
| Quadrant | # 1 sec bins | Bins with >0 counts | Bins with >2000 counts | High rate bins dominated by noise | Noise dominated (total time) | Noise dominated (detector-on time) | Marked lightcurve |
|---|---|---|---|---|---|---|---|
| A | 7453 | 7109 | 0 | 0 | 0.00% | 0.00% | 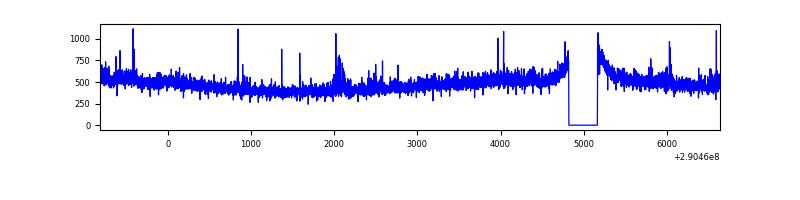 |
| B | 7454 | 7110 | 59 | 59 | 0.79% | 0.83% | 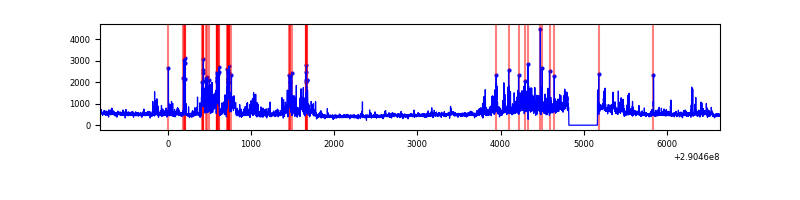 |
| C | 7454 | 7110 | 0 | 0 | 0.00% | 0.00% | 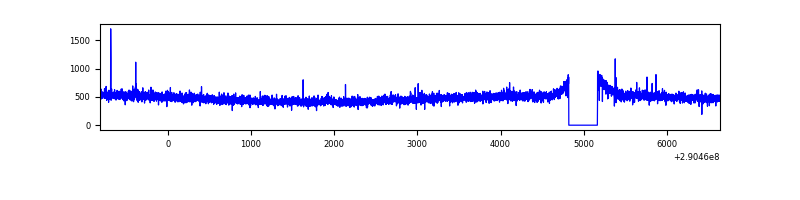 |
| D | 7454 | 7110 | 41 | 41 | 0.55% | 0.58% | 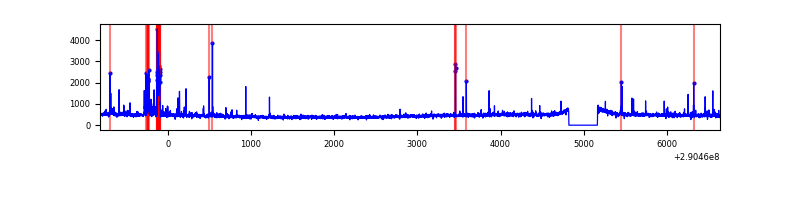 |
Top three noisy pixels from each quadrant. If the there are fewer than three noisy pixels in the level2.evt file, extra rows are filled as -1
| Pixel properties | Quadrant properties | ||||||
|---|---|---|---|---|---|---|---|
| Quadrant | DetID | PixID | Counts | Sigma | Mean | Median | Sigma |
| A | 15 | 192 | 60021 | 339.84 | 859 | 840 | 174.1 |
| A | 11 | 29 | 22961 | 127.03 | 859 | 840 | 174.1 |
| A | 13 | 254 | 11418 | 60.74 | 859 | 840 | 174.1 |
| B | 10 | 245 | 988039 | 6026.25 | 855 | 833 | 163.8 |
| B | 7 | 220 | 106769 | 646.67 | 855 | 833 | 163.8 |
| B | 0 | 197 | 29684 | 176.12 | 855 | 833 | 163.8 |
| C | 14 | 238 | 128281 | 656.72 | 829 | 836 | 194.1 |
| C | 3 | 233 | 46457 | 235.08 | 829 | 836 | 194.1 |
| C | 0 | 207 | 6306 | 28.19 | 829 | 836 | 194.1 |
| D | 14 | 34 | 178705 | 864.99 | 840 | 812 | 205.7 |
| D | 2 | 234 | 31481 | 149.13 | 840 | 812 | 205.7 |
| D | 7 | 238 | 28683 | 135.52 | 840 | 812 | 205.7 |
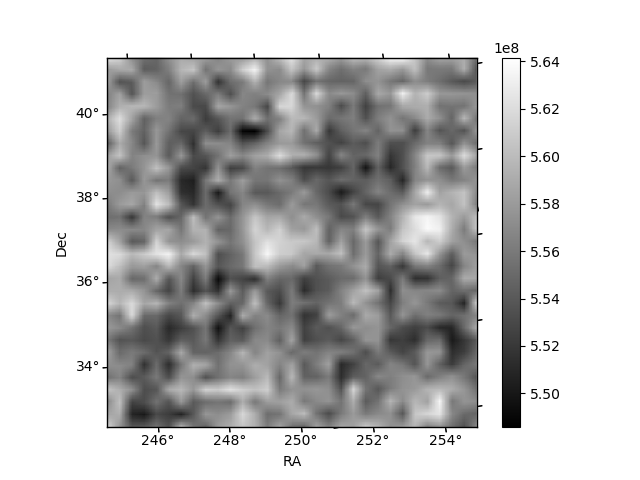
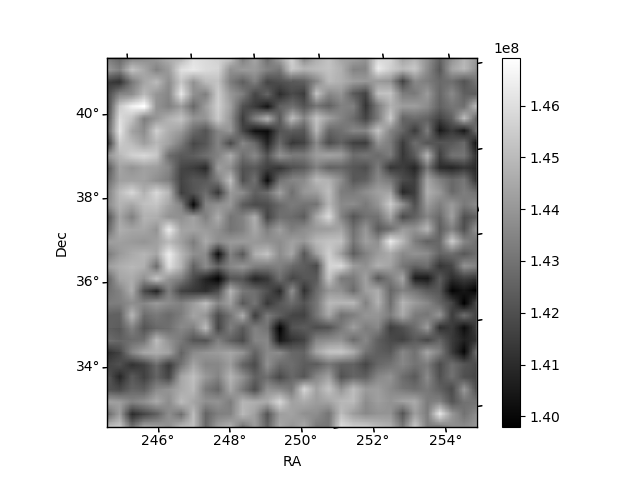
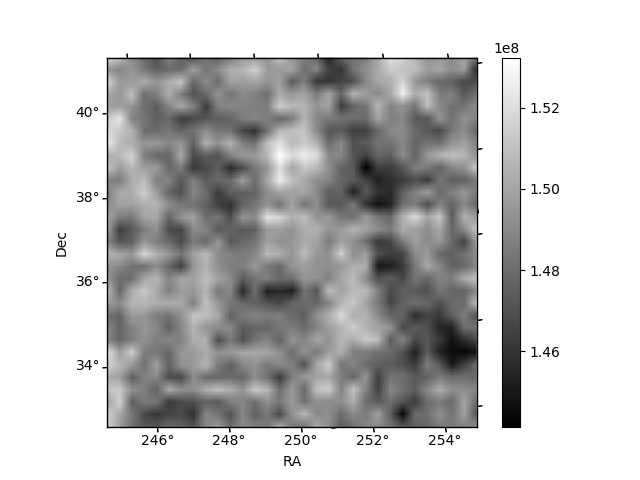
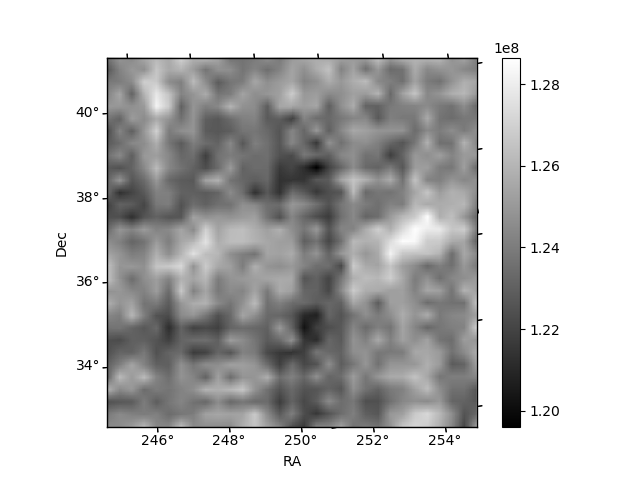
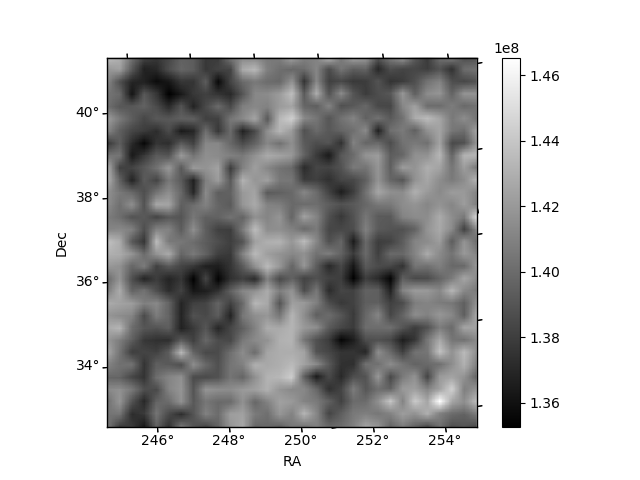
Histogram calculated using DETX and DETY for each event in the final _common_clean file
| Quadrant A | 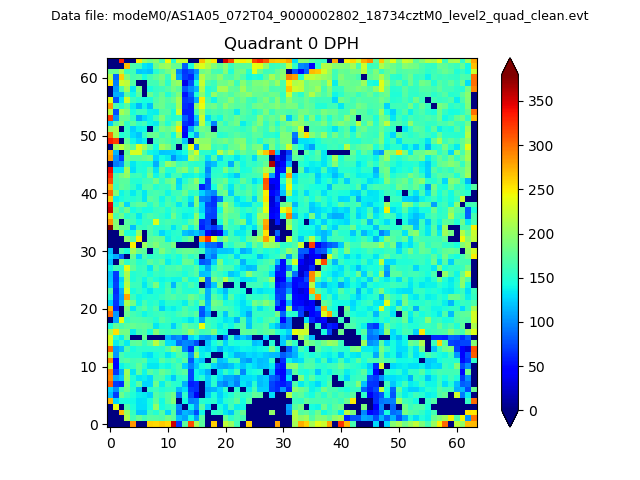 |
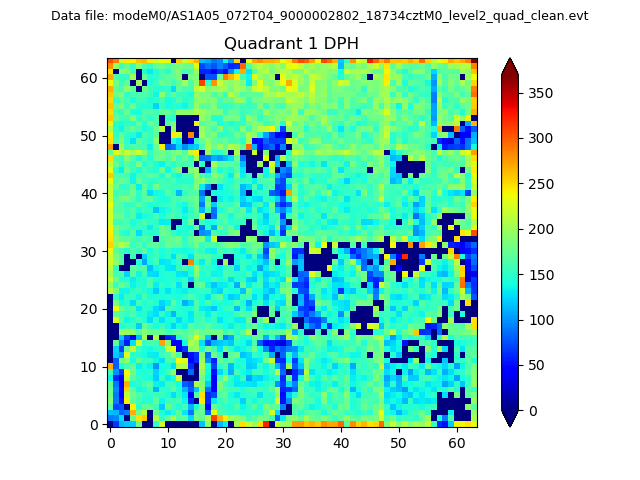 |
Quadrant B |
|---|---|---|---|
| Quadrant D | 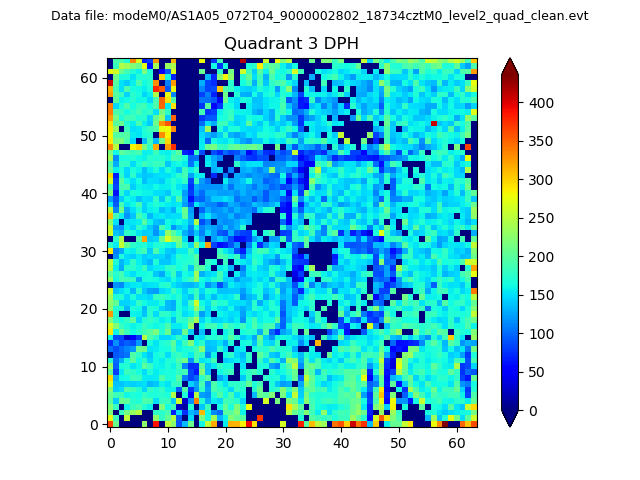 |
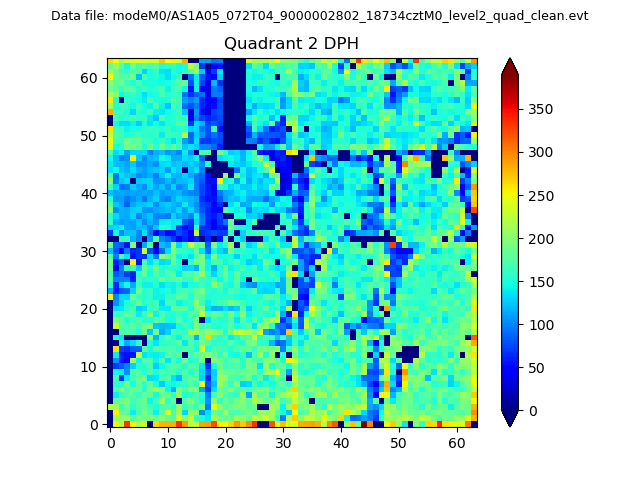 |
Quadrant C |
| Plot type | Count rate plots | Images |
|---|---|---|
| Comparison with Poisson distribution Blue bars denote a histogram of data divided into 1 sec bins. Red curve is a Poisson curve with rate = median count rate of data. |
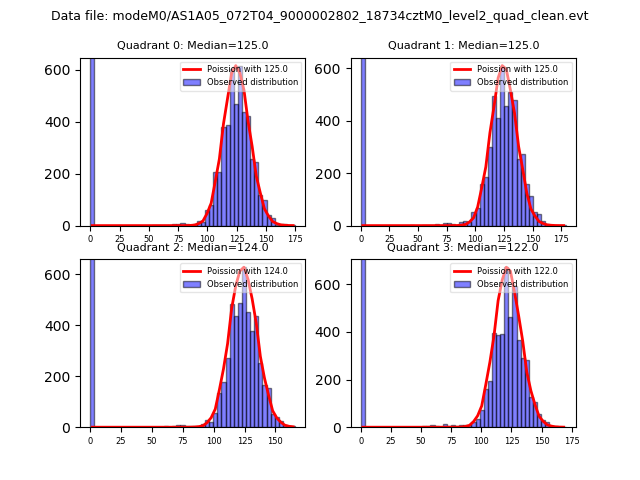 |
 |
| Quadrant-wise count rates Data is divided into 100 sec bins |
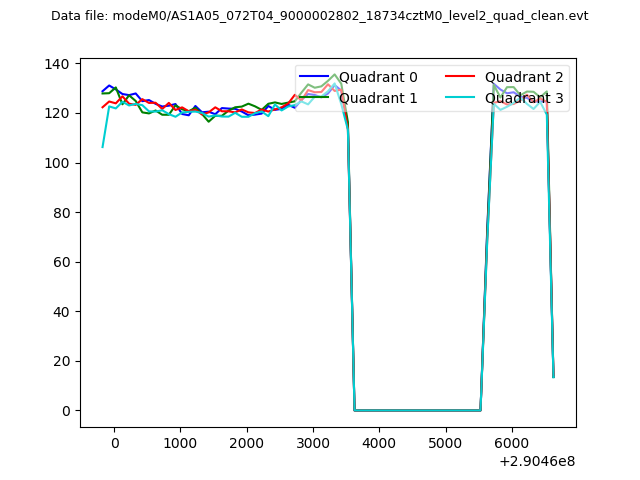 |
|
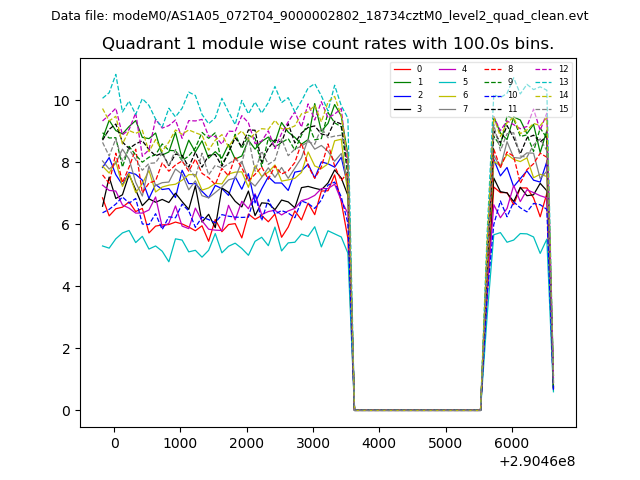
| Module-wise count rates for Quadrant A Data is divided into 100 sec bins |
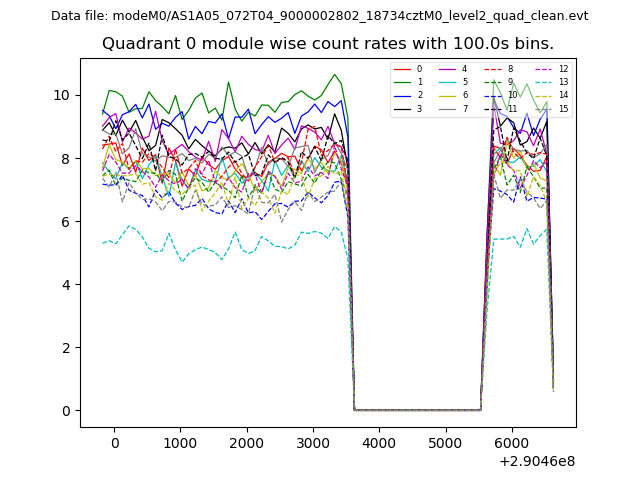 |
 |
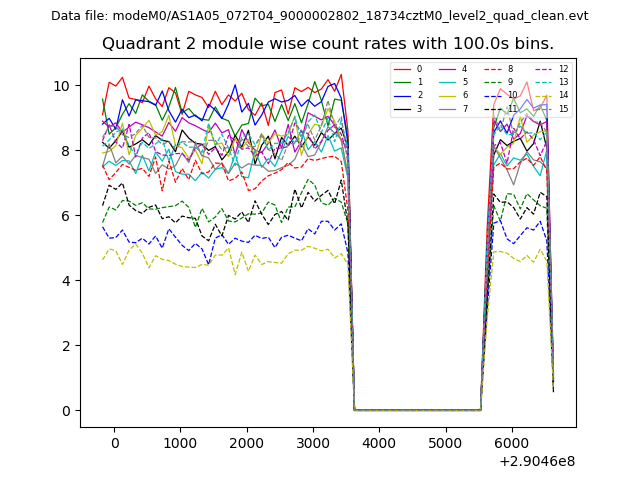
| Module-wise count rates for Quadrant B Data is divided into 100 sec bins |
 |
 |
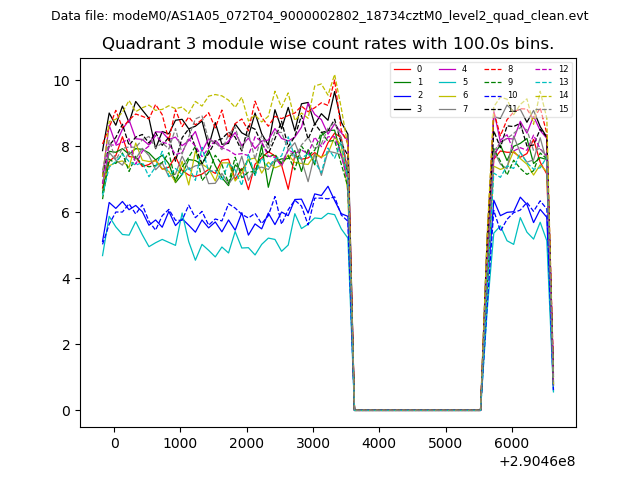
| Module-wise count rates for Quadrant C Data is divided into 100 sec bins |
 |
 |
| Module-wise count rates for Quadrant D Data is divided into 100 sec bins |
 |
 |
| Parameter | Plot |
|---|---|
| CZT HV Monitor | 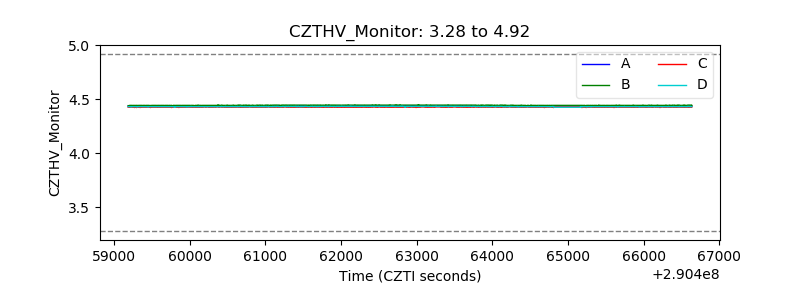 |
| D_VDD | 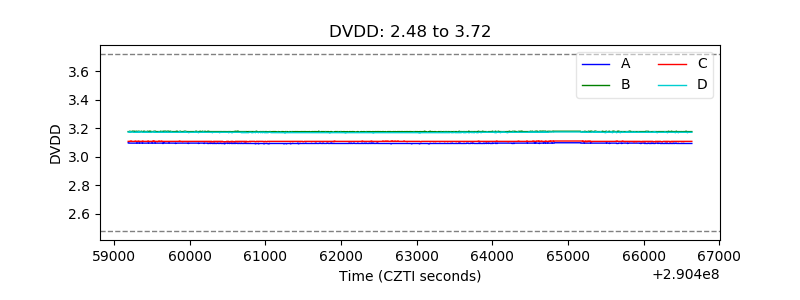 |
| Temperature 1 | 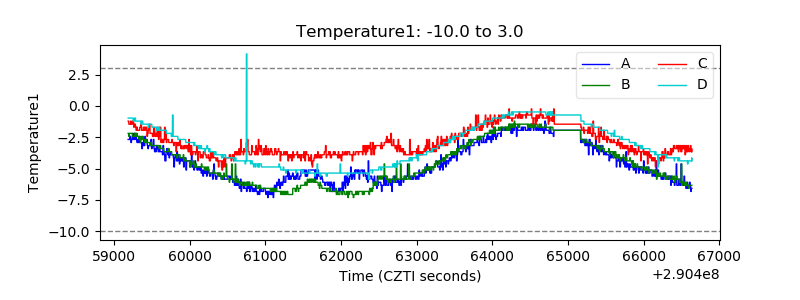 |
| Veto HV Monitor | 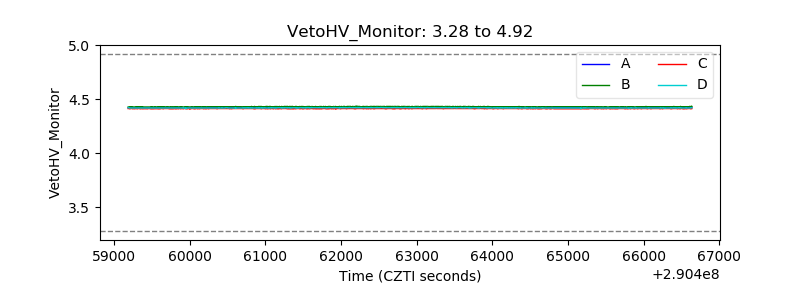 |
| Veto LLD | 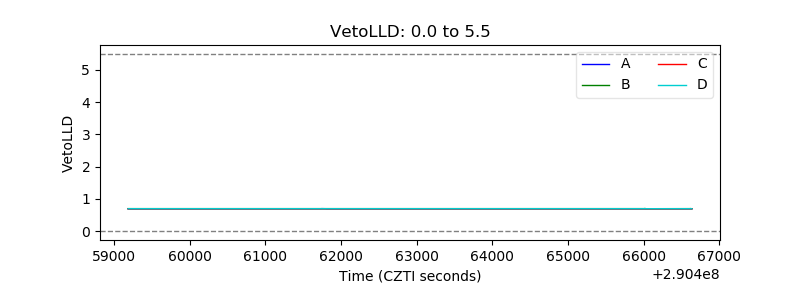 |
| Alpha Counter | 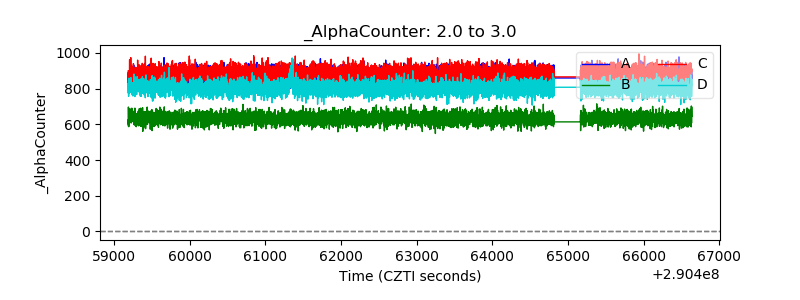 |
| _CPM_Rate | 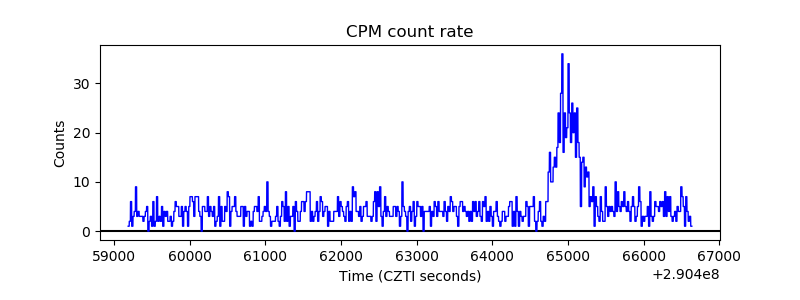 |
| CZT Counter | 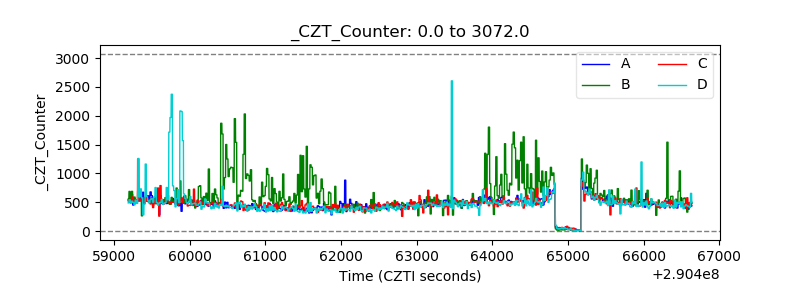 |
| +2.5 Volts monitor |  |
| +5 Volts monitor | 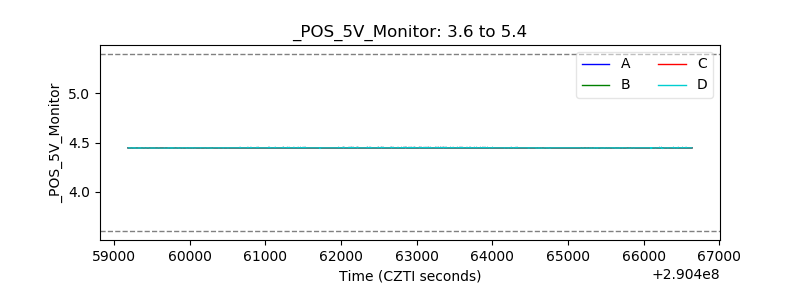 |
| _ROLL_ROT | 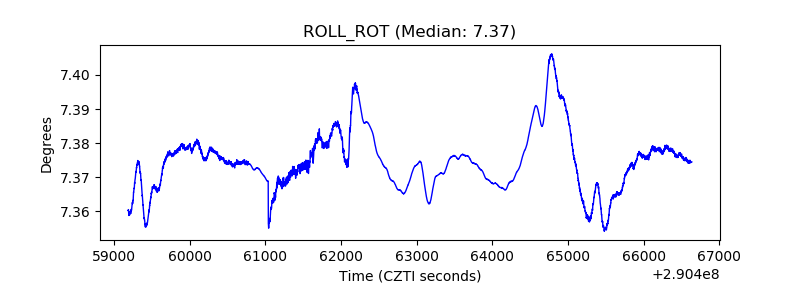 |
| _Roll_DEC | 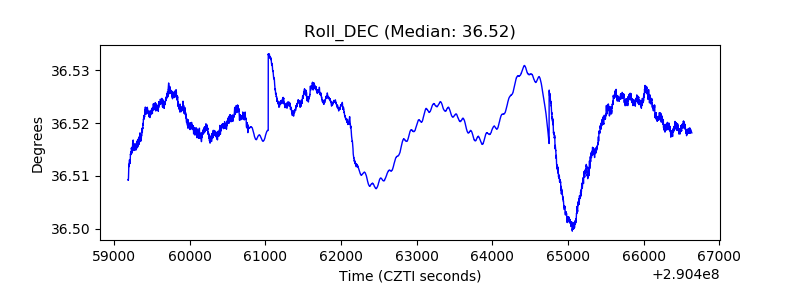 |
| _Roll_RA | 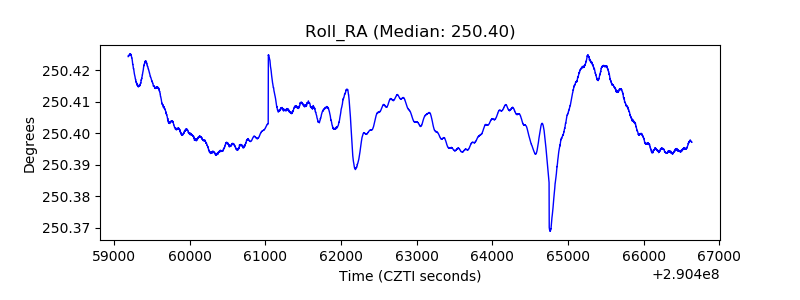 |
| Veto Counter | 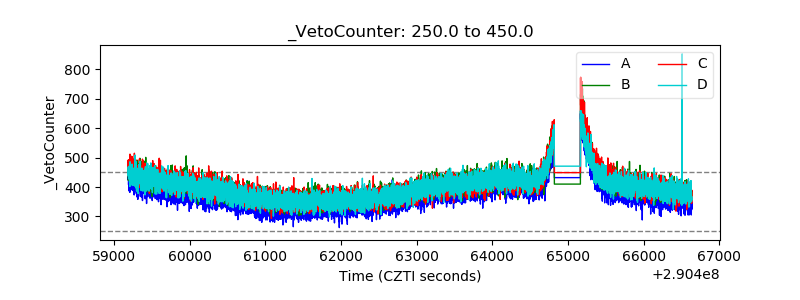 |