| Param | Original file | Final file |
|---|---|---|
| Filename | modeM0/AS1A05_072T04_9000002802_18735cztM0_level2.evt | modeM0/AS1A05_072T04_9000002802_18735cztM0_level2_quad_clean.evt |
| Size (bytes) | 559,742,400 | 102,749,760 |
| Size | 533.8 MB | 98.0 MB |
| Events in quadrant A | 3,588,299 | 654,681 |
| Events in quadrant B | 5,307,722 | 649,830 |
| Events in quadrant C | 3,770,104 | 650,427 |
| Events in quadrant D | 3,773,480 | 631,709 |
| Mode SS | |||
|---|---|---|---|
| Quadrant | BADHDUFLAG | Total packets | Discarded packets |
| A | 0 | 156 | 0 |
| B | 0 | 156 | 0 |
| C | 0 | 156 | 0 |
| D | 0 | 156 | 0 |
| Mode M9 | |||
|---|---|---|---|
| Quadrant | BADHDUFLAG | Total packets | Discarded packets |
| A | 0 | 5 | 0 |
| B | 0 | 6 | 0 |
| C | 0 | 6 | 0 |
| D | 0 | 6 | 0 |
| Mode M0 | |||
|---|---|---|---|
| Quadrant | BADHDUFLAG | Total packets | Discarded packets |
| A | 0 | 15714 | 2 |
| B | 0 | 20814 | 2 |
| C | 0 | 16004 | 2 |
| D | 0 | 16508 | 2 |
| Quadrant | Total seconds | Saturated seconds | Saturation percentage |
|---|---|---|---|
| A | 7544 | 72 | 0.954401% |
| B | 7544 | 527 | 6.985684% |
| C | 7544 | 147 | 1.948568% |
| D | 7543 | 155 | 2.054885% |
Noise dominated data is calculated using 1-second bins in cleaned event files. If a bin has >2000 counts, and if more than 50% of those come from <1% of pixels, then it is considered to be noise-dominated and hence unusable.
| Quadrant | # 1 sec bins | Bins with >0 counts | Bins with >2000 counts | High rate bins dominated by noise | Noise dominated (total time) | Noise dominated (detector-on time) | Marked lightcurve |
|---|---|---|---|---|---|---|---|
| A | 7859 | 7545 | 0 | 0 | 0.00% | 0.00% | 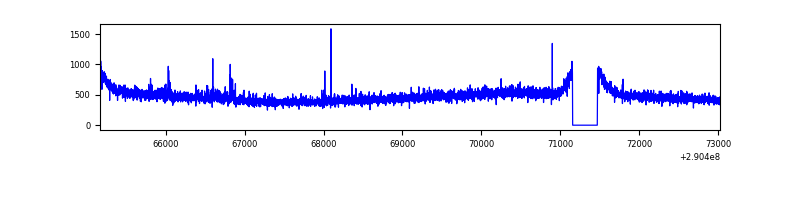 |
| B | 7859 | 7545 | 181 | 181 | 2.30% | 2.40% | 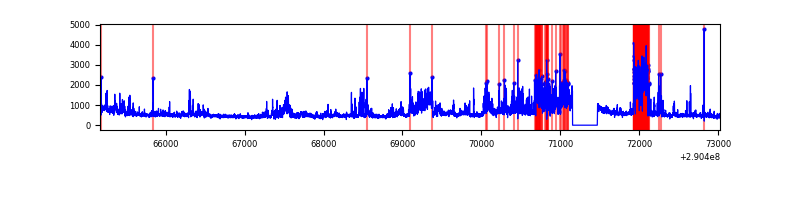 |
| C | 7859 | 7545 | 1 | 1 | 0.01% | 0.01% | 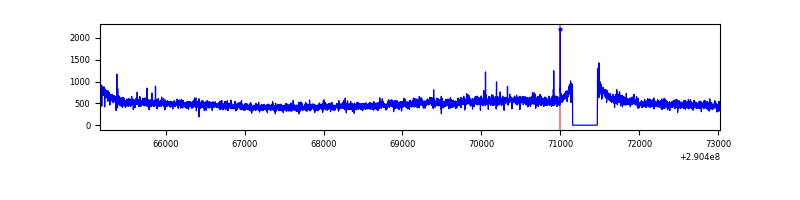 |
| D | 7858 | 7544 | 98 | 98 | 1.25% | 1.30% | 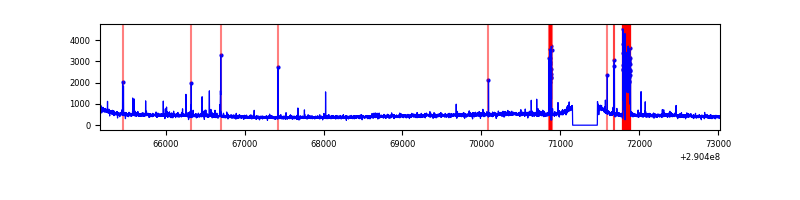 |
Top three noisy pixels from each quadrant. If the there are fewer than three noisy pixels in the level2.evt file, extra rows are filled as -1
| Pixel properties | Quadrant properties | ||||||
|---|---|---|---|---|---|---|---|
| Quadrant | DetID | PixID | Counts | Sigma | Mean | Median | Sigma |
| A | 15 | 192 | 32100 | 167.42 | 918 | 900 | 186.4 |
| A | 13 | 254 | 11961 | 59.35 | 918 | 900 | 186.4 |
| A | 11 | 29 | 10973 | 54.05 | 918 | 900 | 186.4 |
| B | 10 | 245 | 1404063 | 8094.29 | 902 | 879 | 173.4 |
| B | 12 | 18 | 171665 | 985.18 | 902 | 879 | 173.4 |
| B | 7 | 220 | 98283 | 561.88 | 902 | 879 | 173.4 |
| C | 3 | 233 | 162656 | 773.35 | 885 | 887 | 209.2 |
| C | 14 | 238 | 137370 | 652.47 | 885 | 887 | 209.2 |
| C | 0 | 239 | 9924 | 43.2 | 885 | 887 | 209.2 |
| D | 14 | 34 | 252888 | 1153.71 | 890 | 865 | 218.4 |
| D | 7 | 96 | 34040 | 151.87 | 890 | 865 | 218.4 |
| D | 2 | 234 | 32304 | 143.92 | 890 | 865 | 218.4 |
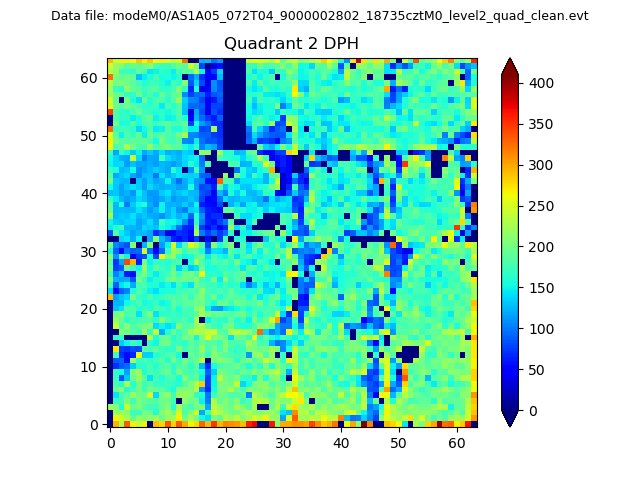
Histogram calculated using DETX and DETY for each event in the final _common_clean file
| Quadrant A | 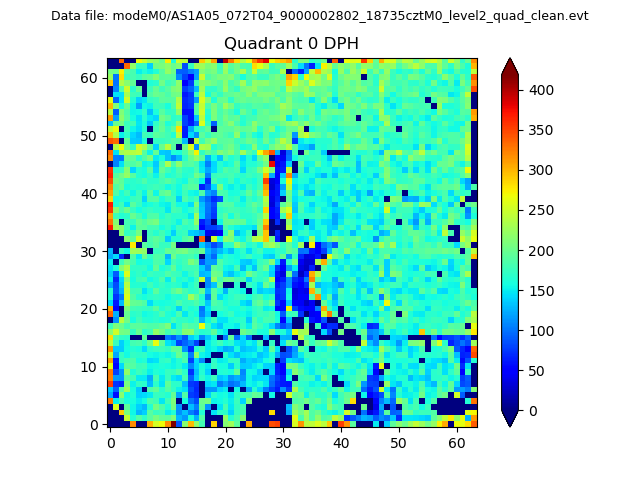 |
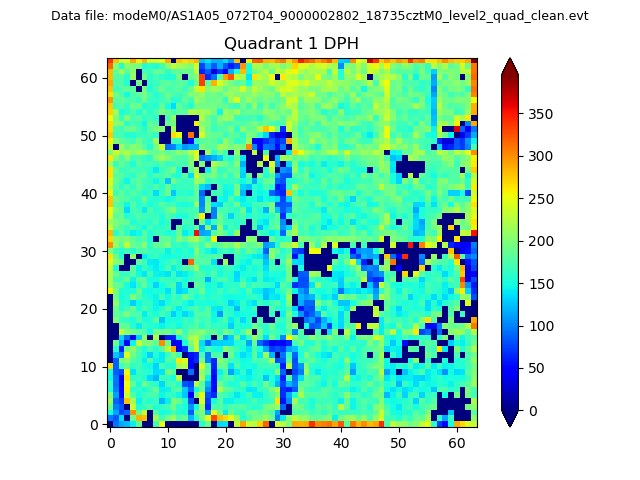 |
Quadrant B |
|---|---|---|---|
| Quadrant D | 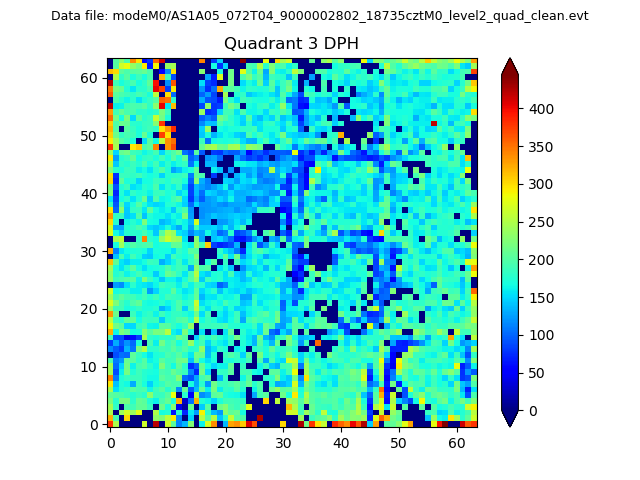 |
 |
Quadrant C |
| Plot type | Count rate plots | Images |
|---|---|---|
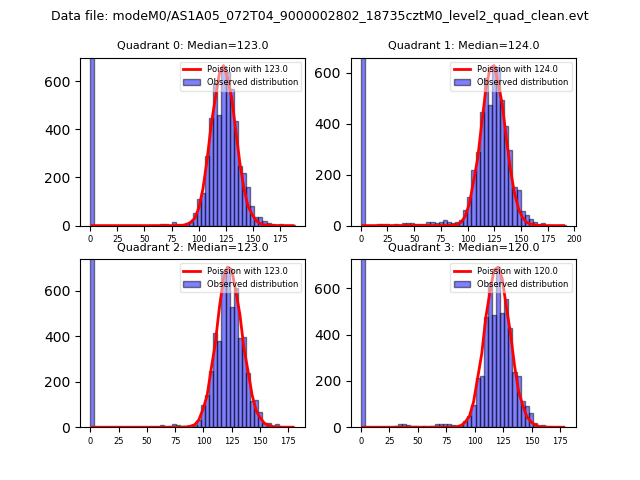
| Comparison with Poisson distribution Blue bars denote a histogram of data divided into 1 sec bins. Red curve is a Poisson curve with rate = median count rate of data. |
 |
 |
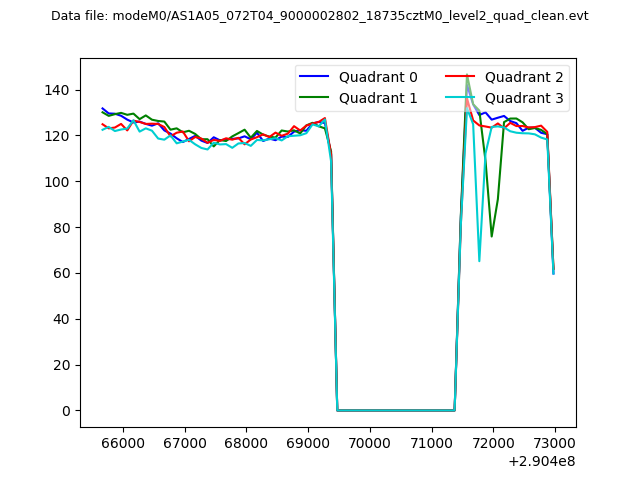
| Quadrant-wise count rates Data is divided into 100 sec bins |
 |
|
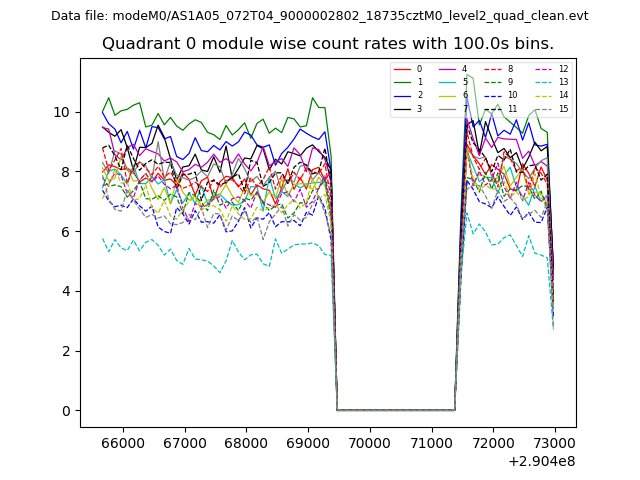
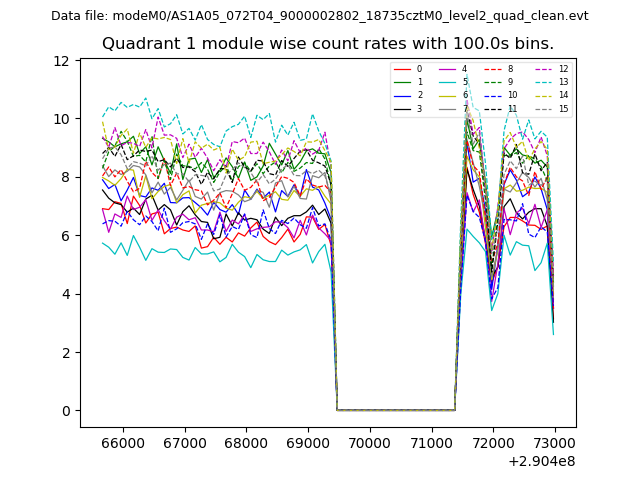
| Module-wise count rates for Quadrant A Data is divided into 100 sec bins |
 |
 |
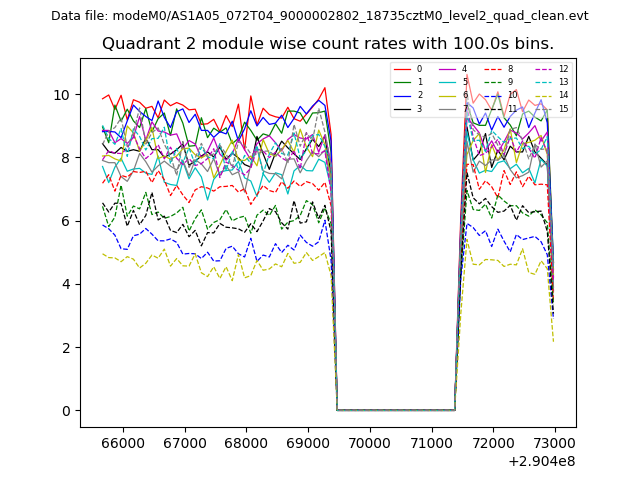
| Module-wise count rates for Quadrant B Data is divided into 100 sec bins |
 |
 |
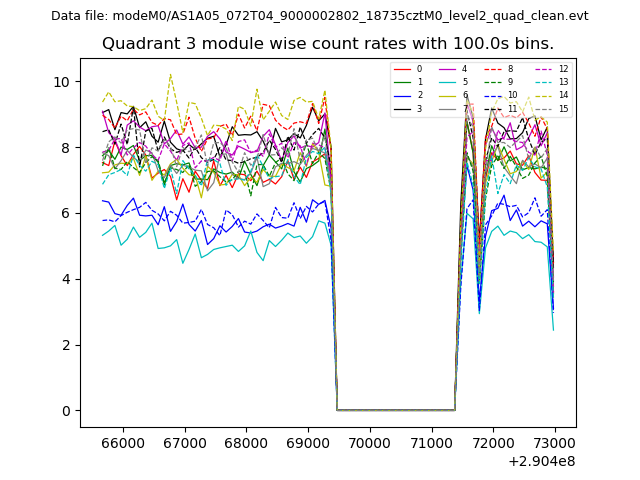
| Module-wise count rates for Quadrant C Data is divided into 100 sec bins |
 |
 |
| Module-wise count rates for Quadrant D Data is divided into 100 sec bins |
 |
 |
| Parameter | Plot |
|---|---|
| CZT HV Monitor | 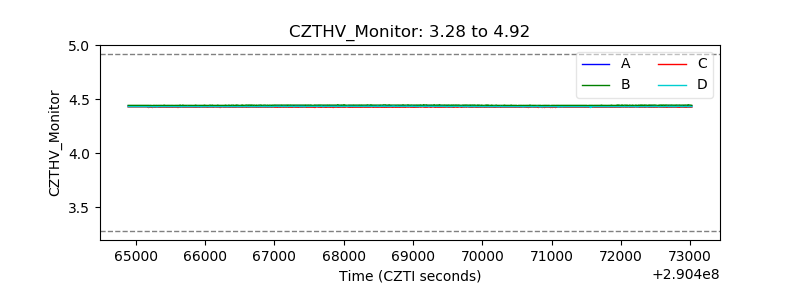 |
| D_VDD | 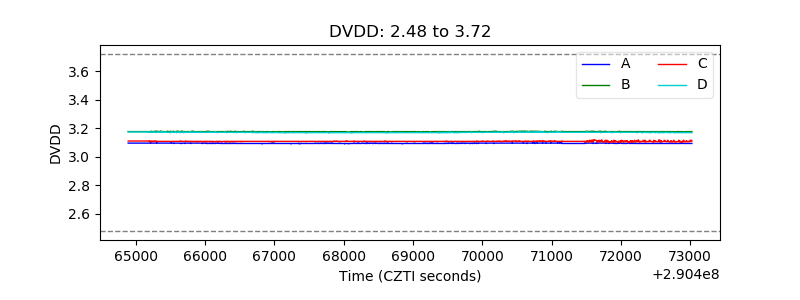 |
| Temperature 1 | 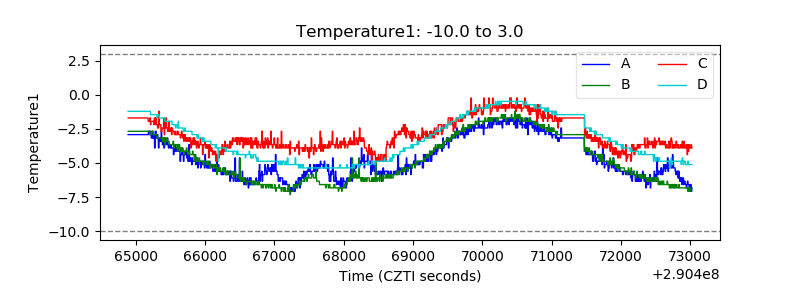 |
| Veto HV Monitor | 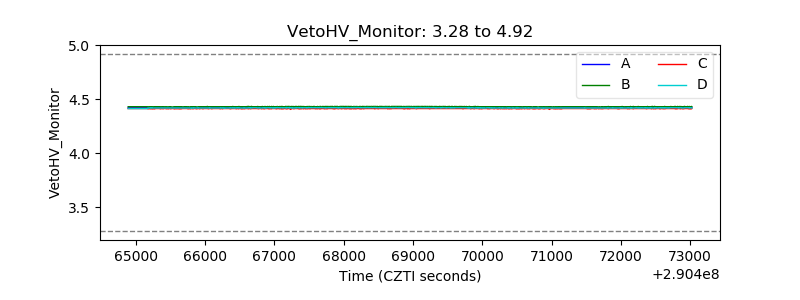 |
| Veto LLD | 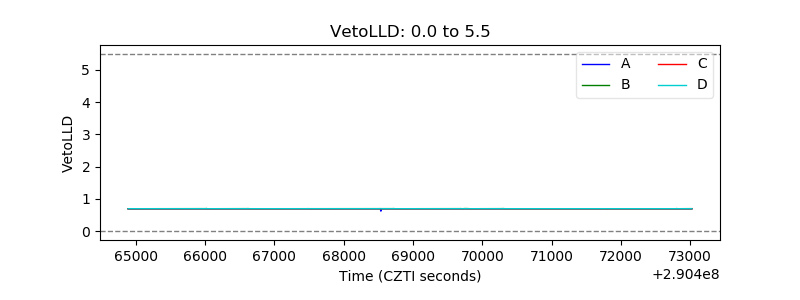 |
| Alpha Counter | 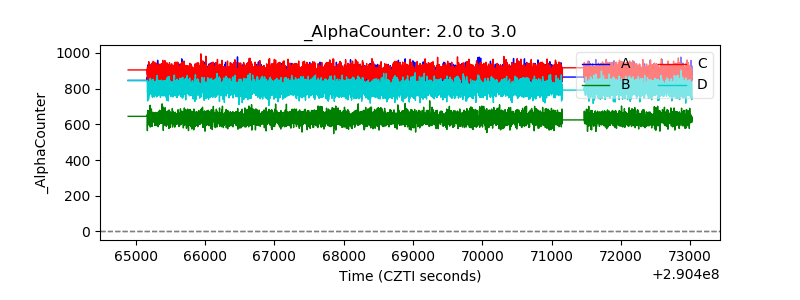 |
| _CPM_Rate | 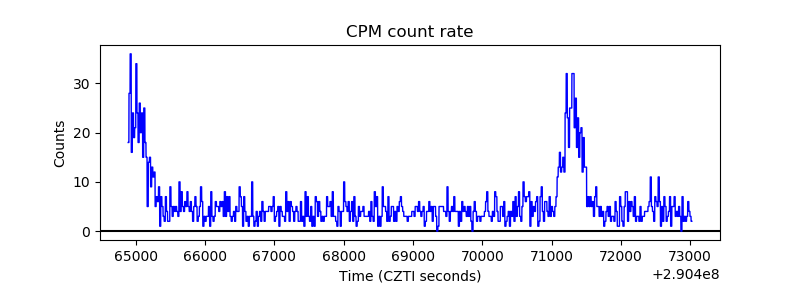 |
| CZT Counter | 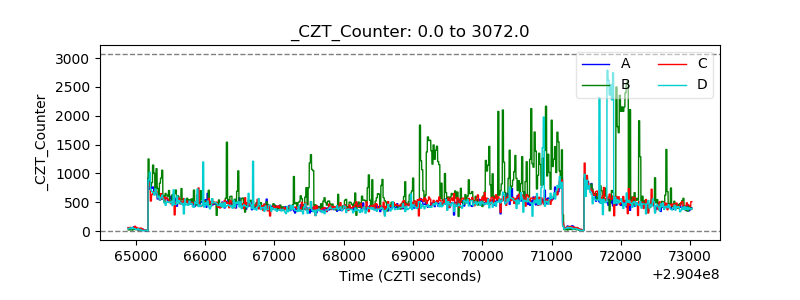 |
| +2.5 Volts monitor |  |
| +5 Volts monitor |  |
| _ROLL_ROT | 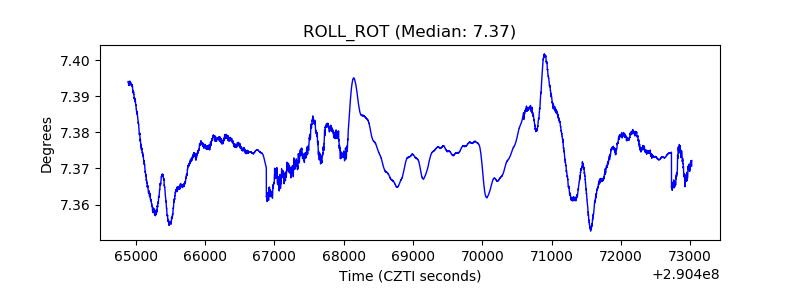 |
| _Roll_DEC | 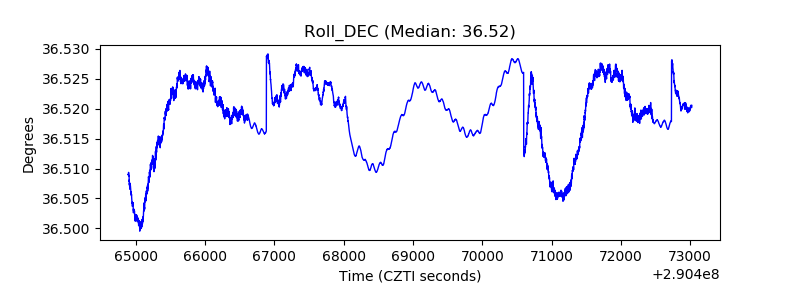 |
| _Roll_RA | 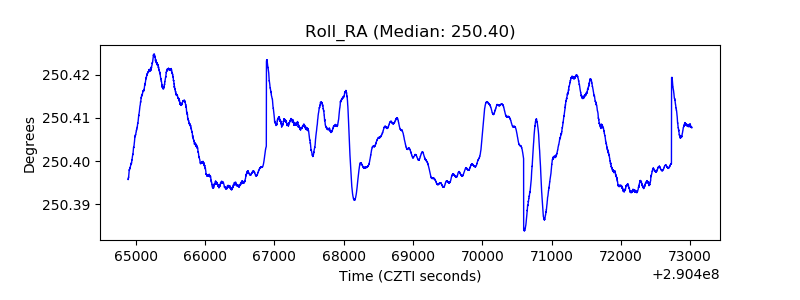 |
| Veto Counter | 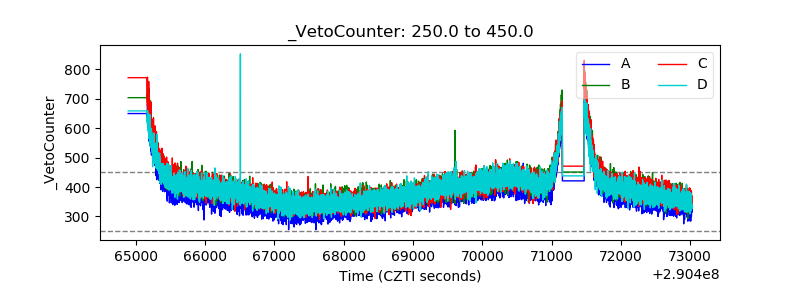 |