| Param | Original file | Final file |
|---|---|---|
| Filename | modeM0/AS1A05_072T04_9000002802_18738cztM0_level2.evt | modeM0/AS1A05_072T04_9000002802_18738cztM0_level2_quad_clean.evt |
| Size (bytes) | 1,315,523,520 | 241,908,480 |
| Size | 1.2 GB | 230.7 MB |
| Events in quadrant A | 8,667,875 | 1,519,916 |
| Events in quadrant B | 11,791,104 | 1,529,598 |
| Events in quadrant C | 8,833,552 | 1,512,931 |
| Events in quadrant D | 9,288,530 | 1,480,621 |
| Mode SS | |||
|---|---|---|---|
| Quadrant | BADHDUFLAG | Total packets | Discarded packets |
| A | 0 | 380 | 0 |
| B | 0 | 380 | 0 |
| C | 0 | 380 | 0 |
| D | 0 | 380 | 0 |
| Mode M9 | |||
|---|---|---|---|
| Quadrant | BADHDUFLAG | Total packets | Discarded packets |
| A | 0 | 18 | 0 |
| B | 0 | 18 | 0 |
| C | 0 | 18 | 0 |
| D | 0 | 18 | 0 |
| Mode M0 | |||
|---|---|---|---|
| Quadrant | BADHDUFLAG | Total packets | Discarded packets |
| A | 0 | 38414 | 6 |
| B | 0 | 47701 | 5 |
| C | 0 | 38582 | 5 |
| D | 0 | 41269 | 5 |
| Quadrant | Total seconds | Saturated seconds | Saturation percentage |
|---|---|---|---|
| A | 18623 | 138 | 0.741019% |
| B | 18624 | 882 | 4.735825% |
| C | 18624 | 247 | 1.326246% |
| D | 18624 | 490 | 2.631014% |
Noise dominated data is calculated using 1-second bins in cleaned event files. If a bin has >2000 counts, and if more than 50% of those come from <1% of pixels, then it is considered to be noise-dominated and hence unusable.
| Quadrant | # 1 sec bins | Bins with >0 counts | Bins with >2000 counts | High rate bins dominated by noise | Noise dominated (total time) | Noise dominated (detector-on time) | Marked lightcurve |
|---|---|---|---|---|---|---|---|
| A | 20423 | 18627 | 1 | 1 | 0.00% | 0.01% | 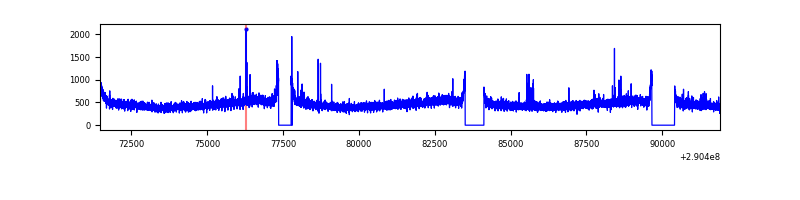 |
| B | 20424 | 18628 | 473 | 473 | 2.32% | 2.54% | 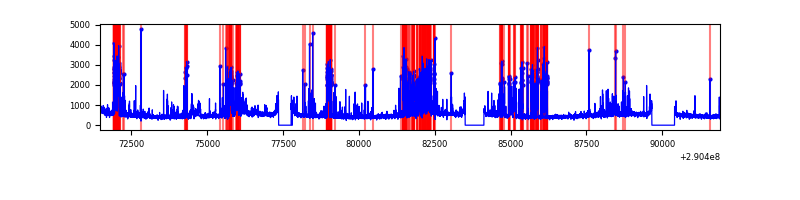 |
| C | 20424 | 18628 | 0 | 0 | 0.00% | 0.00% | 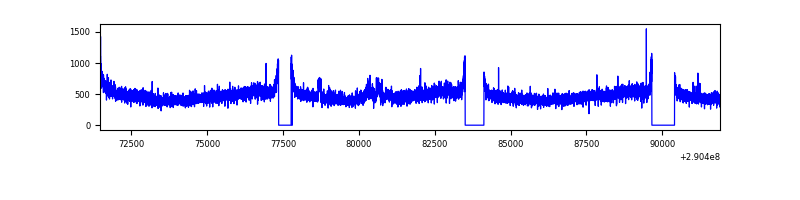 |
| D | 20424 | 18628 | 301 | 301 | 1.47% | 1.62% | 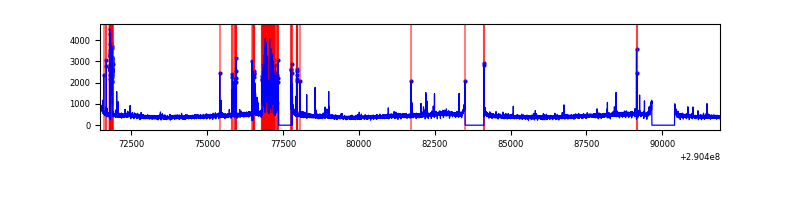 |
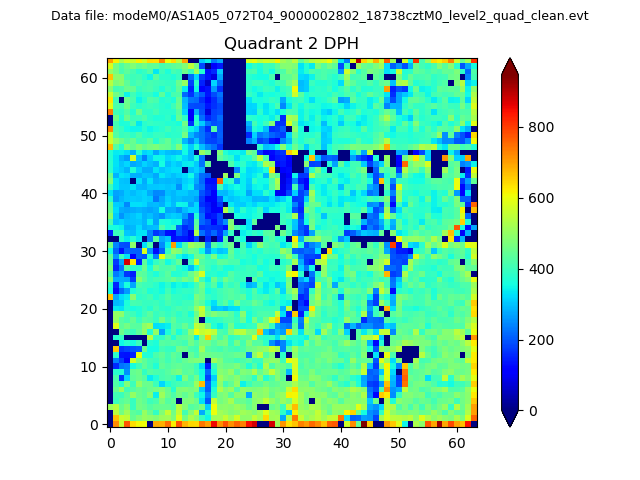
Top three noisy pixels from each quadrant. If the there are fewer than three noisy pixels in the level2.evt file, extra rows are filled as -1
| Pixel properties | Quadrant properties | ||||||
|---|---|---|---|---|---|---|---|
| Quadrant | DetID | PixID | Counts | Sigma | Mean | Median | Sigma |
| A | 15 | 192 | 71534 | 156.73 | 2213 | 2169 | 442.6 |
| A | 11 | 29 | 30252 | 63.45 | 2213 | 2169 | 442.6 |
| A | 13 | 254 | 28743 | 60.04 | 2213 | 2169 | 442.6 |
| B | 10 | 245 | 2784295 | 6672.63 | 2192 | 2130 | 417.0 |
| B | 4 | 216 | 138163 | 326.26 | 2192 | 2130 | 417.0 |
| B | 0 | 197 | 94459 | 221.44 | 2192 | 2130 | 417.0 |
| C | 14 | 238 | 327171 | 651.68 | 2132 | 2146 | 498.7 |
| C | 3 | 233 | 165113 | 326.75 | 2132 | 2146 | 498.7 |
| C | 13 | 61 | 15059 | 25.89 | 2132 | 2146 | 498.7 |
| D | 14 | 34 | 981862 | 1899.2 | 2132 | 2074 | 515.9 |
| D | 2 | 234 | 77975 | 147.12 | 2132 | 2074 | 515.9 |
| D | 7 | 238 | 75699 | 142.71 | 2132 | 2074 | 515.9 |
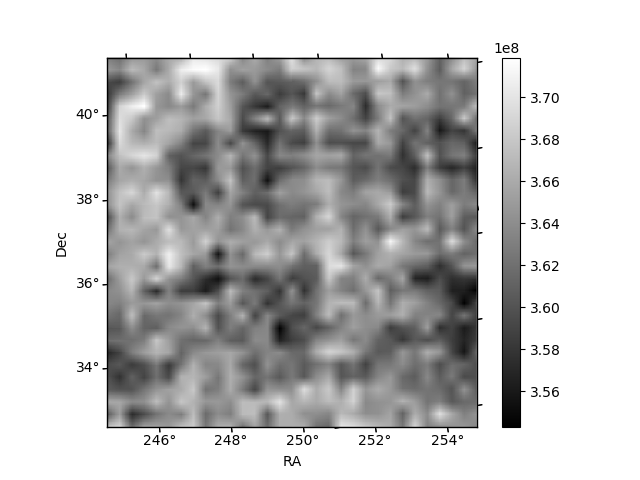
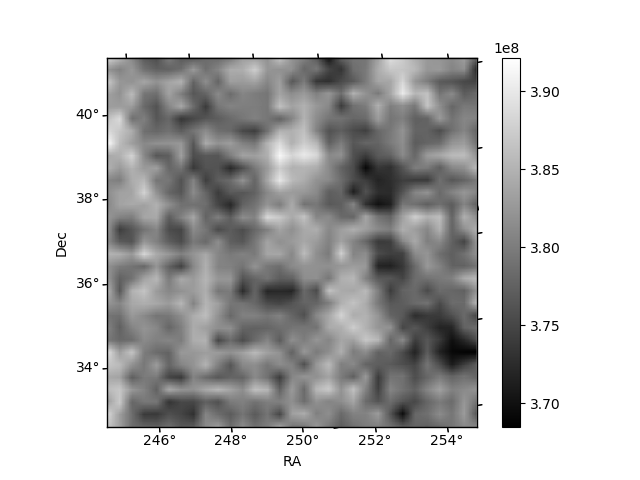
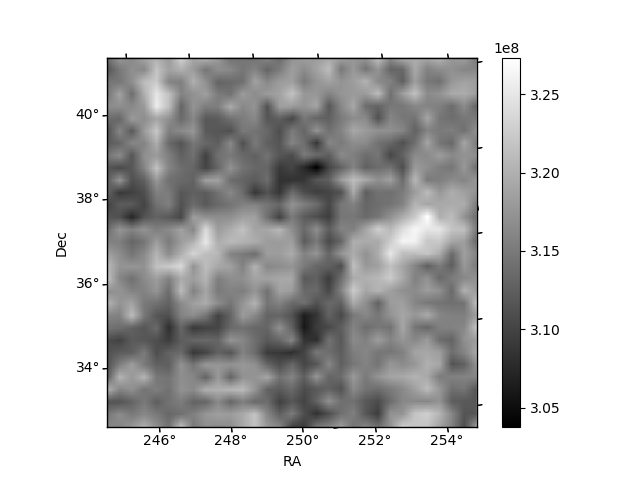
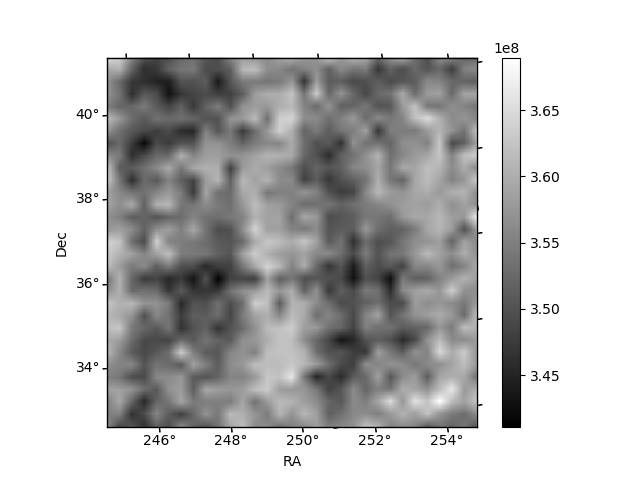
Histogram calculated using DETX and DETY for each event in the final _common_clean file
| Quadrant A | 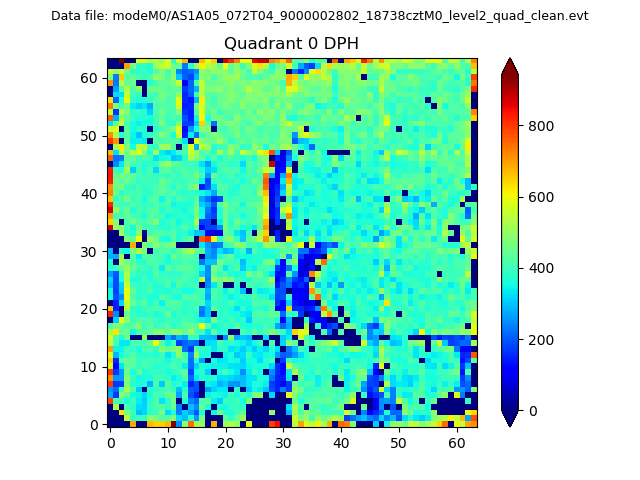 |
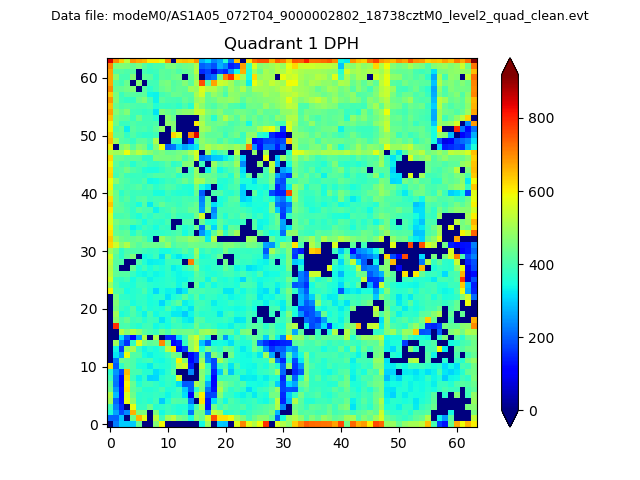 |
Quadrant B |
|---|---|---|---|
| Quadrant D | 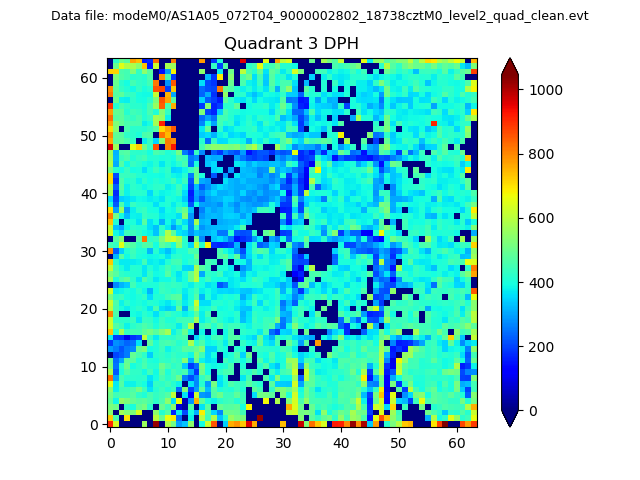 |
 |
Quadrant C |
| Plot type | Count rate plots | Images |
|---|---|---|
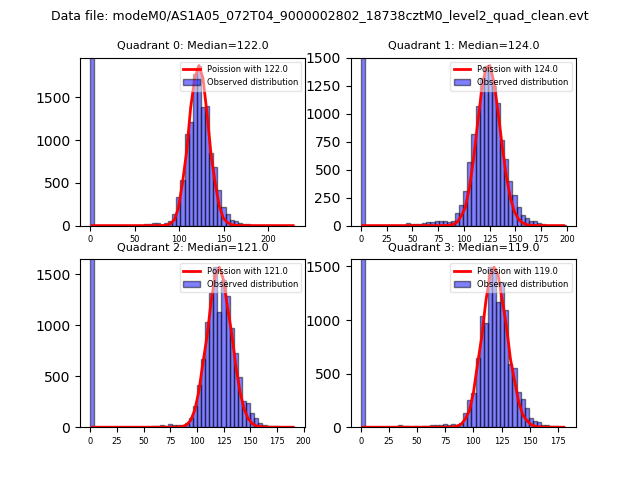
| Comparison with Poisson distribution Blue bars denote a histogram of data divided into 1 sec bins. Red curve is a Poisson curve with rate = median count rate of data. |
 |
 |
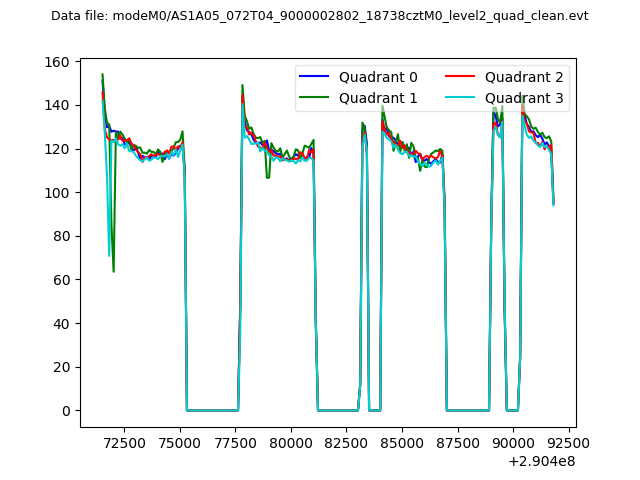
| Quadrant-wise count rates Data is divided into 100 sec bins |
 |
|
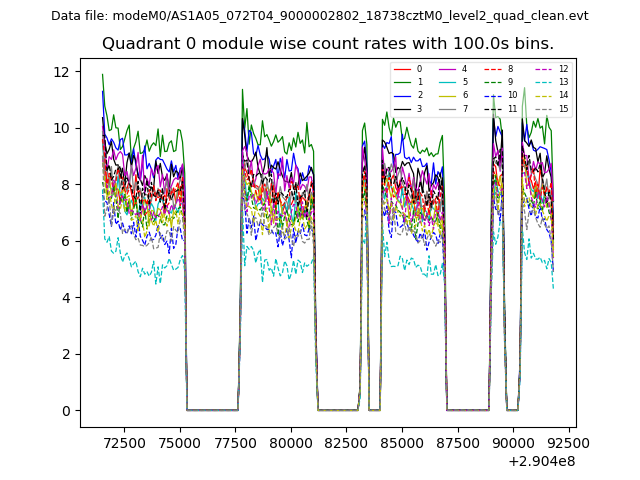
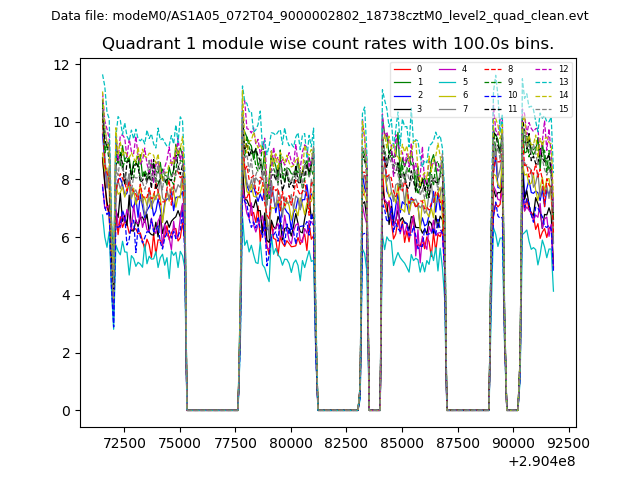
| Module-wise count rates for Quadrant A Data is divided into 100 sec bins |
 |
 |
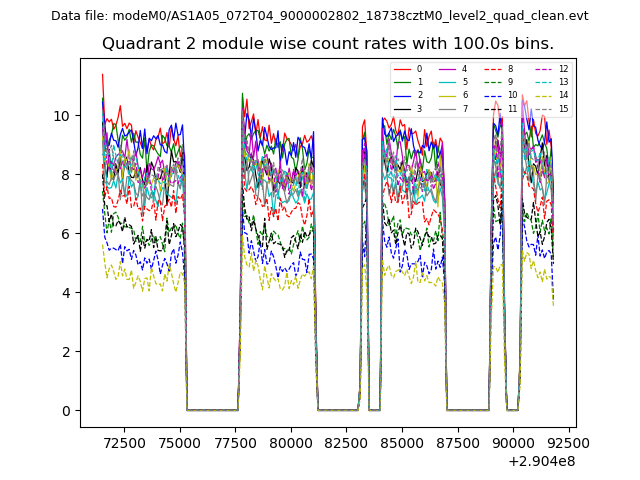
| Module-wise count rates for Quadrant B Data is divided into 100 sec bins |
 |
 |
| Module-wise count rates for Quadrant C Data is divided into 100 sec bins |
 |
 |
| Module-wise count rates for Quadrant D Data is divided into 100 sec bins |
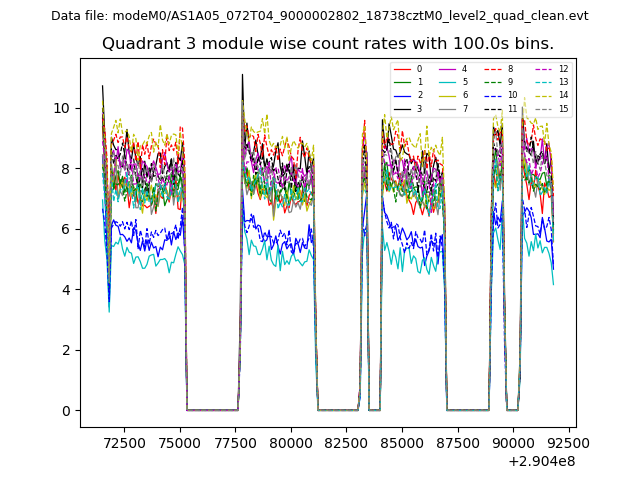 |
 |
| Parameter | Plot |
|---|---|
| CZT HV Monitor | 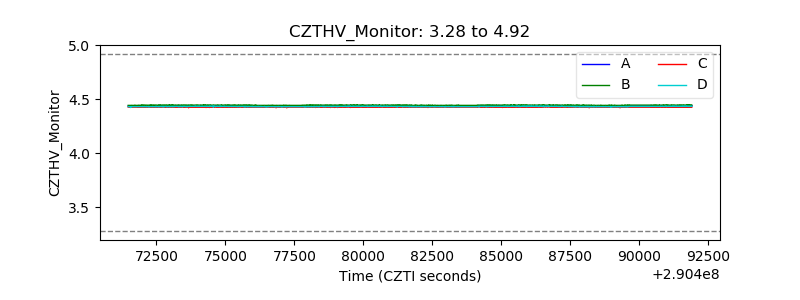 |
| D_VDD | 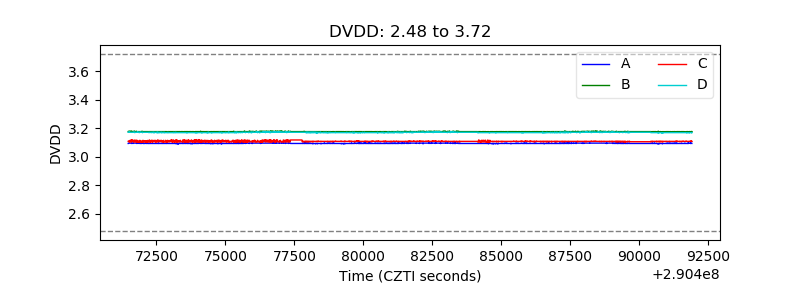 |
| Temperature 1 | 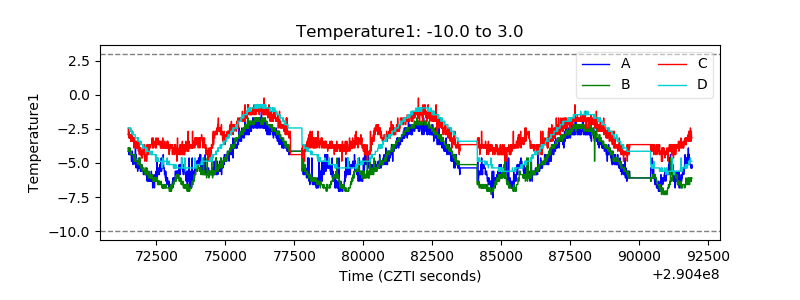 |
| Veto HV Monitor | 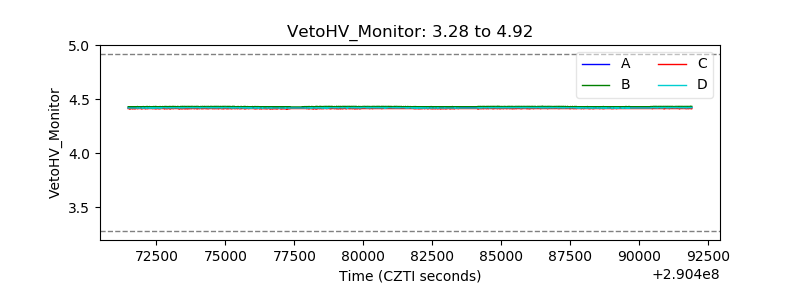 |
| Veto LLD | 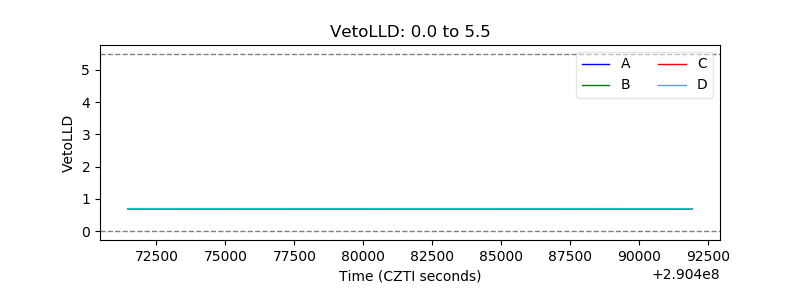 |
| Alpha Counter | 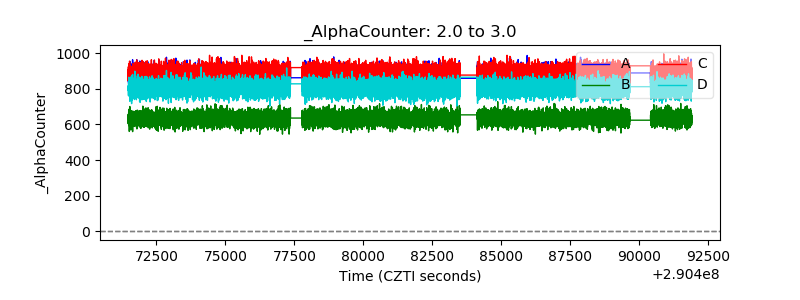 |
| _CPM_Rate | 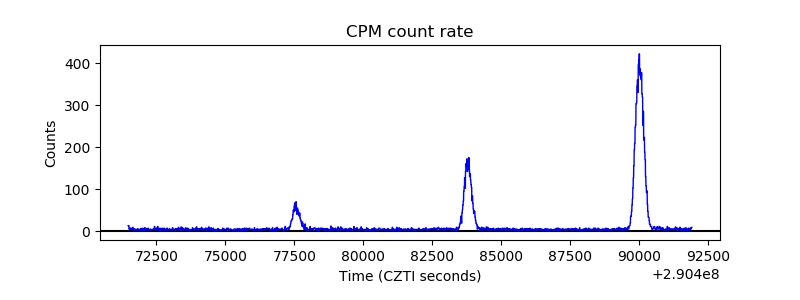 |
| CZT Counter | 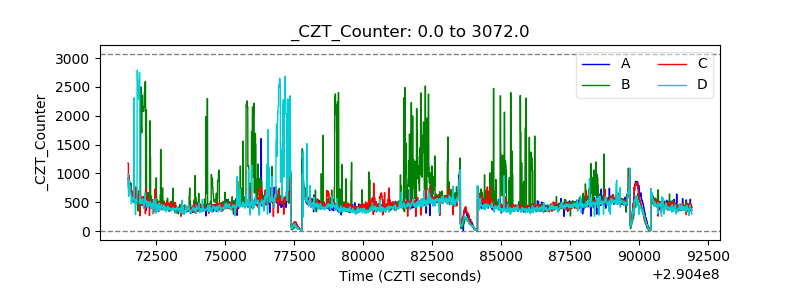 |
| +2.5 Volts monitor | 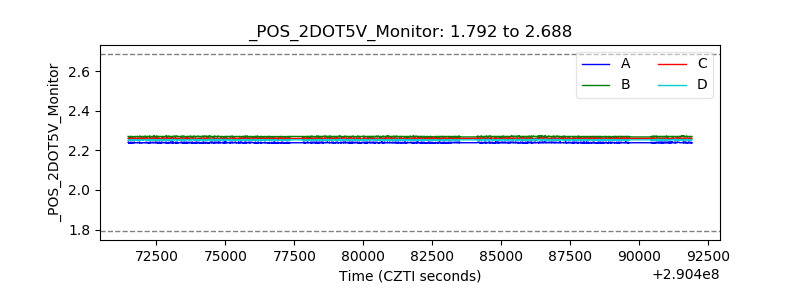 |
| +5 Volts monitor |  |
| _ROLL_ROT | 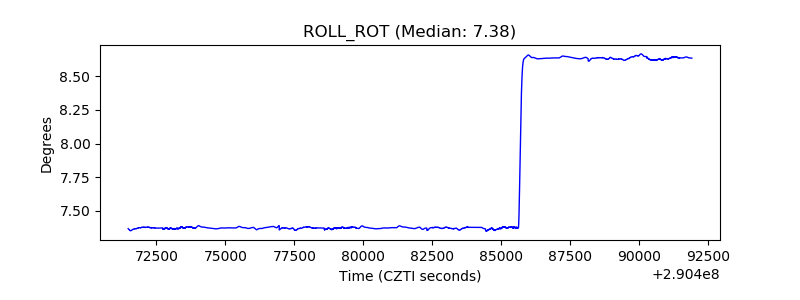 |
| _Roll_DEC | 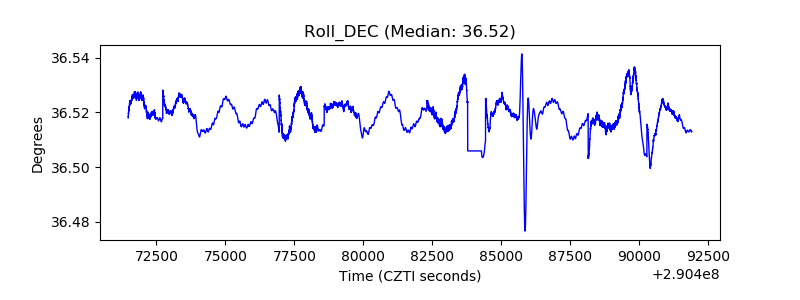 |
| _Roll_RA | 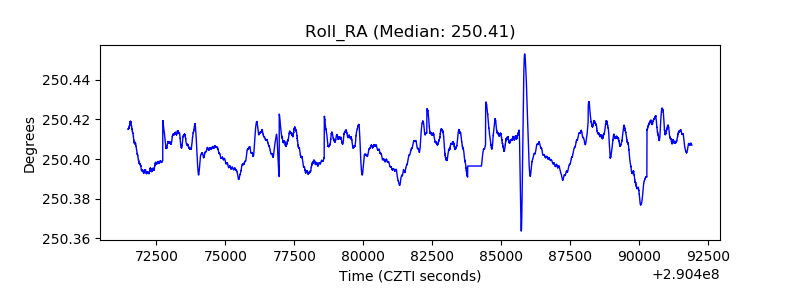 |
| Veto Counter | 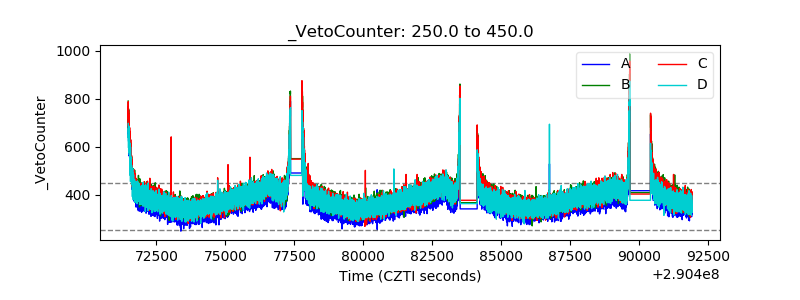 |