| Param | Original file | Final file |
|---|---|---|
| Filename | modeM0/AS1A05_072T04_9000002802_18741cztM0_level2.evt | modeM0/AS1A05_072T04_9000002802_18741cztM0_level2_quad_clean.evt |
| Size (bytes) | 737,470,080 | 144,843,840 |
| Size | 703.3 MB | 138.1 MB |
| Events in quadrant A | 5,786,308 | 912,318 |
| Events in quadrant B | 5,572,646 | 929,698 |
| Events in quadrant C | 5,221,813 | 897,372 |
| Events in quadrant D | 5,009,066 | 887,047 |
| Mode SS | |||
|---|---|---|---|
| Quadrant | BADHDUFLAG | Total packets | Discarded packets |
| A | 0 | 224 | 0 |
| B | 0 | 224 | 0 |
| C | 0 | 224 | 0 |
| D | 0 | 224 | 0 |
| Mode M9 | |||
|---|---|---|---|
| Quadrant | BADHDUFLAG | Total packets | Discarded packets |
| A | 0 | 19 | 0 |
| B | 0 | 19 | 0 |
| C | 0 | 19 | 0 |
| D | 0 | 19 | 0 |
| Mode M0 | |||
|---|---|---|---|
| Quadrant | BADHDUFLAG | Total packets | Discarded packets |
| A | 0 | 24442 | 2 |
| B | 0 | 23399 | 2 |
| C | 0 | 22640 | 2 |
| D | 0 | 22500 | 2 |
| Quadrant | Total seconds | Saturated seconds | Saturation percentage |
|---|---|---|---|
| A | 10984 | 77 | 0.701020% |
| B | 10985 | 132 | 1.201639% |
| C | 10985 | 112 | 1.019572% |
| D | 10985 | 54 | 0.491579% |
Noise dominated data is calculated using 1-second bins in cleaned event files. If a bin has >2000 counts, and if more than 50% of those come from <1% of pixels, then it is considered to be noise-dominated and hence unusable.
| Quadrant | # 1 sec bins | Bins with >0 counts | Bins with >2000 counts | High rate bins dominated by noise | Noise dominated (total time) | Noise dominated (detector-on time) | Marked lightcurve |
|---|---|---|---|---|---|---|---|
| A | 12924 | 10986 | 0 | 0 | 0.00% | 0.00% | 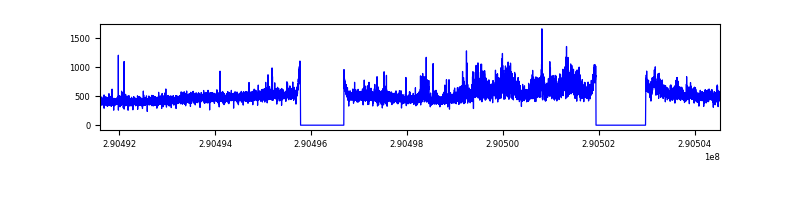 |
| B | 12925 | 10987 | 18 | 18 | 0.14% | 0.16% | 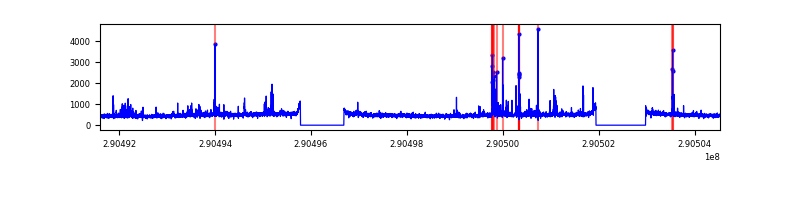 |
| C | 12925 | 10987 | 6 | 6 | 0.05% | 0.05% | 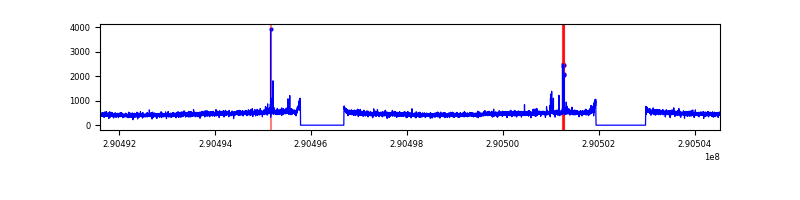 |
| D | 12925 | 10987 | 2 | 2 | 0.02% | 0.02% | 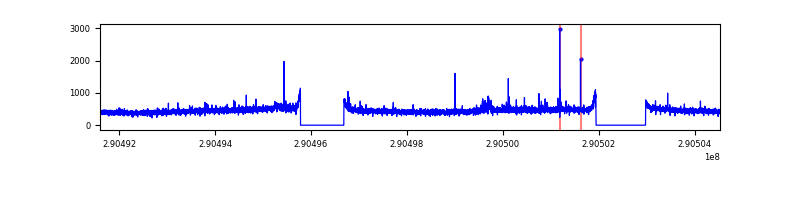 |
Top three noisy pixels from each quadrant. If the there are fewer than three noisy pixels in the level2.evt file, extra rows are filled as -1
| Pixel properties | Quadrant properties | ||||||
|---|---|---|---|---|---|---|---|
| Quadrant | DetID | PixID | Counts | Sigma | Mean | Median | Sigma |
| A | 15 | 192 | 616528 | 2294.91 | 1331 | 1302 | 268.1 |
| A | 11 | 29 | 23044 | 81.1 | 1331 | 1302 | 268.1 |
| A | 14 | 111 | 17988 | 62.24 | 1331 | 1302 | 268.1 |
| B | 10 | 245 | 132428 | 524.89 | 1320 | 1288 | 249.8 |
| B | 4 | 216 | 70657 | 277.65 | 1320 | 1288 | 249.8 |
| B | 0 | 197 | 52031 | 203.1 | 1320 | 1288 | 249.8 |
| C | 14 | 238 | 197585 | 666.08 | 1268 | 1275 | 294.7 |
| C | 3 | 233 | 54547 | 180.75 | 1268 | 1275 | 294.7 |
| C | 5 | 112 | 24522 | 78.88 | 1268 | 1275 | 294.7 |
| D | 13 | 168 | 87481 | 274.4 | 1294 | 1257 | 314.2 |
| D | 2 | 234 | 47586 | 147.44 | 1294 | 1257 | 314.2 |
| D | 7 | 96 | 12816 | 36.79 | 1294 | 1257 | 314.2 |
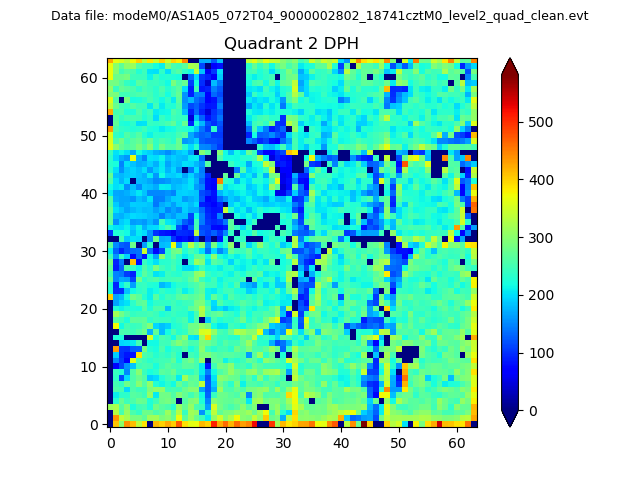
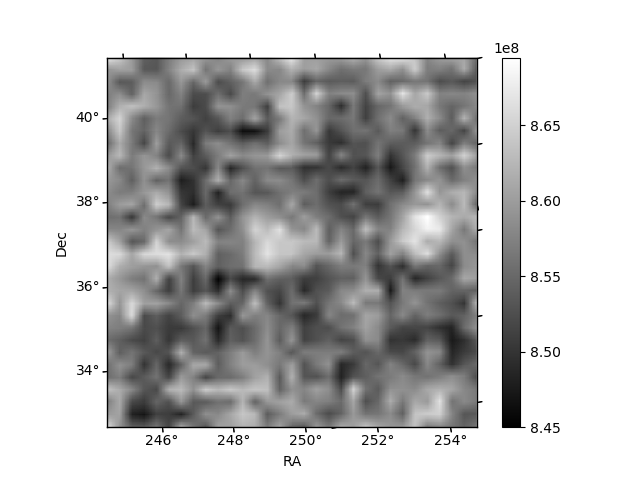
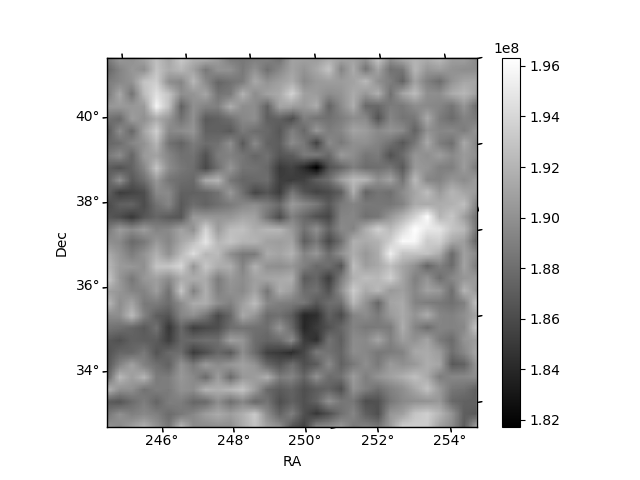
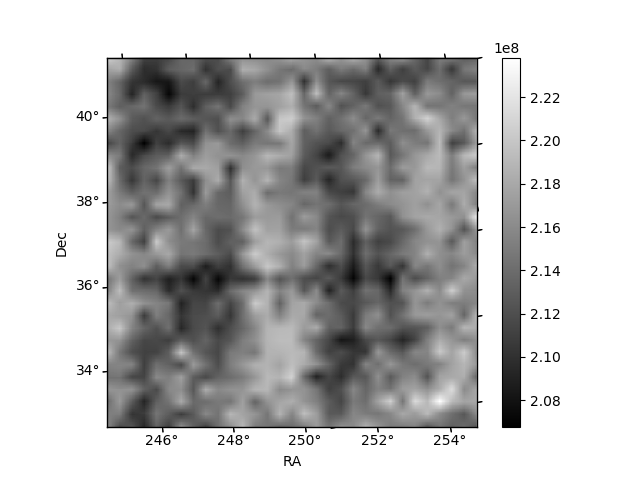
Histogram calculated using DETX and DETY for each event in the final _common_clean file
| Quadrant A | 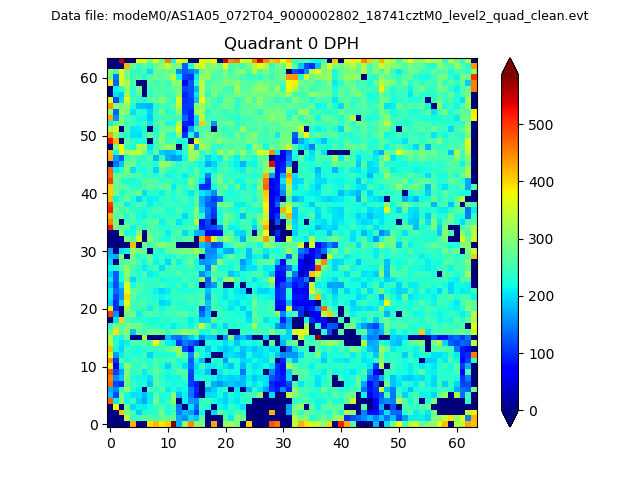 |
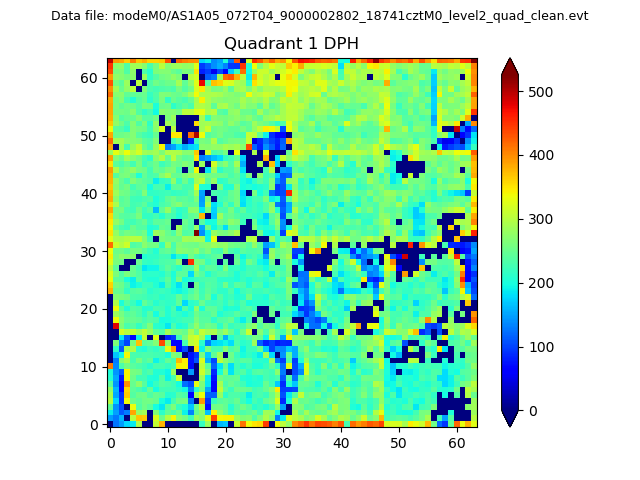 |
Quadrant B |
|---|---|---|---|
| Quadrant D | 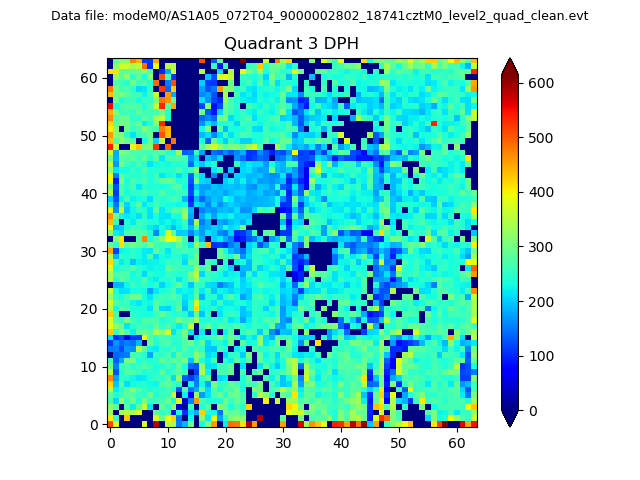 |
 |
Quadrant C |
| Plot type | Count rate plots | Images |
|---|---|---|
| Comparison with Poisson distribution Blue bars denote a histogram of data divided into 1 sec bins. Red curve is a Poisson curve with rate = median count rate of data. |
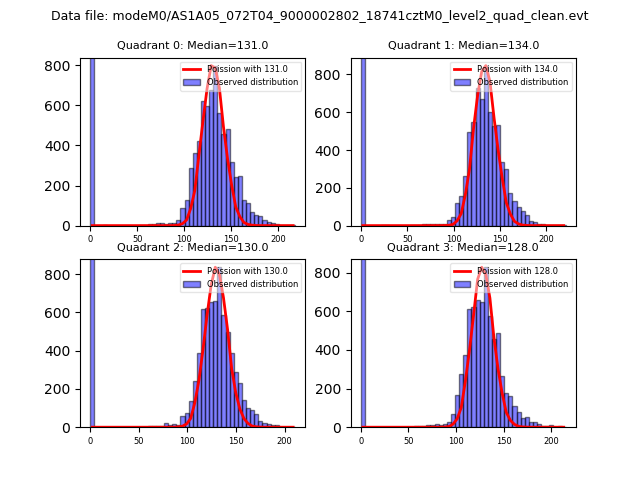 |
 |
| Quadrant-wise count rates Data is divided into 100 sec bins |
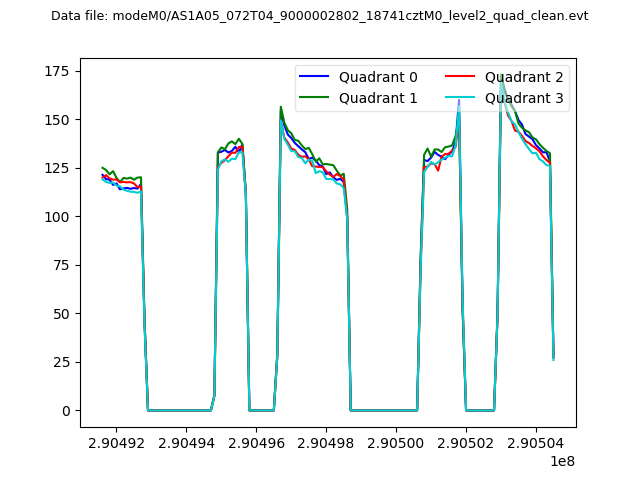 |
|
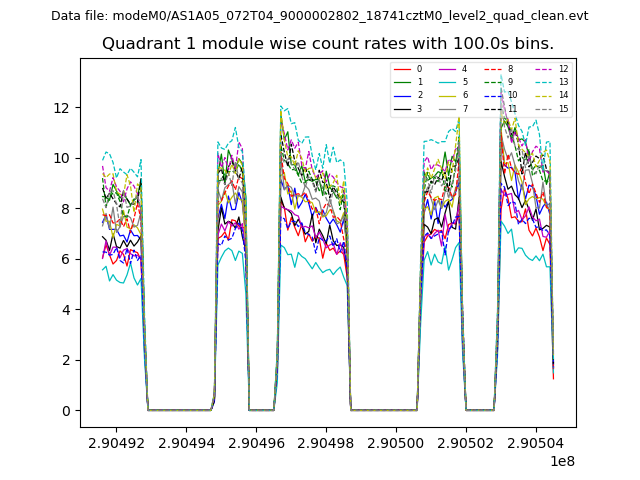
| Module-wise count rates for Quadrant A Data is divided into 100 sec bins |
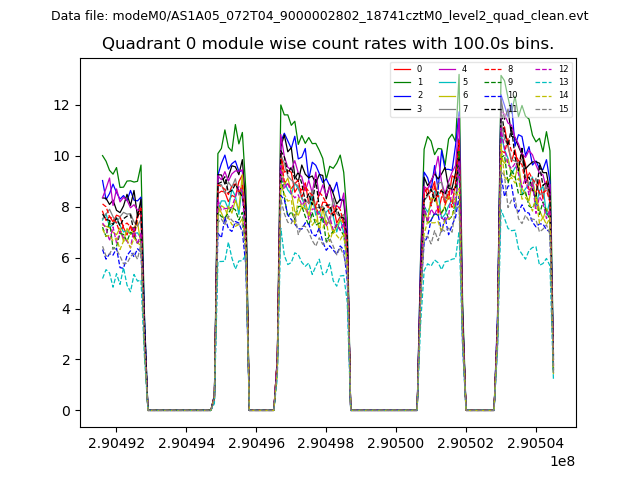 |
 |
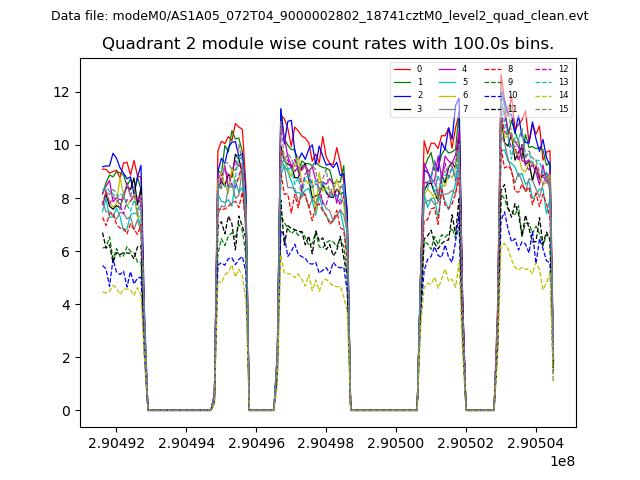
| Module-wise count rates for Quadrant B Data is divided into 100 sec bins |
 |
 |
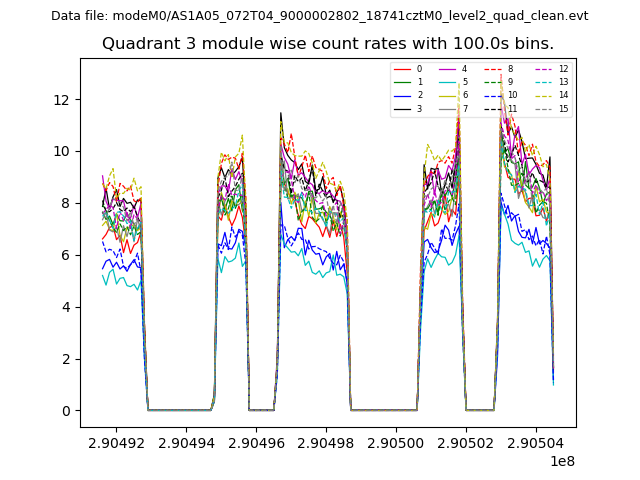
| Module-wise count rates for Quadrant C Data is divided into 100 sec bins |
 |
 |
| Module-wise count rates for Quadrant D Data is divided into 100 sec bins |
 |
 |
| Parameter | Plot |
|---|---|
| CZT HV Monitor | 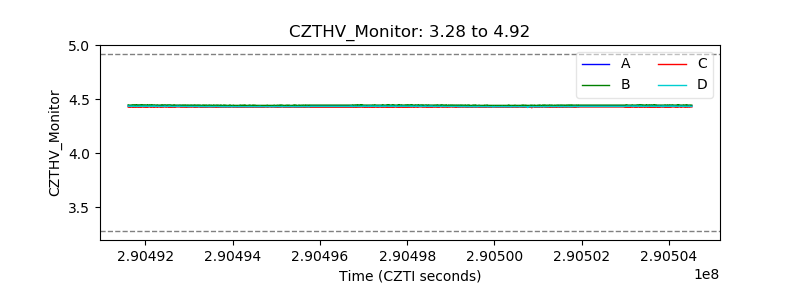 |
| D_VDD | 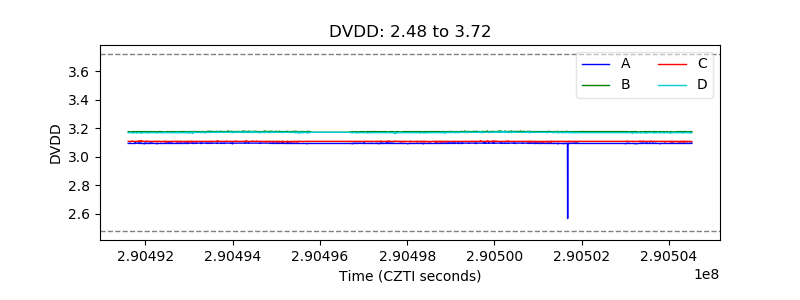 |
| Temperature 1 | 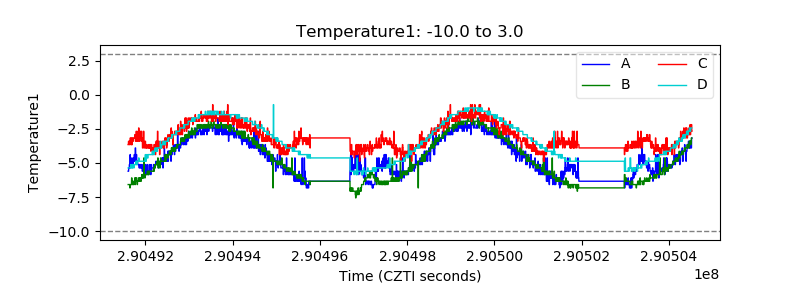 |
| Veto HV Monitor | 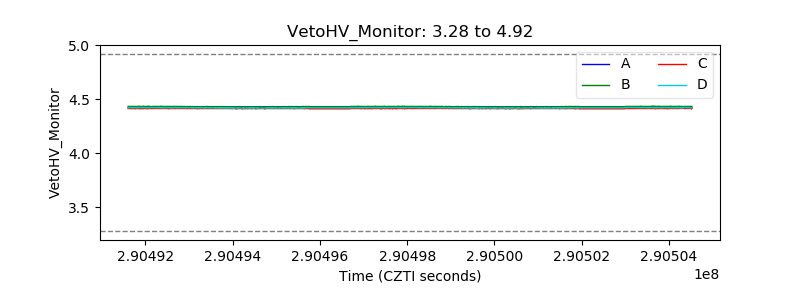 |
| Veto LLD | 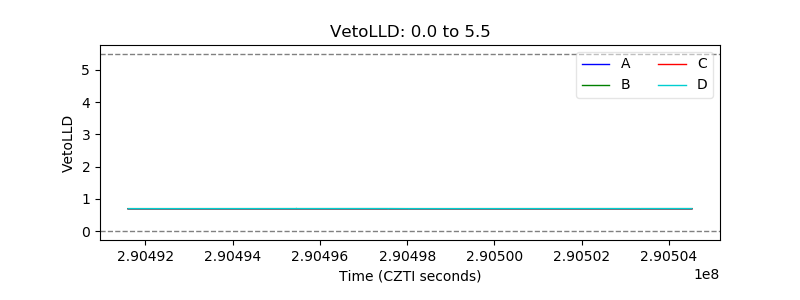 |
| Alpha Counter | 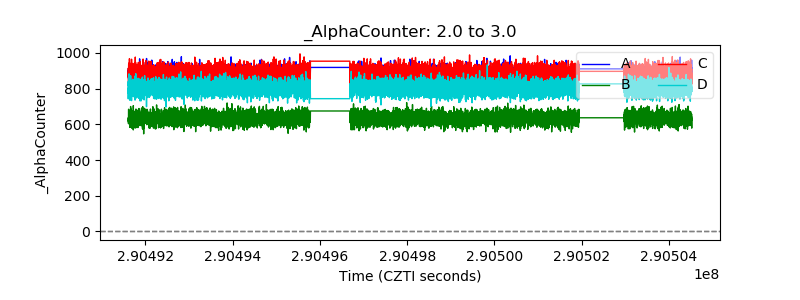 |
| _CPM_Rate | 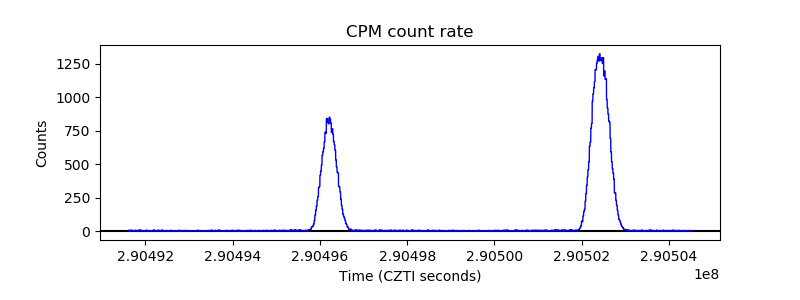 |
| CZT Counter | 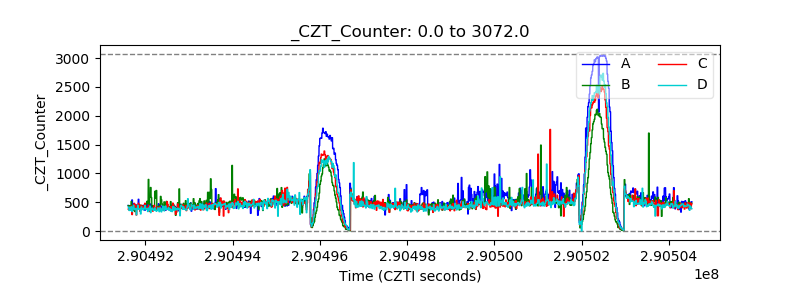 |
| +2.5 Volts monitor |  |
| +5 Volts monitor |  |
| _ROLL_ROT | 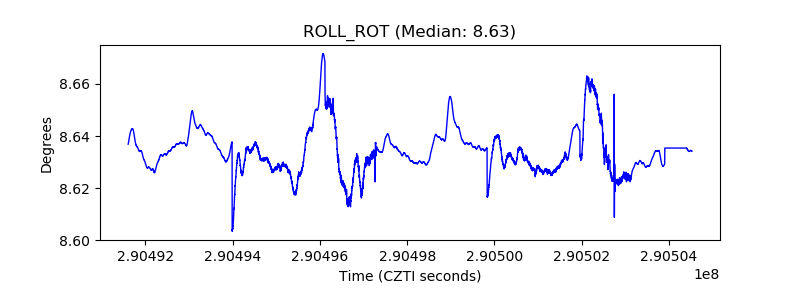 |
| _Roll_DEC | 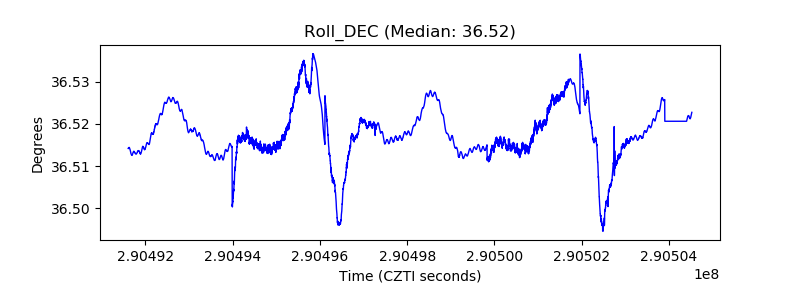 |
| _Roll_RA | 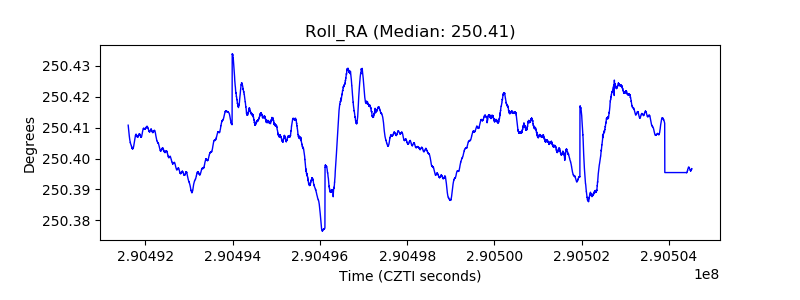 |
| Veto Counter | 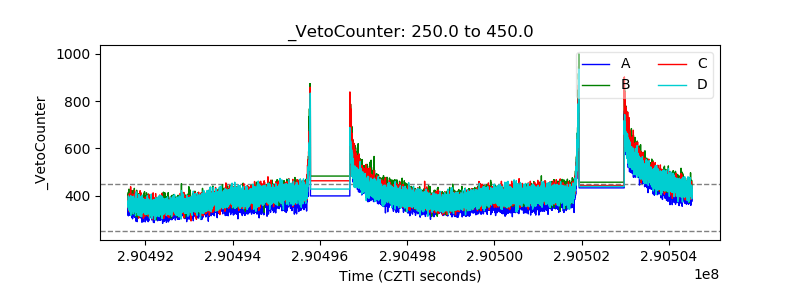 |