| Param | Original file | Final file |
|---|---|---|
| Filename | modeM0/AS1A05_072T04_9000002802_18742cztM0_level2.evt | modeM0/AS1A05_072T04_9000002802_18742cztM0_level2_quad_clean.evt |
| Size (bytes) | 441,864,000 | 92,799,360 |
| Size | 421.4 MB | 88.5 MB |
| Events in quadrant A | 3,421,037 | 598,446 |
| Events in quadrant B | 3,332,570 | 606,486 |
| Events in quadrant C | 3,121,208 | 583,343 |
| Events in quadrant D | 3,073,493 | 576,861 |
| Mode SS | |||
|---|---|---|---|
| Quadrant | BADHDUFLAG | Total packets | Discarded packets |
| A | 0 | 130 | 0 |
| B | 0 | 130 | 0 |
| C | 0 | 130 | 0 |
| D | 0 | 130 | 0 |
| Mode M9 | |||
|---|---|---|---|
| Quadrant | BADHDUFLAG | Total packets | Discarded packets |
| A | 0 | 12 | 0 |
| B | 0 | 12 | 0 |
| C | 0 | 12 | 0 |
| D | 0 | 12 | 0 |
| Mode M0 | |||
|---|---|---|---|
| Quadrant | BADHDUFLAG | Total packets | Discarded packets |
| A | 0 | 13935 | 1 |
| B | 0 | 13687 | 1 |
| C | 0 | 13077 | 1 |
| D | 0 | 13193 | 1 |
| Quadrant | Total seconds | Saturated seconds | Saturation percentage |
|---|---|---|---|
| A | 6379 | 30 | 0.470293% |
| B | 6379 | 49 | 0.768145% |
| C | 6379 | 33 | 0.517322% |
| D | 6380 | 36 | 0.564263% |
Noise dominated data is calculated using 1-second bins in cleaned event files. If a bin has >2000 counts, and if more than 50% of those come from <1% of pixels, then it is considered to be noise-dominated and hence unusable.
| Quadrant | # 1 sec bins | Bins with >0 counts | Bins with >2000 counts | High rate bins dominated by noise | Noise dominated (total time) | Noise dominated (detector-on time) | Marked lightcurve |
|---|---|---|---|---|---|---|---|
| A | 7554 | 6380 | 1 | 1 | 0.01% | 0.02% | 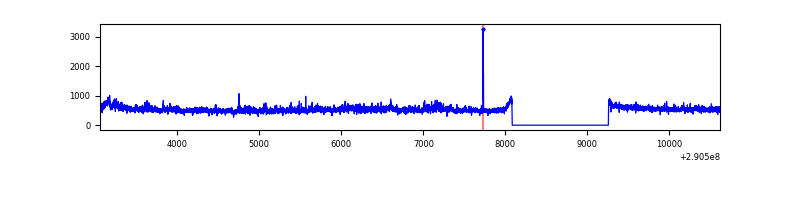 |
| B | 7554 | 6380 | 10 | 10 | 0.13% | 0.16% | 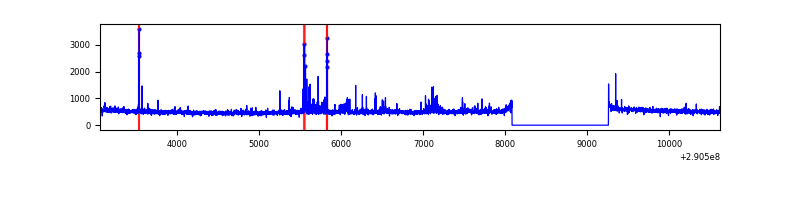 |
| C | 7554 | 6380 | 0 | 0 | 0.00% | 0.00% | 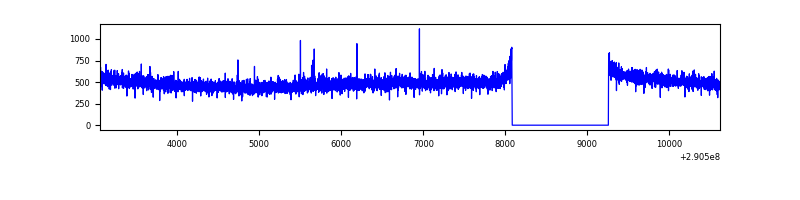 |
| D | 7555 | 6381 | 11 | 11 | 0.15% | 0.17% | 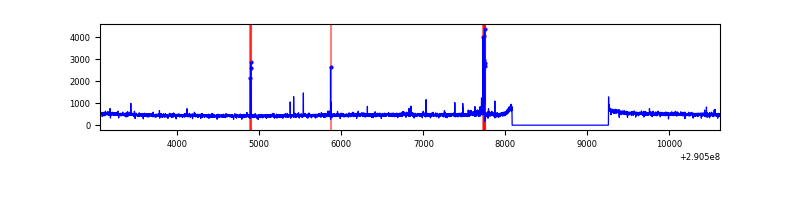 |
Top three noisy pixels from each quadrant. If the there are fewer than three noisy pixels in the level2.evt file, extra rows are filled as -1
| Pixel properties | Quadrant properties | ||||||
|---|---|---|---|---|---|---|---|
| Quadrant | DetID | PixID | Counts | Sigma | Mean | Median | Sigma |
| A | 15 | 192 | 250692 | 1521.8 | 813 | 799 | 164.2 |
| A | 14 | 111 | 19253 | 112.38 | 813 | 799 | 164.2 |
| A | 13 | 254 | 10578 | 59.55 | 813 | 799 | 164.2 |
| B | 7 | 220 | 77953 | 505.86 | 802 | 782 | 152.6 |
| B | 0 | 197 | 34512 | 221.1 | 802 | 782 | 152.6 |
| B | 10 | 245 | 27172 | 172.99 | 802 | 782 | 152.6 |
| C | 14 | 238 | 121981 | 680.7 | 767 | 771 | 178.1 |
| C | 3 | 233 | 7528 | 37.94 | 767 | 771 | 178.1 |
| C | 13 | 61 | 5312 | 25.5 | 767 | 771 | 178.1 |
| D | 13 | 168 | 41796 | 214.6 | 785 | 763 | 191.2 |
| D | 7 | 96 | 41643 | 213.8 | 785 | 763 | 191.2 |
| D | 2 | 234 | 24894 | 126.21 | 785 | 763 | 191.2 |
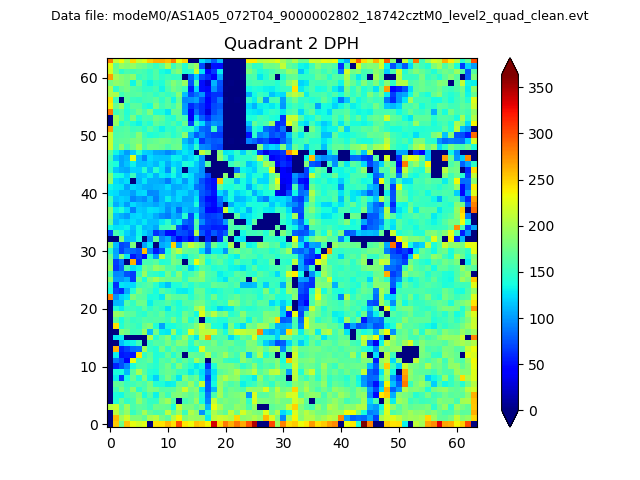
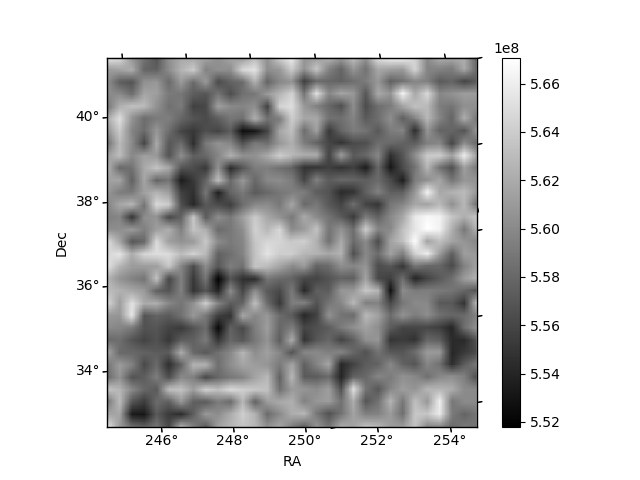
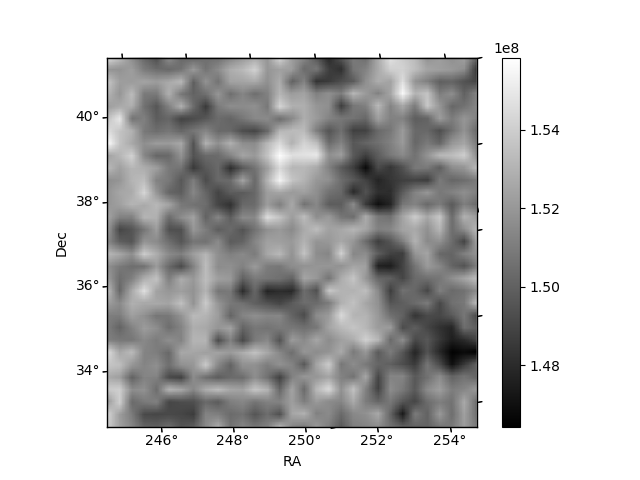
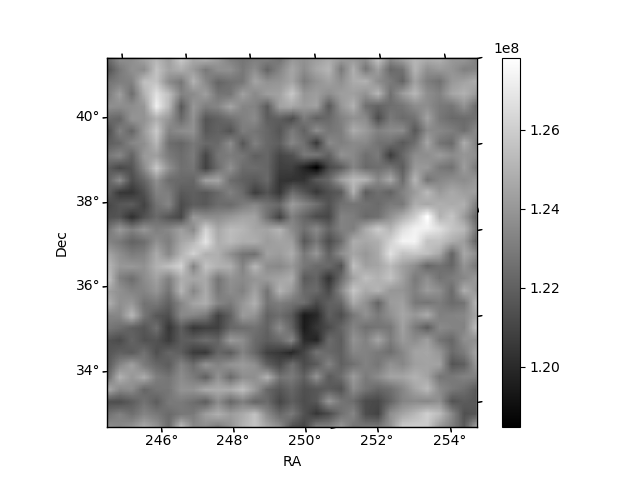
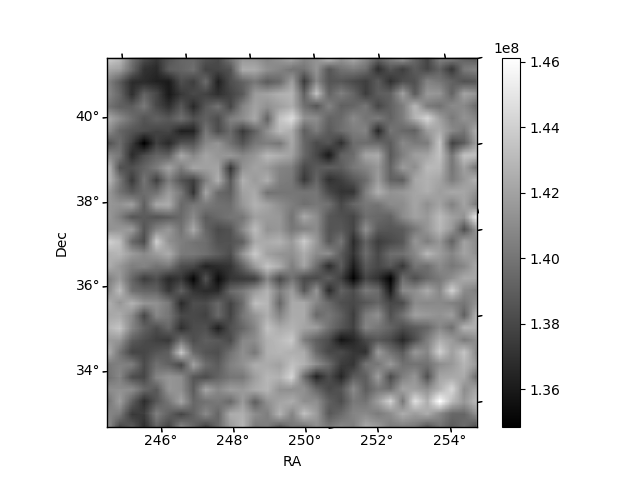
Histogram calculated using DETX and DETY for each event in the final _common_clean file
| Quadrant A | 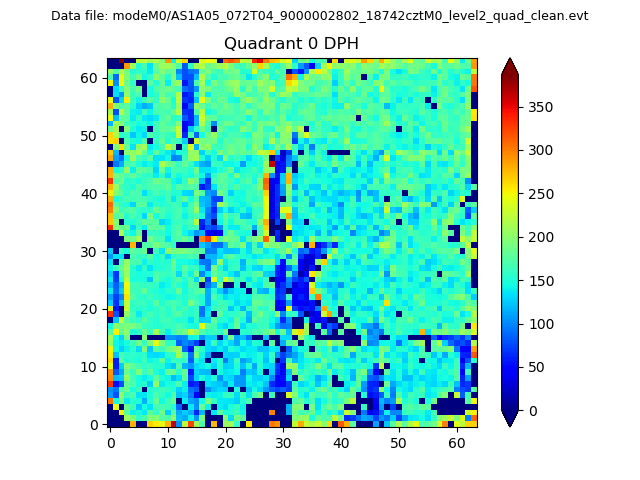 |
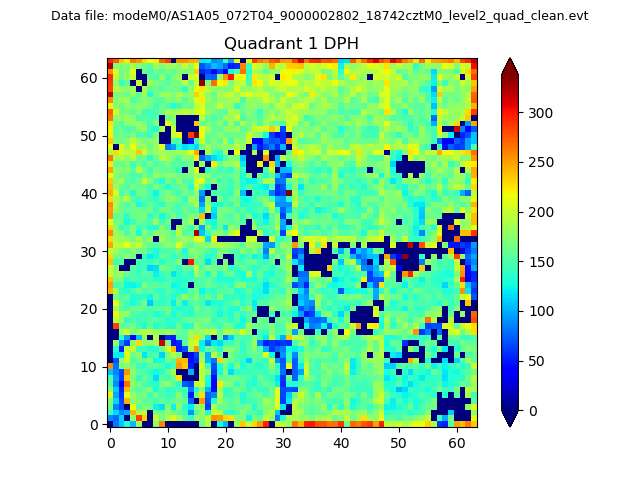 |
Quadrant B |
|---|---|---|---|
| Quadrant D | 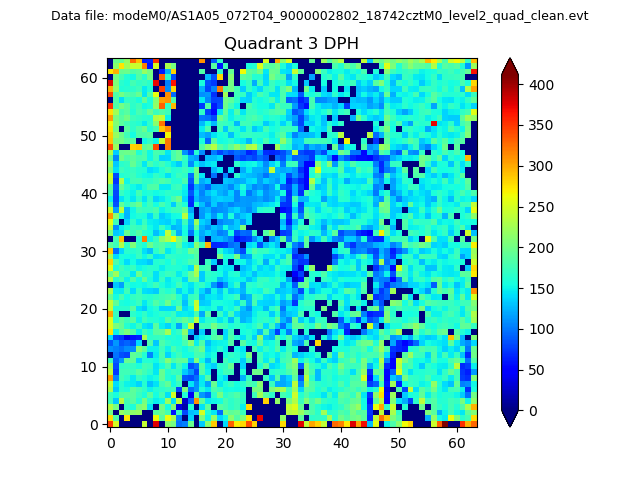 |
 |
Quadrant C |
| Plot type | Count rate plots | Images |
|---|---|---|
| Comparison with Poisson distribution Blue bars denote a histogram of data divided into 1 sec bins. Red curve is a Poisson curve with rate = median count rate of data. |
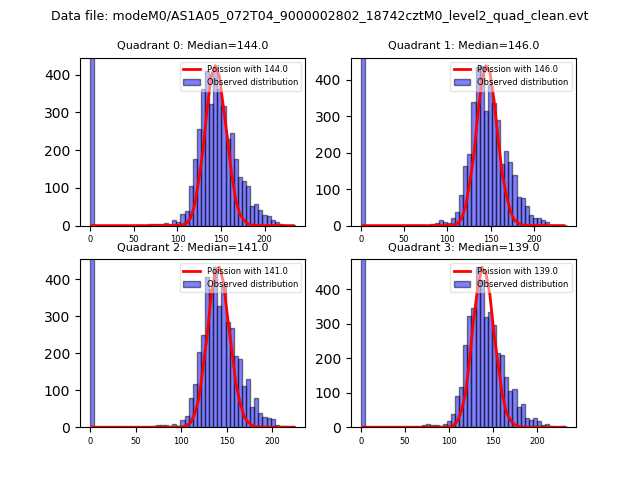 |
 |
| Quadrant-wise count rates Data is divided into 100 sec bins |
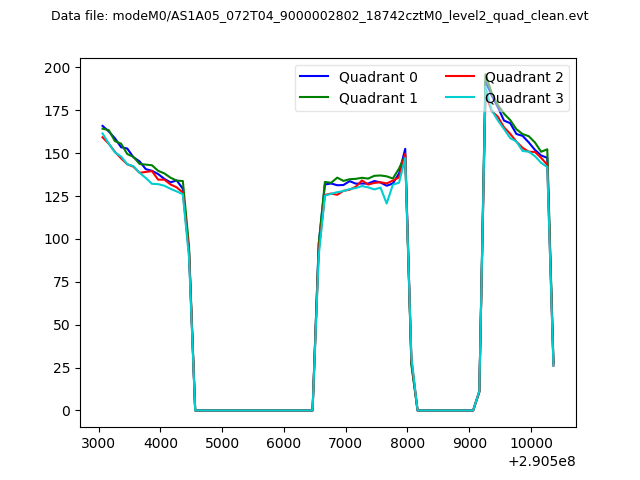 |
|
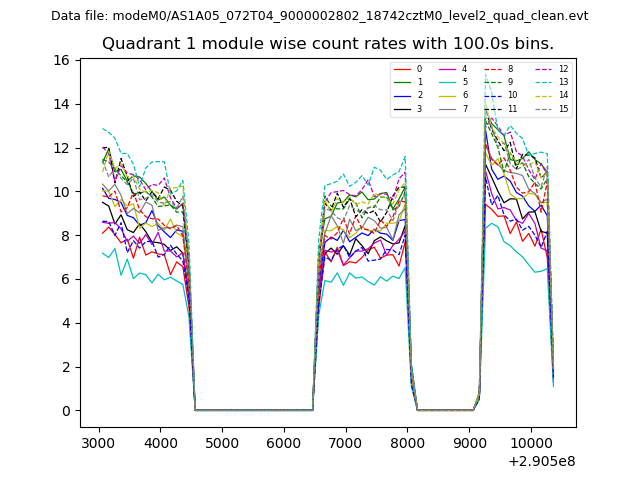
| Module-wise count rates for Quadrant A Data is divided into 100 sec bins |
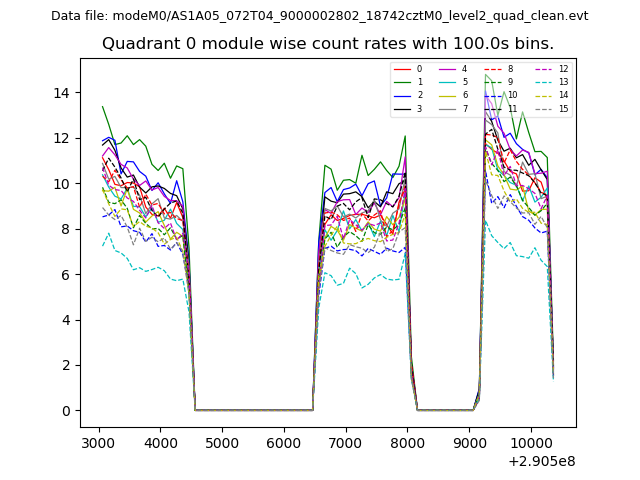 |
 |
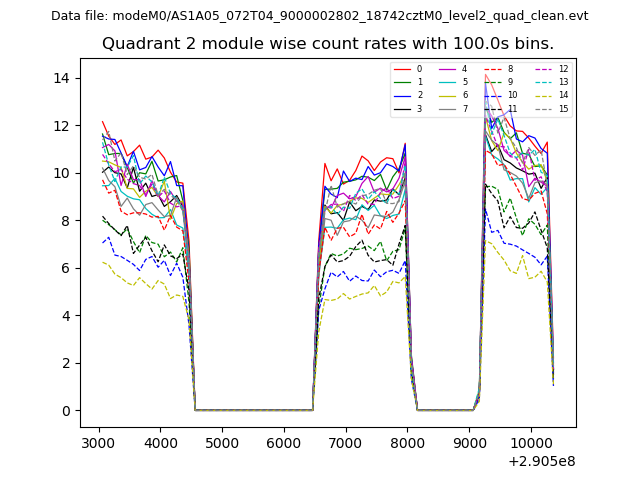
| Module-wise count rates for Quadrant B Data is divided into 100 sec bins |
 |
 |
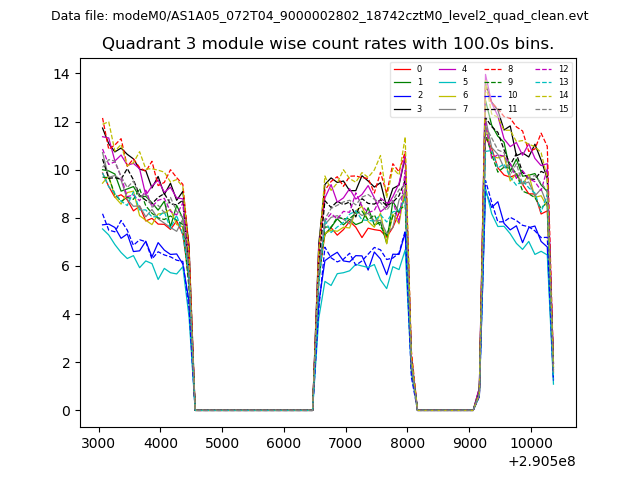
| Module-wise count rates for Quadrant C Data is divided into 100 sec bins |
 |
 |
| Module-wise count rates for Quadrant D Data is divided into 100 sec bins |
 |
 |
| Parameter | Plot |
|---|---|
| CZT HV Monitor | 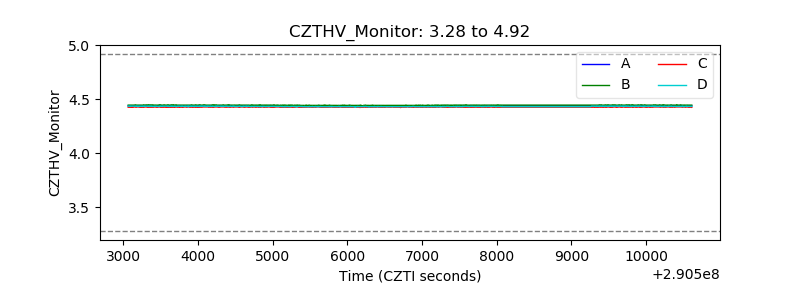 |
| D_VDD | 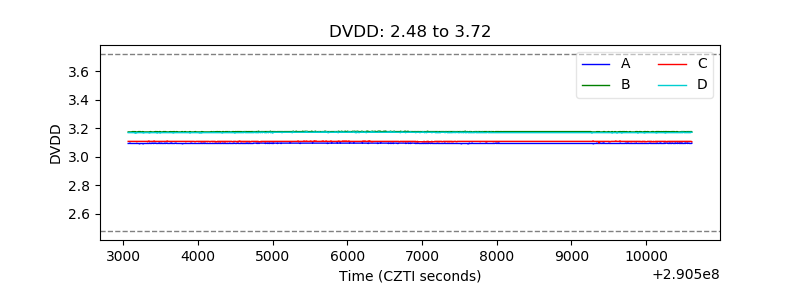 |
| Temperature 1 | 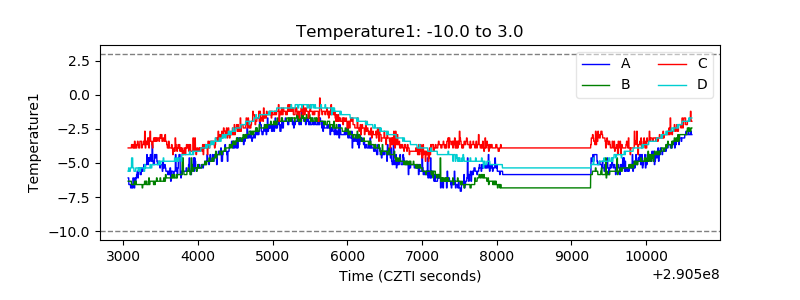 |
| Veto HV Monitor | 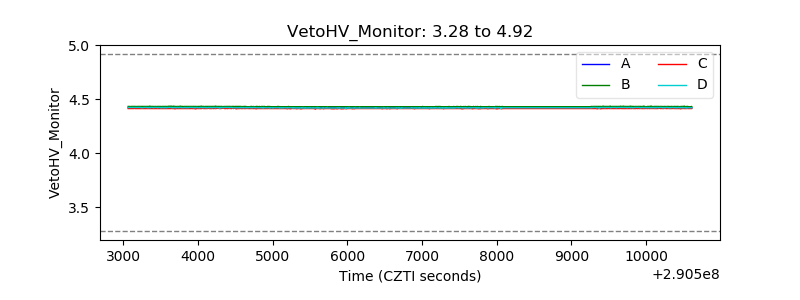 |
| Veto LLD | 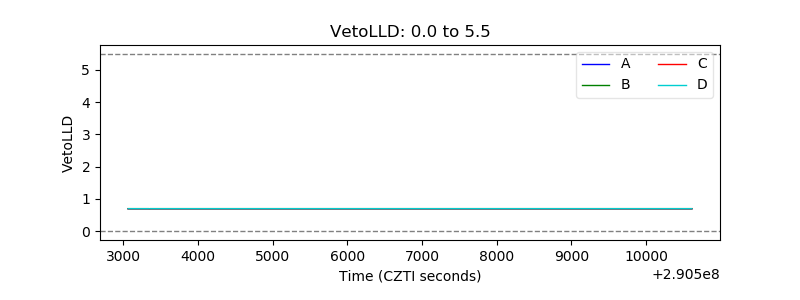 |
| Alpha Counter | 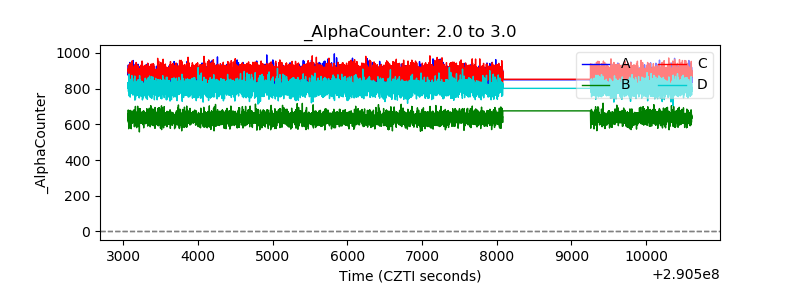 |
| _CPM_Rate | 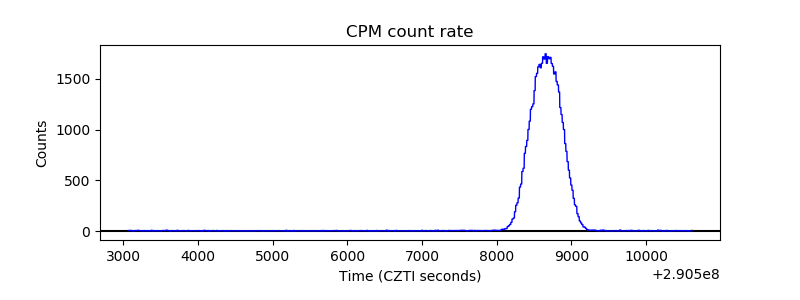 |
| CZT Counter | 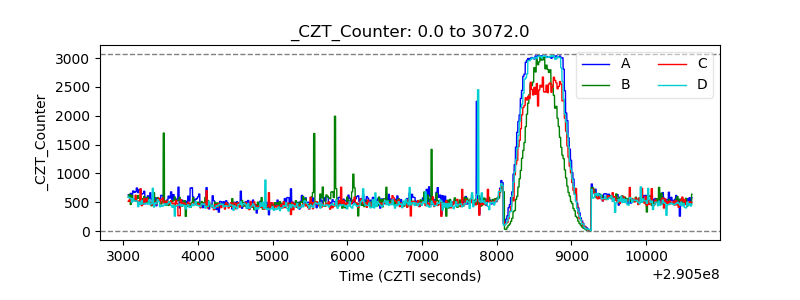 |
| +2.5 Volts monitor |  |
| +5 Volts monitor |  |
| _ROLL_ROT |  |
| _Roll_DEC | 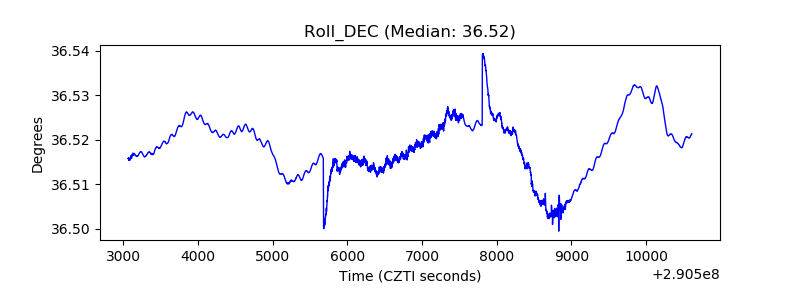 |
| _Roll_RA | 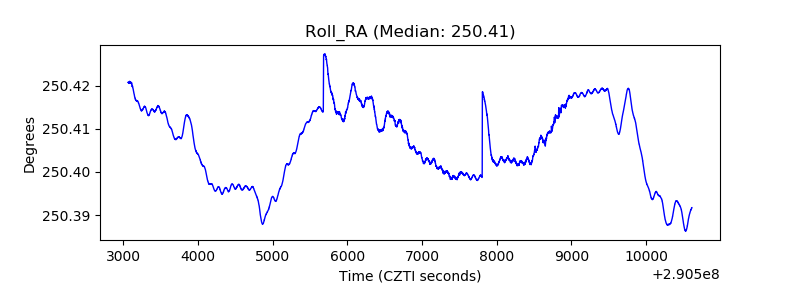 |
| Veto Counter |  |