| Param | Original file | Final file |
|---|---|---|
| Filename | modeM0/AS1A05_072T04_9000002802_18744cztM0_level2.evt | modeM0/AS1A05_072T04_9000002802_18744cztM0_level2_quad_clean.evt |
| Size (bytes) | 266,624,640 | 38,321,280 |
| Size | 254.3 MB | 36.5 MB |
| Events in quadrant A | 1,983,570 | 231,050 |
| Events in quadrant B | 2,007,627 | 233,696 |
| Events in quadrant C | 1,866,918 | 223,607 |
| Events in quadrant D | 1,975,370 | 221,497 |
| Mode SS | |||
|---|---|---|---|
| Quadrant | BADHDUFLAG | Total packets | Discarded packets |
| A | 0 | 72 | 0 |
| B | 0 | 72 | 0 |
| C | 0 | 72 | 0 |
| D | 0 | 72 | 0 |
| Mode M0 | |||
|---|---|---|---|
| Quadrant | BADHDUFLAG | Total packets | Discarded packets |
| A | 0 | 8079 | 0 |
| B | 0 | 8081 | 0 |
| C | 0 | 7596 | 0 |
| D | 0 | 7972 | 0 |
| Quadrant | Total seconds | Saturated seconds | Saturation percentage |
|---|---|---|---|
| A | 3524 | 5 | 0.141884% |
| B | 3525 | 35 | 0.992908% |
| C | 3525 | 17 | 0.482270% |
| D | 3525 | 6 | 0.170213% |
Noise dominated data is calculated using 1-second bins in cleaned event files. If a bin has >2000 counts, and if more than 50% of those come from <1% of pixels, then it is considered to be noise-dominated and hence unusable.
| Quadrant | # 1 sec bins | Bins with >0 counts | Bins with >2000 counts | High rate bins dominated by noise | Noise dominated (total time) | Noise dominated (detector-on time) | Marked lightcurve |
|---|---|---|---|---|---|---|---|
| A | 3525 | 3525 | 1 | 1 | 0.03% | 0.03% | 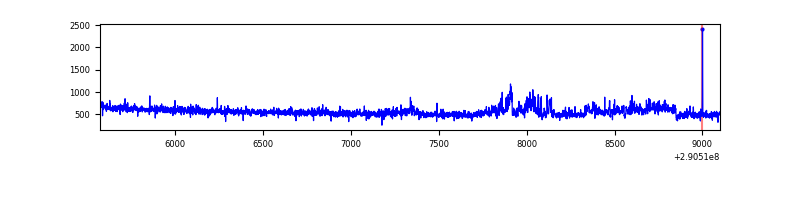 |
| B | 3526 | 3526 | 20 | 20 | 0.57% | 0.57% | 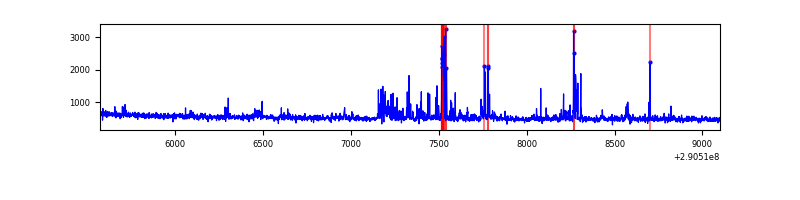 |
| C | 3526 | 3526 | 0 | 0 | 0.00% | 0.00% | 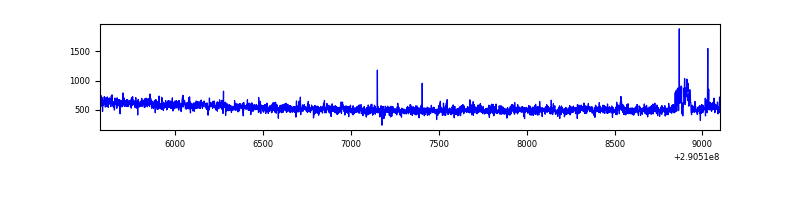 |
| D | 3526 | 3526 | 4 | 4 | 0.11% | 0.11% | 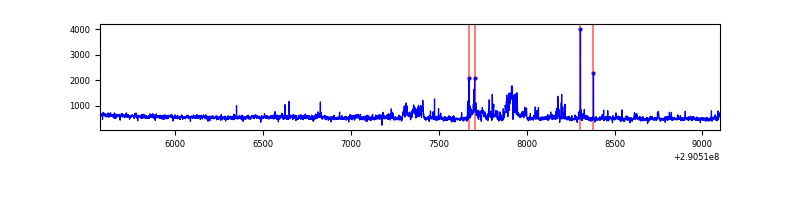 |
Top three noisy pixels from each quadrant. If the there are fewer than three noisy pixels in the level2.evt file, extra rows are filled as -1
| Pixel properties | Quadrant properties | ||||||
|---|---|---|---|---|---|---|---|
| Quadrant | DetID | PixID | Counts | Sigma | Mean | Median | Sigma |
| A | 15 | 191 | 111721 | 1156.84 | 472 | 464 | 96.2 |
| A | 15 | 192 | 53875 | 555.36 | 472 | 464 | 96.2 |
| A | 13 | 254 | 5786 | 55.34 | 472 | 464 | 96.2 |
| B | 7 | 220 | 151679 | 1730.1 | 461 | 451 | 87.4 |
| B | 4 | 216 | 19849 | 221.92 | 461 | 451 | 87.4 |
| B | 12 | 111 | 9338 | 101.67 | 461 | 451 | 87.4 |
| C | 14 | 238 | 71810 | 697.04 | 443 | 447 | 102.4 |
| C | 3 | 233 | 63393 | 614.83 | 443 | 447 | 102.4 |
| C | 13 | 61 | 3174 | 26.64 | 443 | 447 | 102.4 |
| D | 13 | 168 | 197013 | 1754.31 | 457 | 444 | 112.0 |
| D | 7 | 96 | 20609 | 179.97 | 457 | 444 | 112.0 |
| D | 2 | 234 | 15404 | 133.51 | 457 | 444 | 112.0 |
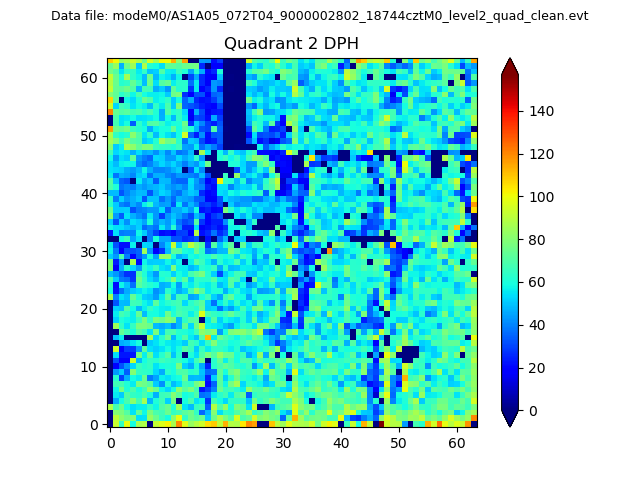
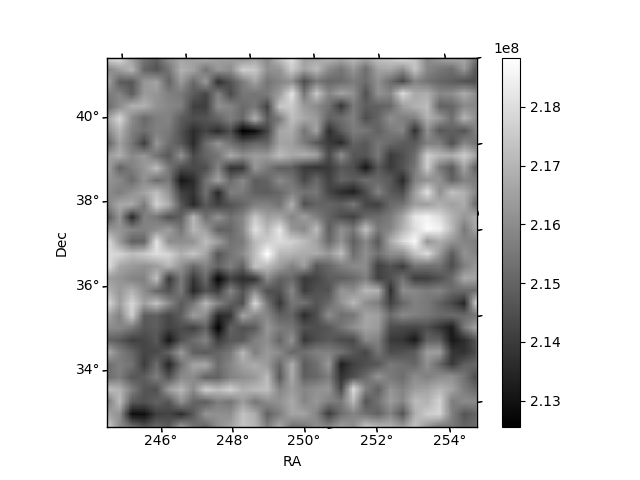
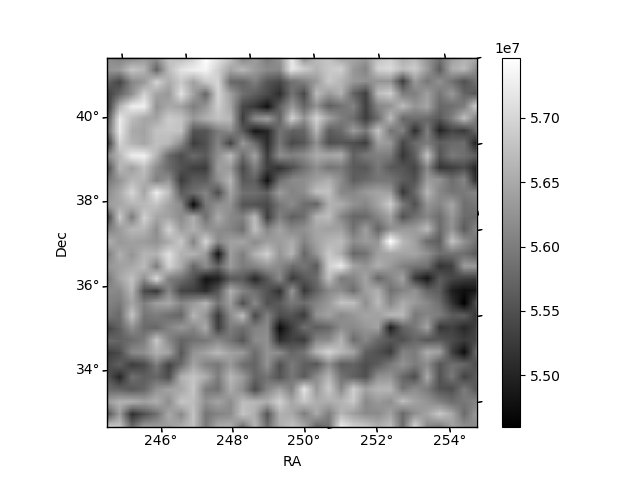
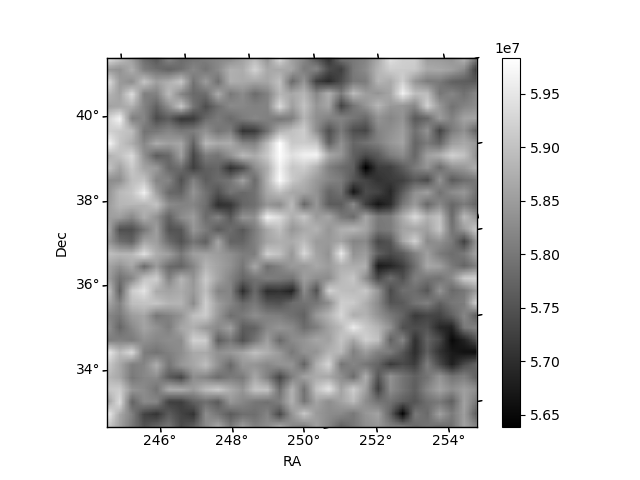
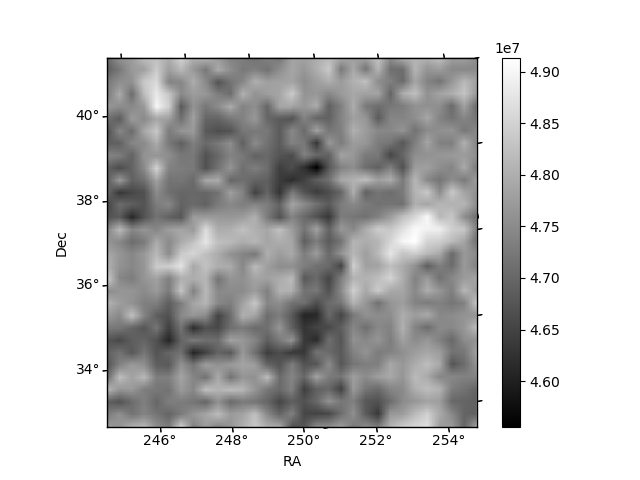
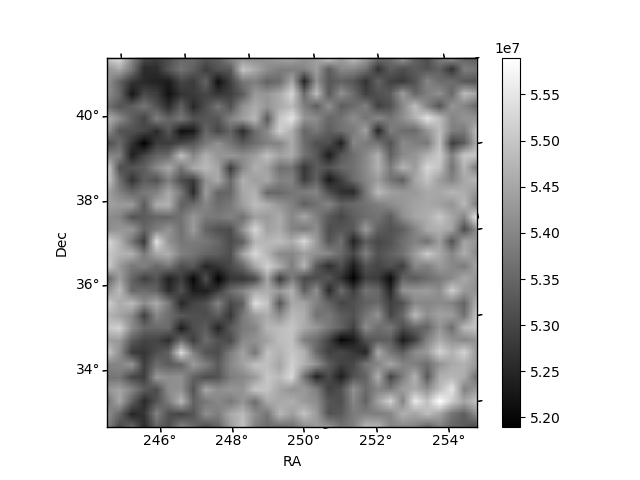
Histogram calculated using DETX and DETY for each event in the final _common_clean file
| Quadrant A | 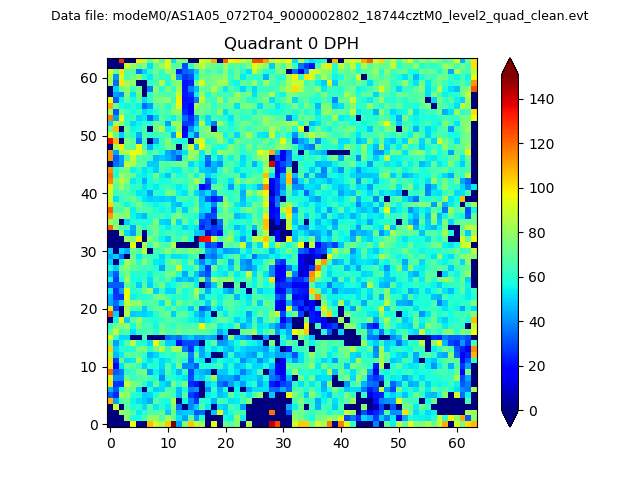 |
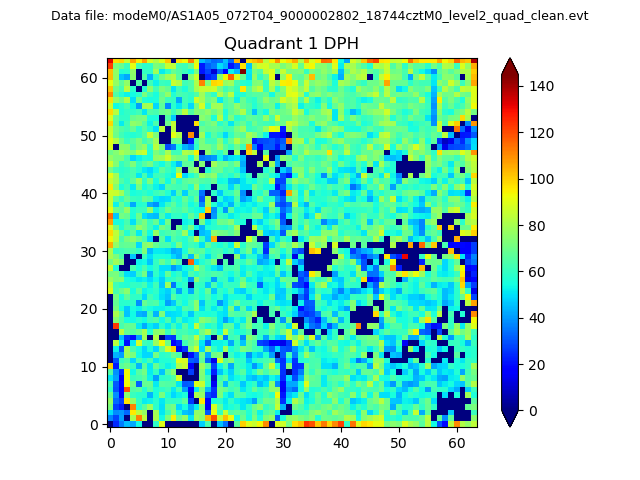 |
Quadrant B |
|---|---|---|---|
| Quadrant D | 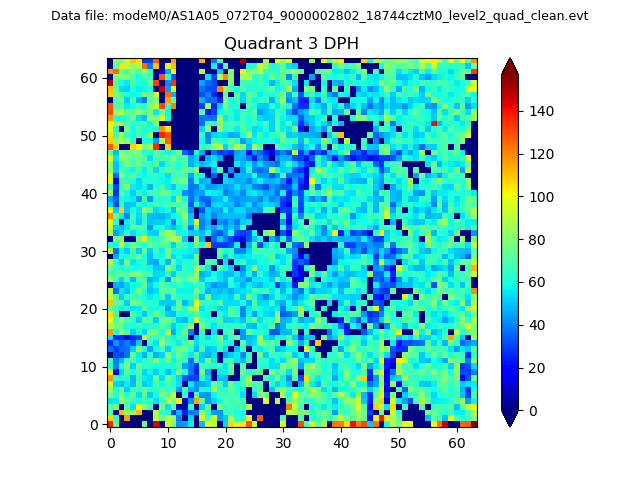 |
 |
Quadrant C |
| Plot type | Count rate plots | Images |
|---|---|---|
| Comparison with Poisson distribution Blue bars denote a histogram of data divided into 1 sec bins. Red curve is a Poisson curve with rate = median count rate of data. |
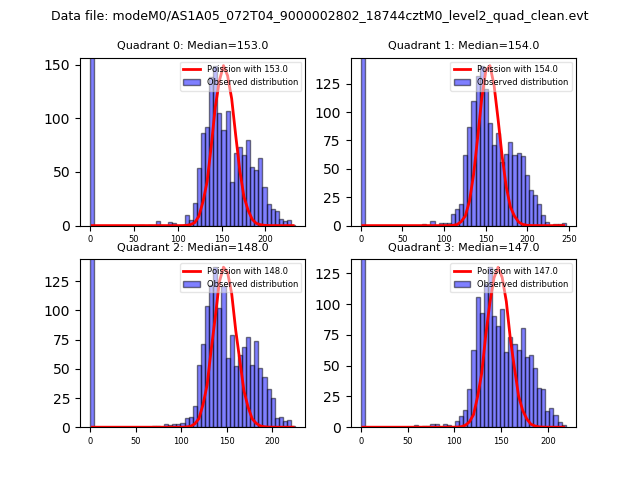 |
 |
| Quadrant-wise count rates Data is divided into 100 sec bins |
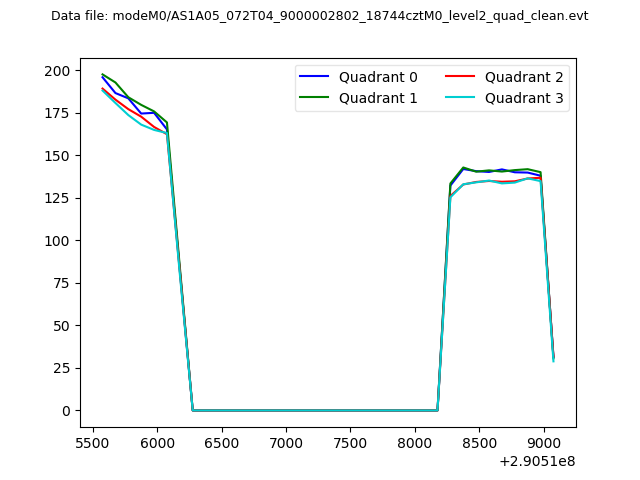 |
|
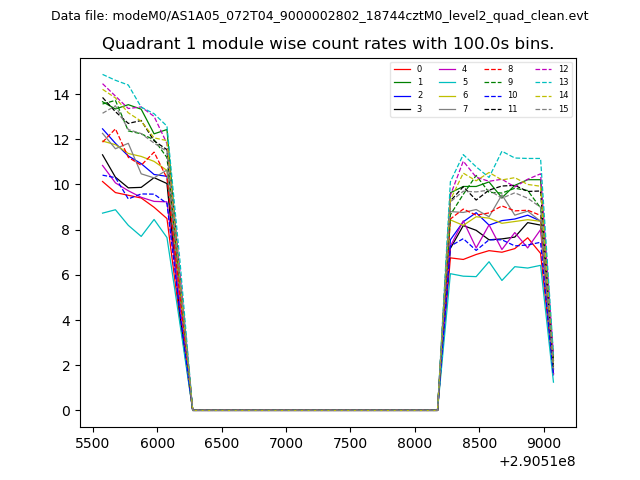
| Module-wise count rates for Quadrant A Data is divided into 100 sec bins |
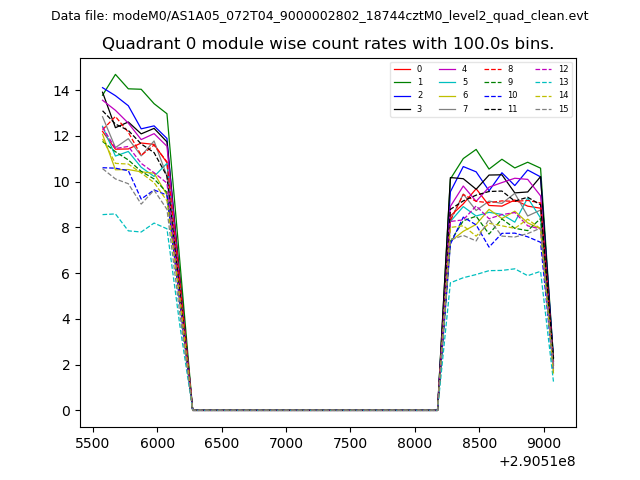 |
 |
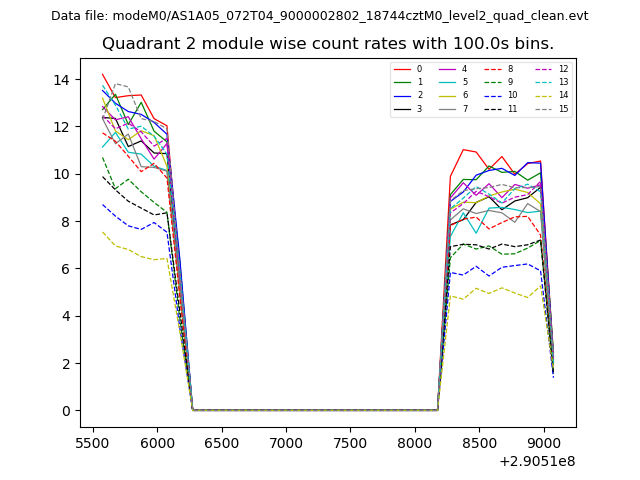
| Module-wise count rates for Quadrant B Data is divided into 100 sec bins |
 |
 |
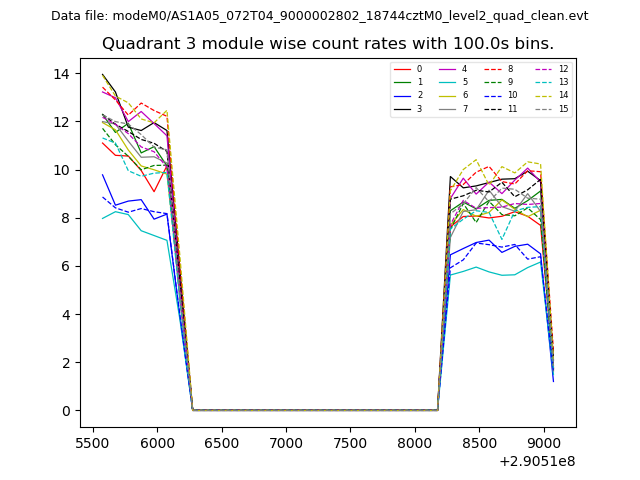
| Module-wise count rates for Quadrant C Data is divided into 100 sec bins |
 |
 |
| Module-wise count rates for Quadrant D Data is divided into 100 sec bins |
 |
 |
| Parameter | Plot |
|---|---|
| CZT HV Monitor | 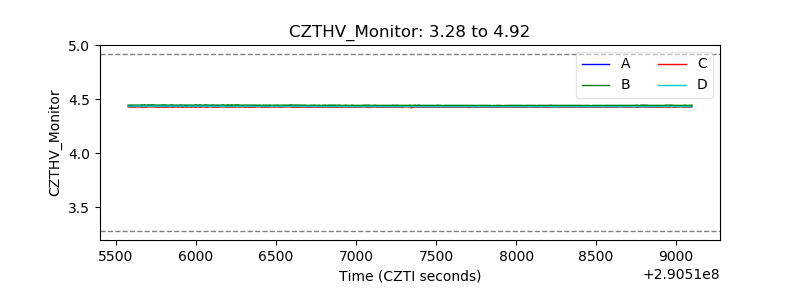 |
| D_VDD | 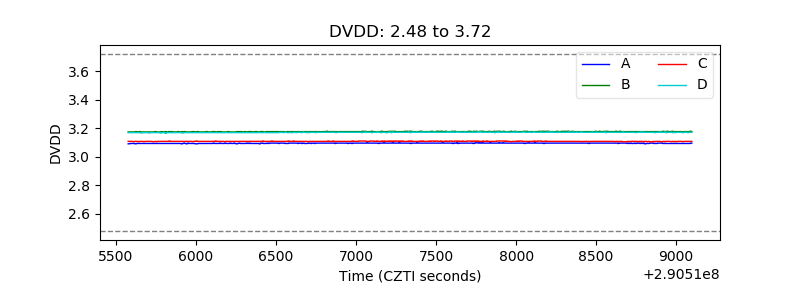 |
| Temperature 1 | 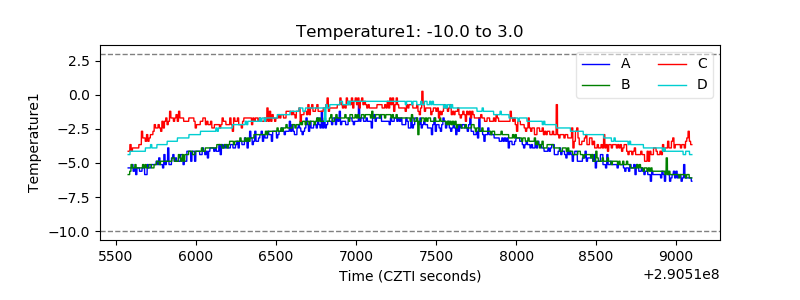 |
| Veto HV Monitor | 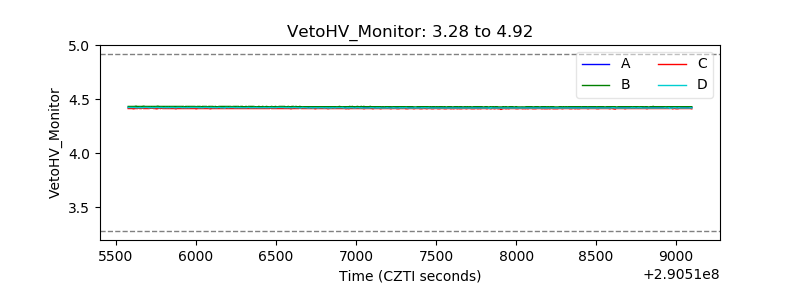 |
| Veto LLD | 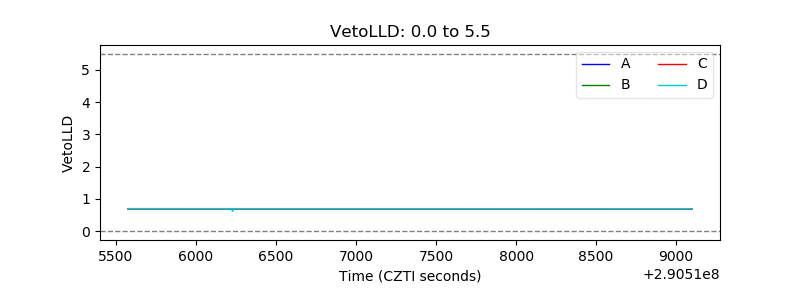 |
| Alpha Counter | 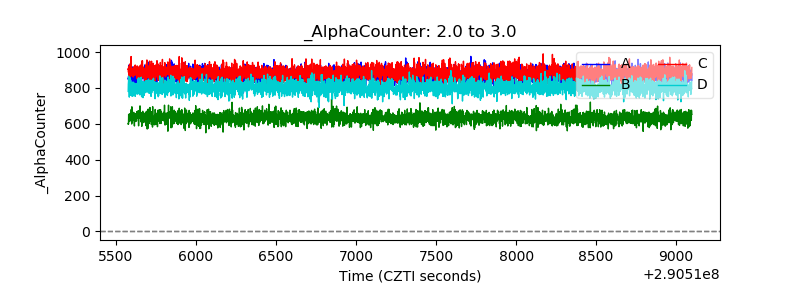 |
| _CPM_Rate | 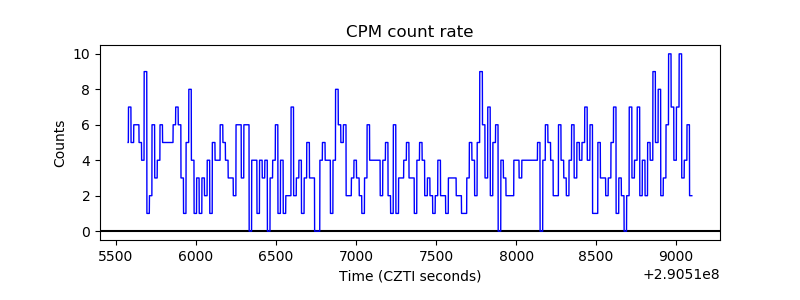 |
| CZT Counter | 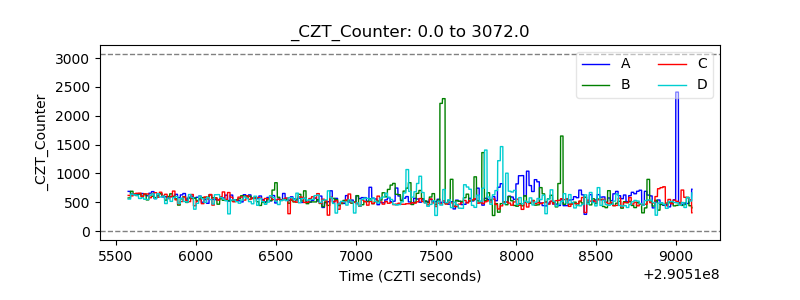 |
| +2.5 Volts monitor |  |
| +5 Volts monitor |  |
| _ROLL_ROT | 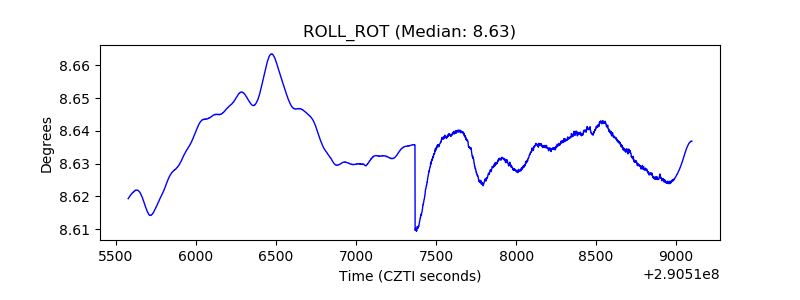 |
| _Roll_DEC | 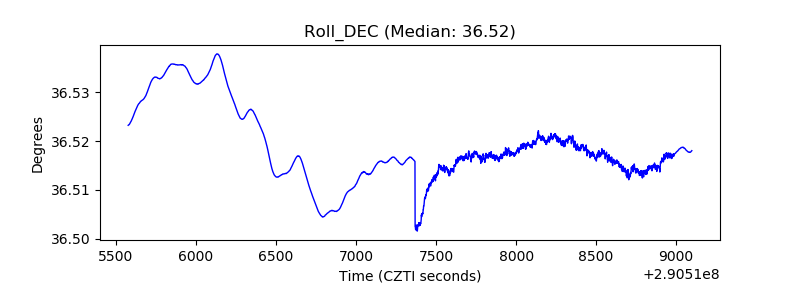 |
| _Roll_RA | 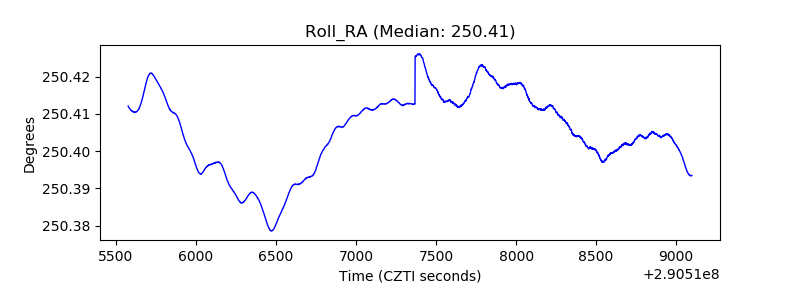 |
| Veto Counter | 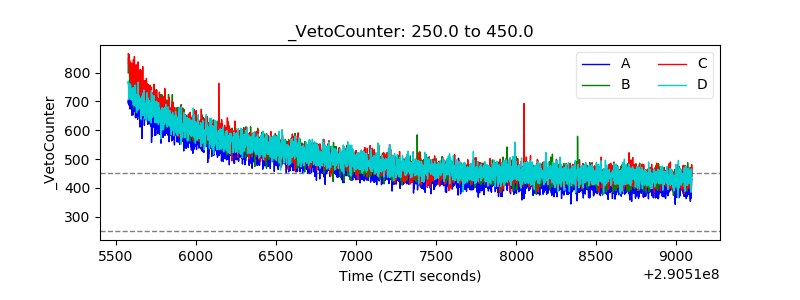 |