| Param | Original file | Final file |
|---|---|---|
| Filename | modeM0/AS1A05_226T06_9000002800_18724cztM0_level2.evt | modeM0/AS1A05_226T06_9000002800_18724cztM0_level2_quad_clean.evt |
| Size (bytes) | 372,205,440 | 60,258,240 |
| Size | 355.0 MB | 57.5 MB |
| Events in quadrant A | 2,438,228 | 375,251 |
| Events in quadrant B | 3,269,866 | 375,282 |
| Events in quadrant C | 2,759,808 | 353,958 |
| Events in quadrant D | 2,450,465 | 355,915 |
| Mode M9 | |||
|---|---|---|---|
| Quadrant | BADHDUFLAG | Total packets | Discarded packets |
| A | 0 | 9 | 0 |
| B | 0 | 9 | 0 |
| C | 0 | 9 | 0 |
| D | 0 | 9 | 0 |
| Mode M0 | |||
|---|---|---|---|
| Quadrant | BADHDUFLAG | Total packets | Discarded packets |
| A | 0 | 10530 | 1 |
| B | 0 | 13038 | 1 |
| C | 0 | 11423 | 1 |
| D | 0 | 10891 | 1 |
| Mode SS | |||
|---|---|---|---|
| Quadrant | BADHDUFLAG | Total packets | Discarded packets |
| A | 0 | 106 | 0 |
| B | 0 | 106 | 0 |
| C | 0 | 106 | 0 |
| D | 0 | 106 | 0 |
| Quadrant | Total seconds | Saturated seconds | Saturation percentage |
|---|---|---|---|
| A | 5194 | 25 | 0.481325% |
| B | 5194 | 165 | 3.176742% |
| C | 5194 | 149 | 2.868695% |
| D | 5194 | 40 | 0.770119% |
Noise dominated data is calculated using 1-second bins in cleaned event files. If a bin has >2000 counts, and if more than 50% of those come from <1% of pixels, then it is considered to be noise-dominated and hence unusable.
| Quadrant | # 1 sec bins | Bins with >0 counts | Bins with >2000 counts | High rate bins dominated by noise | Noise dominated (total time) | Noise dominated (detector-on time) | Marked lightcurve |
|---|---|---|---|---|---|---|---|
| A | 6044 | 5195 | 0 | 0 | 0.00% | 0.00% |  |
| B | 6044 | 5195 | 88 | 88 | 1.46% | 1.69% |  |
| C | 6044 | 5195 | 68 | 68 | 1.13% | 1.31% |  |
| D | 6044 | 5195 | 36 | 36 | 0.60% | 0.69% |  |
Top three noisy pixels from each quadrant. If the there are fewer than three noisy pixels in the level2.evt file, extra rows are filled as -1
| Pixel properties | Quadrant properties | ||||||
|---|---|---|---|---|---|---|---|
| Quadrant | DetID | PixID | Counts | Sigma | Mean | Median | Sigma |
| A | 13 | 254 | 8026 | 57.44 | 630 | 616 | 129.0 |
| A | 11 | 29 | 5893 | 40.91 | 630 | 616 | 129.0 |
| A | 0 | 226 | 5372 | 36.87 | 630 | 616 | 129.0 |
| B | 10 | 245 | 818801 | 6782.71 | 620 | 603 | 120.6 |
| B | 12 | 111 | 14852 | 118.12 | 620 | 603 | 120.6 |
| B | 11 | 111 | 12813 | 101.22 | 620 | 603 | 120.6 |
| C | 3 | 233 | 328859 | 2330.12 | 596 | 598 | 140.9 |
| C | 14 | 238 | 99479 | 701.9 | 596 | 598 | 140.9 |
| C | 14 | 239 | 8272 | 54.47 | 596 | 598 | 140.9 |
| D | 10 | 70 | 86768 | 582.6 | 606 | 588 | 147.9 |
| D | 14 | 34 | 31903 | 211.7 | 606 | 588 | 147.9 |
| D | 7 | 238 | 26686 | 176.43 | 606 | 588 | 147.9 |
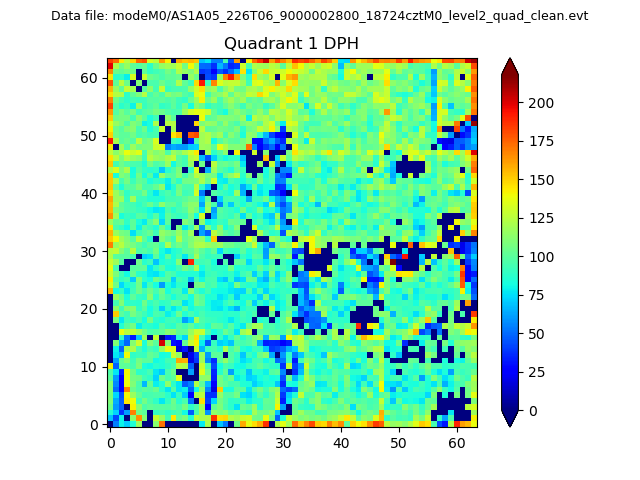
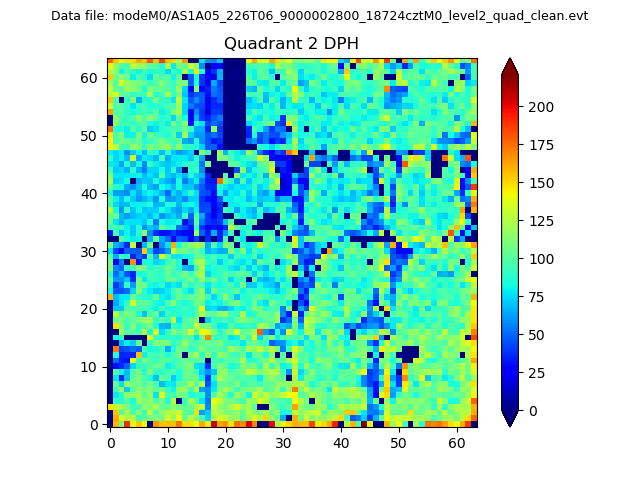
Histogram calculated using DETX and DETY for each event in the final _common_clean file
| Quadrant A |  |
 |
Quadrant B |
|---|---|---|---|
| Quadrant D | 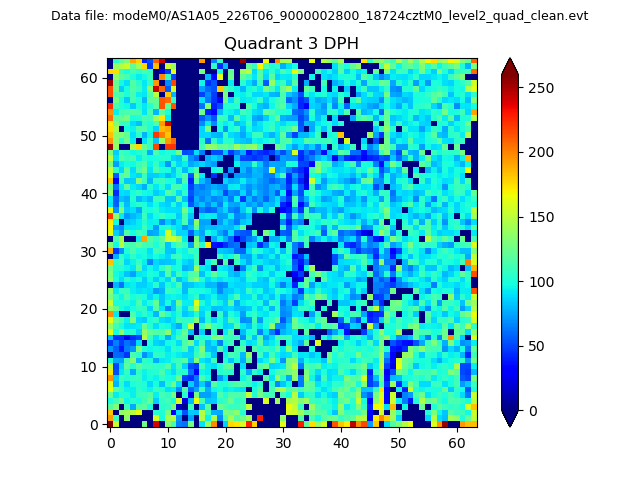 |
 |
Quadrant C |
| Plot type | Count rate plots | Images |
|---|---|---|
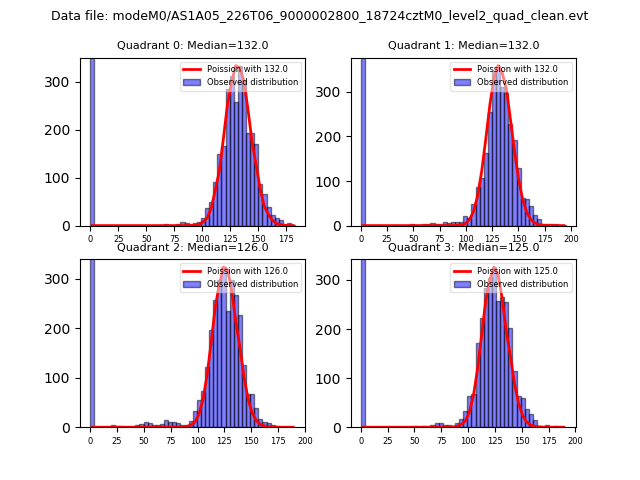
| Comparison with Poisson distribution Blue bars denote a histogram of data divided into 1 sec bins. Red curve is a Poisson curve with rate = median count rate of data. |
 |
 |
| Quadrant-wise count rates Data is divided into 100 sec bins |
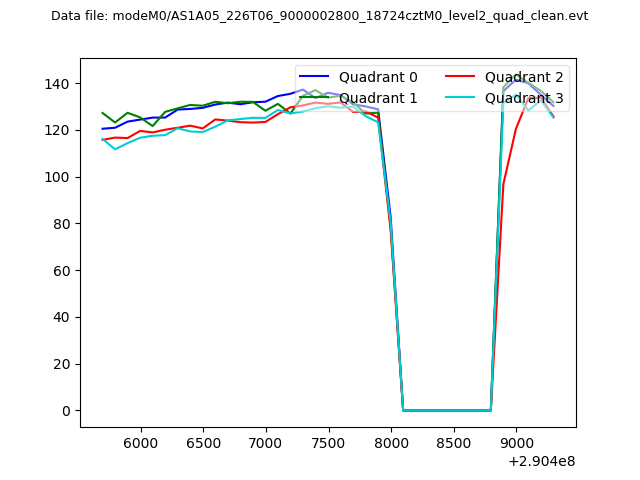 |
|
| Module-wise count rates for Quadrant A Data is divided into 100 sec bins |
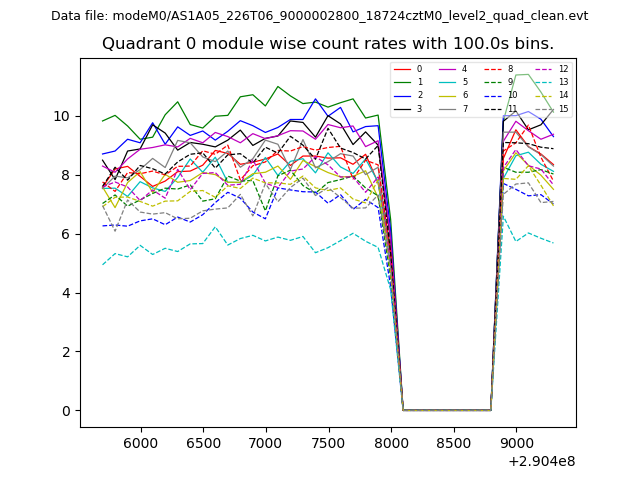 |
 |
| Module-wise count rates for Quadrant B Data is divided into 100 sec bins |
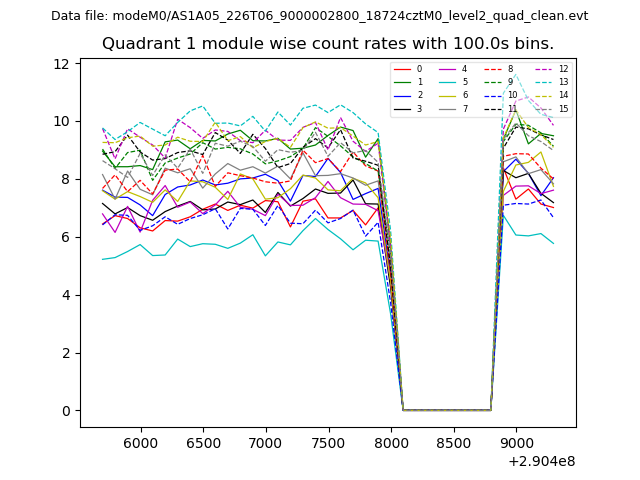 |
 |
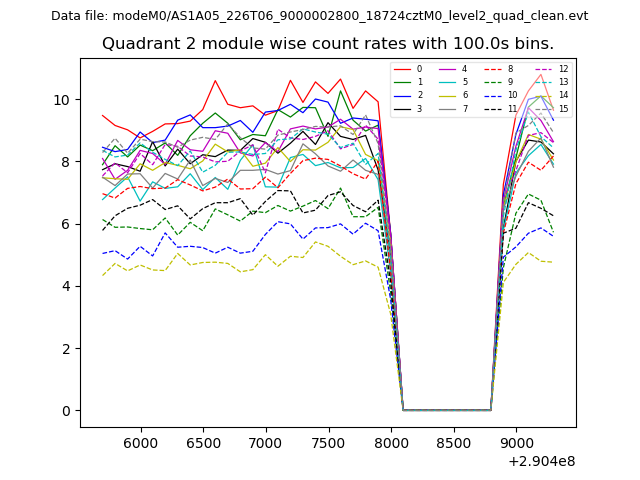
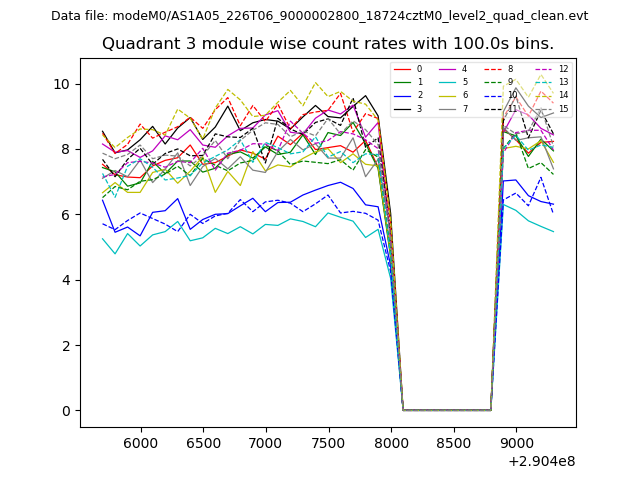
| Module-wise count rates for Quadrant C Data is divided into 100 sec bins |
 |
 |
| Module-wise count rates for Quadrant D Data is divided into 100 sec bins |
 |
 |
| Parameter | Plot |
|---|---|
| CZT HV Monitor | 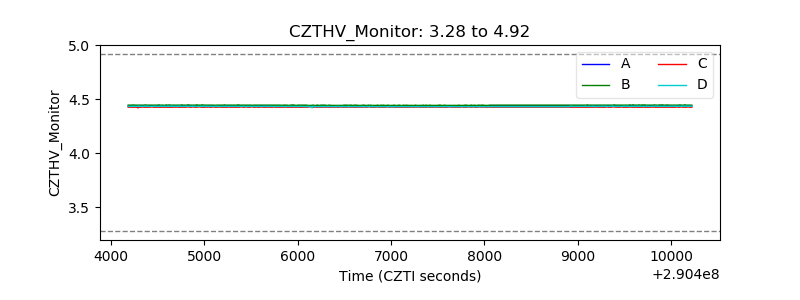 |
| D_VDD |  |
| Temperature 1 | 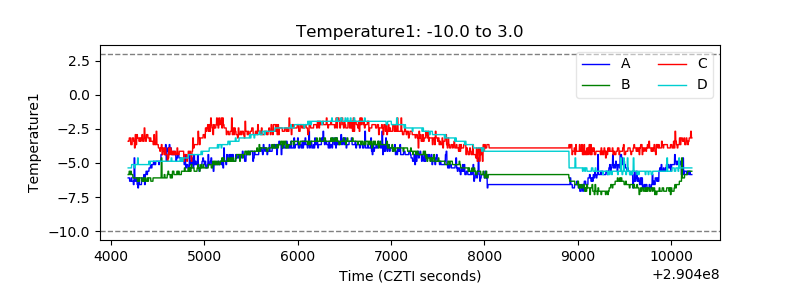 |
| Veto HV Monitor | 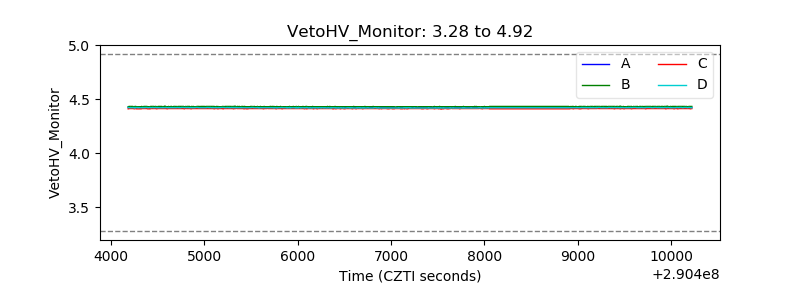 |
| Veto LLD | 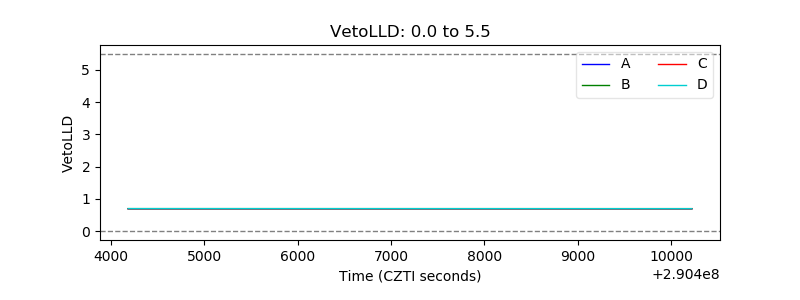 |
| Alpha Counter | 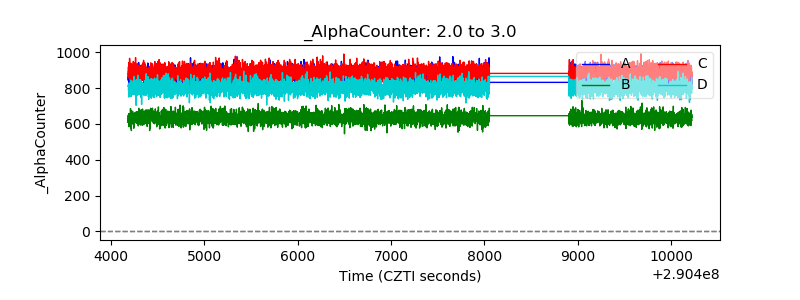 |
| _CPM_Rate | 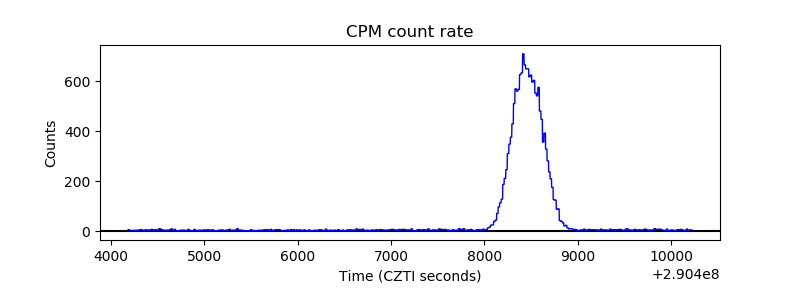 |
| CZT Counter | 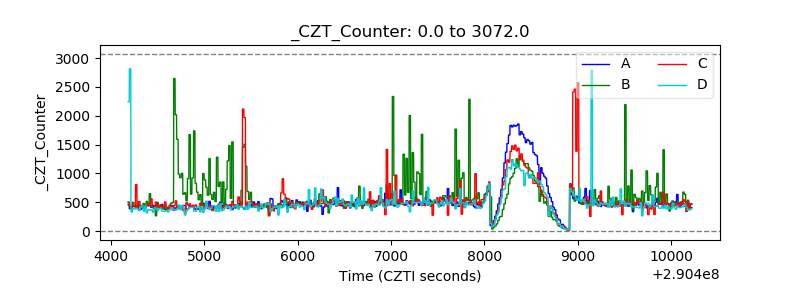 |
| +2.5 Volts monitor |  |
| +5 Volts monitor | 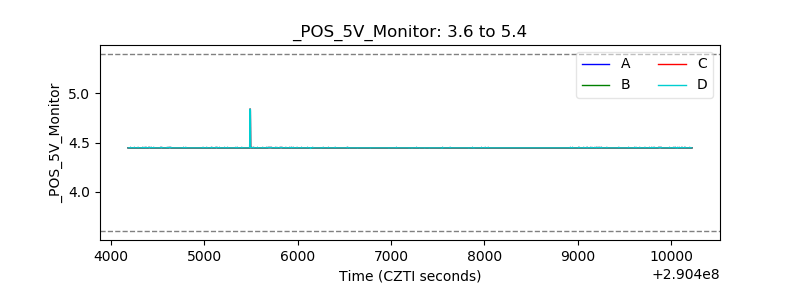 |
| _ROLL_ROT | 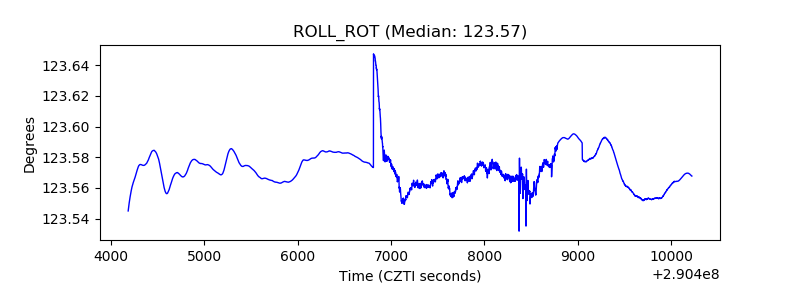 |
| _Roll_DEC | 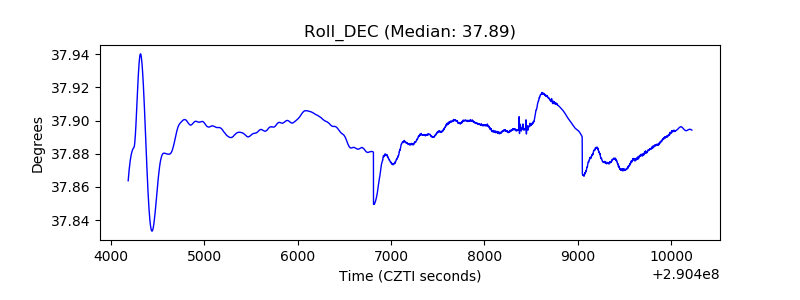 |
| _Roll_RA | 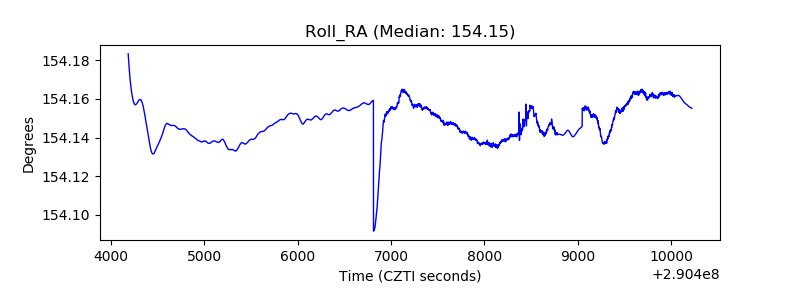 |
| Veto Counter | 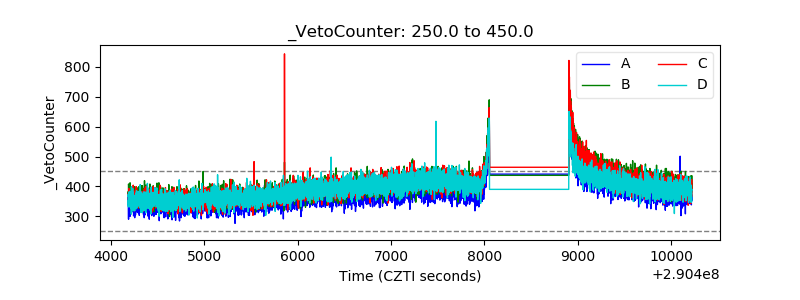 |