| Param | Original file | Final file |
|---|---|---|
| Filename | modeM0/AS1A05_226T06_9000002800_18725cztM0_level2.evt | modeM0/AS1A05_226T06_9000002800_18725cztM0_level2_quad_clean.evt |
| Size (bytes) | 451,673,280 | 69,451,200 |
| Size | 430.7 MB | 66.2 MB |
| Events in quadrant A | 3,164,926 | 422,803 |
| Events in quadrant B | 3,579,864 | 427,210 |
| Events in quadrant C | 3,271,785 | 400,559 |
| Events in quadrant D | 3,217,821 | 396,191 |
| Mode M9 | |||
|---|---|---|---|
| Quadrant | BADHDUFLAG | Total packets | Discarded packets |
| A | 0 | 14 | 0 |
| B | 0 | 15 | 0 |
| C | 0 | 15 | 0 |
| D | 0 | 15 | 0 |
| Mode M0 | |||
|---|---|---|---|
| Quadrant | BADHDUFLAG | Total packets | Discarded packets |
| A | 0 | 13439 | 2 |
| B | 0 | 14675 | 3 |
| C | 0 | 13805 | 2 |
| D | 0 | 13991 | 2 |
| Mode SS | |||
|---|---|---|---|
| Quadrant | BADHDUFLAG | Total packets | Discarded packets |
| A | 0 | 134 | 0 |
| B | 0 | 134 | 0 |
| C | 0 | 134 | 0 |
| D | 0 | 134 | 0 |
| Quadrant | Total seconds | Saturated seconds | Saturation percentage |
|---|---|---|---|
| A | 6536 | 58 | 0.887393% |
| B | 6535 | 117 | 1.790360% |
| C | 6535 | 139 | 2.127008% |
| D | 6535 | 87 | 1.331293% |
Noise dominated data is calculated using 1-second bins in cleaned event files. If a bin has >2000 counts, and if more than 50% of those come from <1% of pixels, then it is considered to be noise-dominated and hence unusable.
| Quadrant | # 1 sec bins | Bins with >0 counts | Bins with >2000 counts | High rate bins dominated by noise | Noise dominated (total time) | Noise dominated (detector-on time) | Marked lightcurve |
|---|---|---|---|---|---|---|---|
| A | 7516 | 6537 | 1 | 1 | 0.01% | 0.02% | 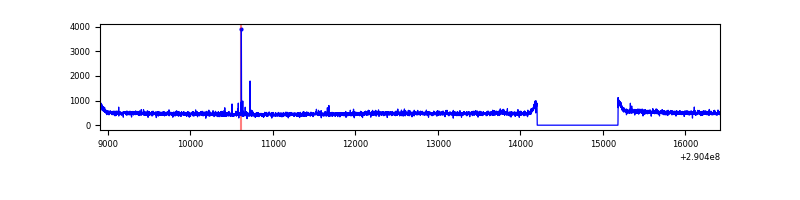 |
| B | 7515 | 6536 | 33 | 33 | 0.44% | 0.50% | 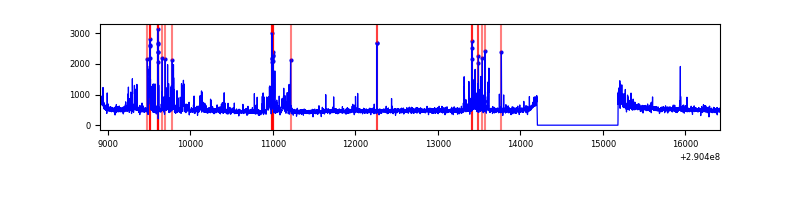 |
| C | 7515 | 6536 | 52 | 52 | 0.69% | 0.80% | 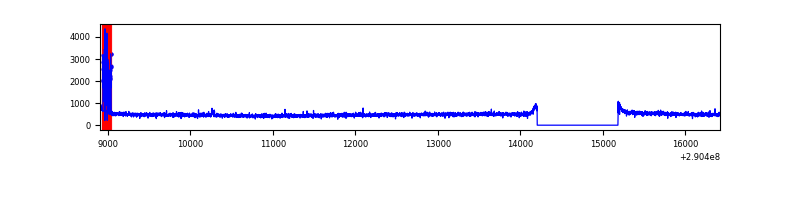 |
| D | 7515 | 6536 | 52 | 52 | 0.69% | 0.80% | 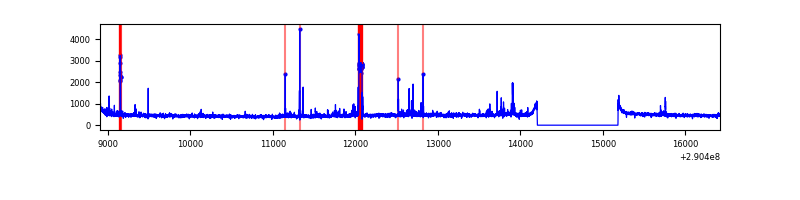 |
Top three noisy pixels from each quadrant. If the there are fewer than three noisy pixels in the level2.evt file, extra rows are filled as -1
| Pixel properties | Quadrant properties | ||||||
|---|---|---|---|---|---|---|---|
| Quadrant | DetID | PixID | Counts | Sigma | Mean | Median | Sigma |
| A | 0 | 13 | 21867 | 129.39 | 811 | 795 | 162.9 |
| A | 13 | 254 | 10071 | 56.96 | 811 | 795 | 162.9 |
| A | 15 | 192 | 9375 | 52.68 | 811 | 795 | 162.9 |
| B | 10 | 245 | 379596 | 2445.4 | 807 | 785 | 154.9 |
| B | 12 | 111 | 19121 | 118.36 | 807 | 785 | 154.9 |
| B | 11 | 111 | 16548 | 101.75 | 807 | 785 | 154.9 |
| C | 3 | 233 | 155765 | 862.56 | 768 | 774 | 179.7 |
| C | 14 | 238 | 120397 | 665.73 | 768 | 774 | 179.7 |
| C | 13 | 61 | 5508 | 26.35 | 768 | 774 | 179.7 |
| D | 14 | 34 | 146201 | 761.71 | 777 | 755 | 190.9 |
| D | 7 | 96 | 54846 | 283.28 | 777 | 755 | 190.9 |
| D | 7 | 238 | 49145 | 253.42 | 777 | 755 | 190.9 |
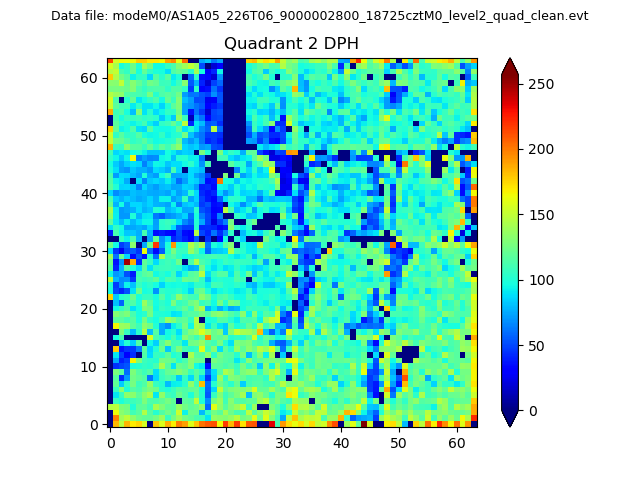
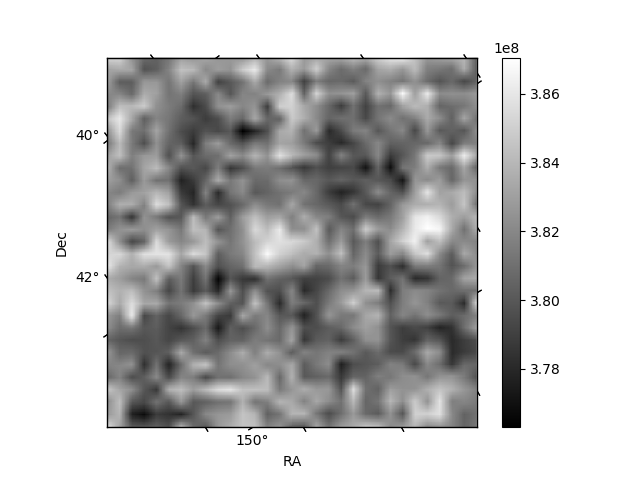
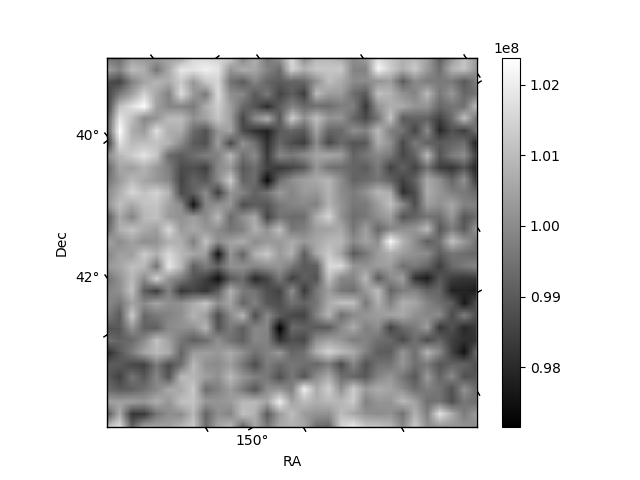
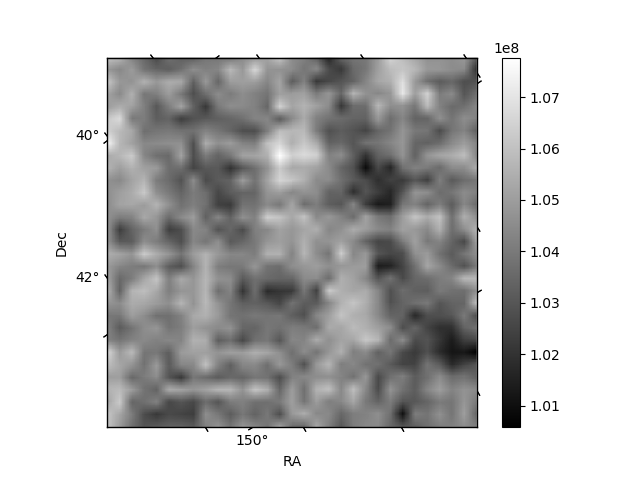
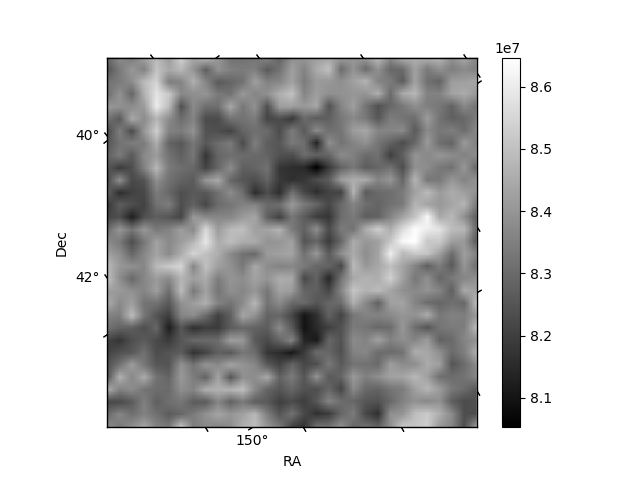
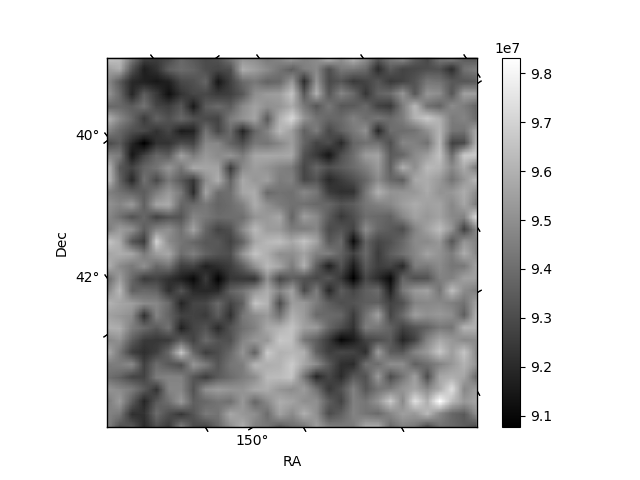
Histogram calculated using DETX and DETY for each event in the final _common_clean file
| Quadrant A | 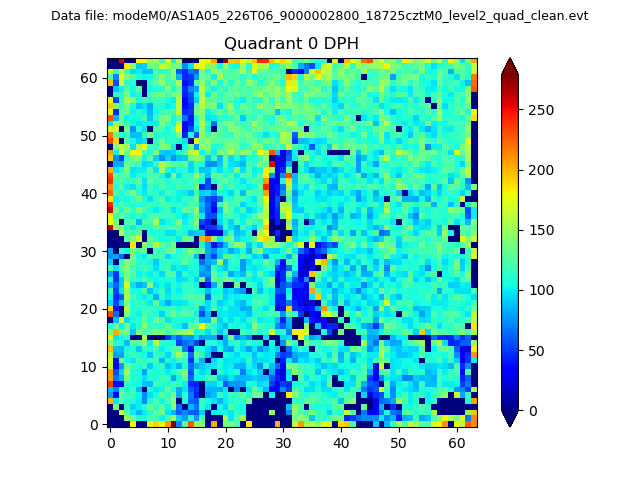 |
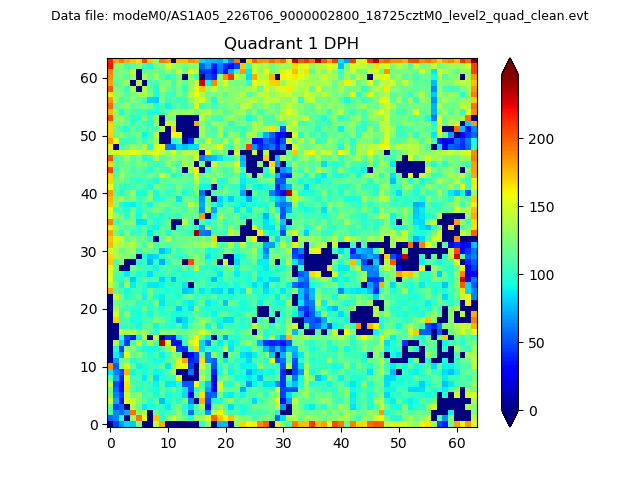 |
Quadrant B |
|---|---|---|---|
| Quadrant D | 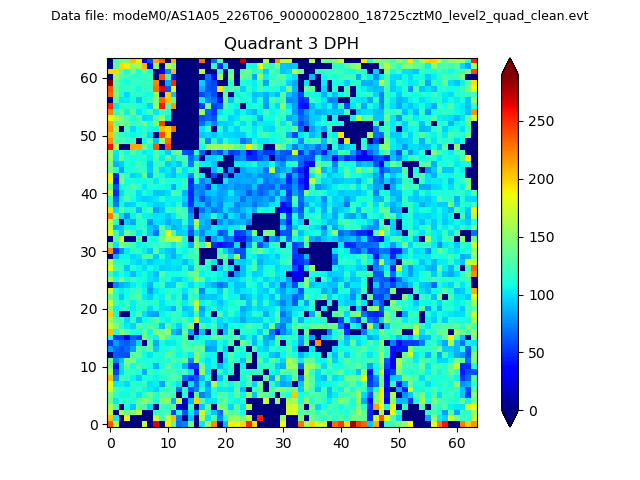 |
 |
Quadrant C |
| Plot type | Count rate plots | Images |
|---|---|---|
| Comparison with Poisson distribution Blue bars denote a histogram of data divided into 1 sec bins. Red curve is a Poisson curve with rate = median count rate of data. |
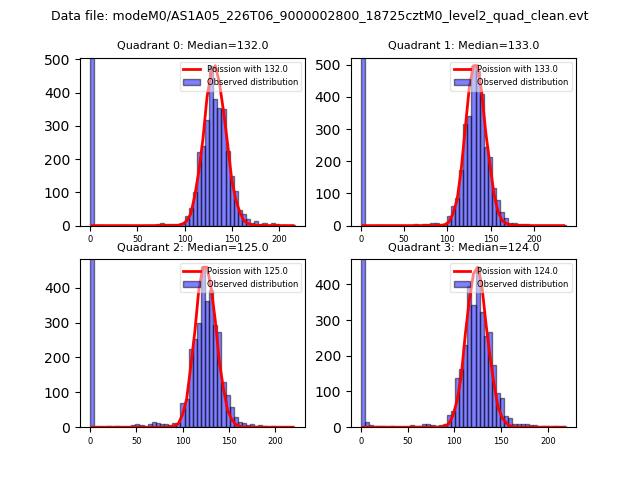 |
 |
| Quadrant-wise count rates Data is divided into 100 sec bins |
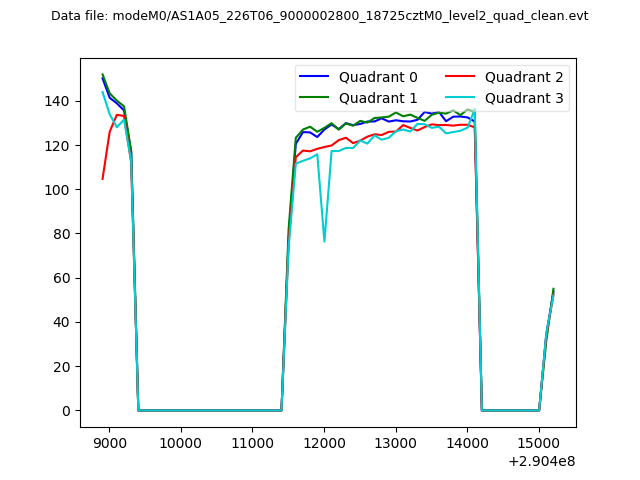 |
|
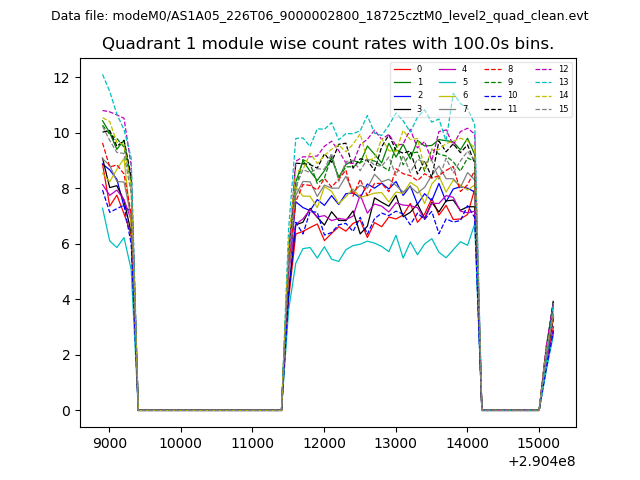
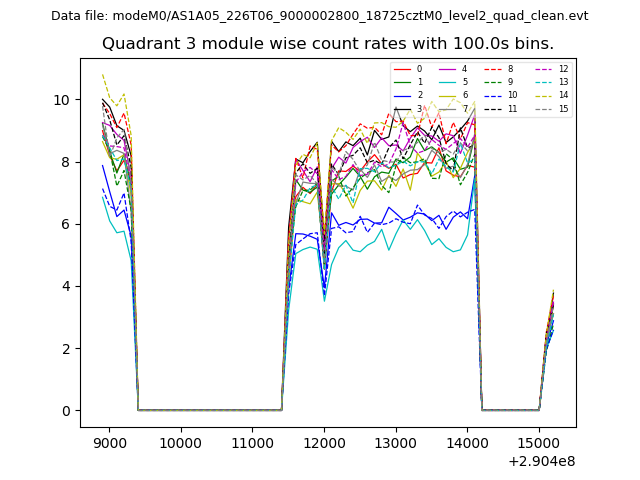
| Module-wise count rates for Quadrant A Data is divided into 100 sec bins |
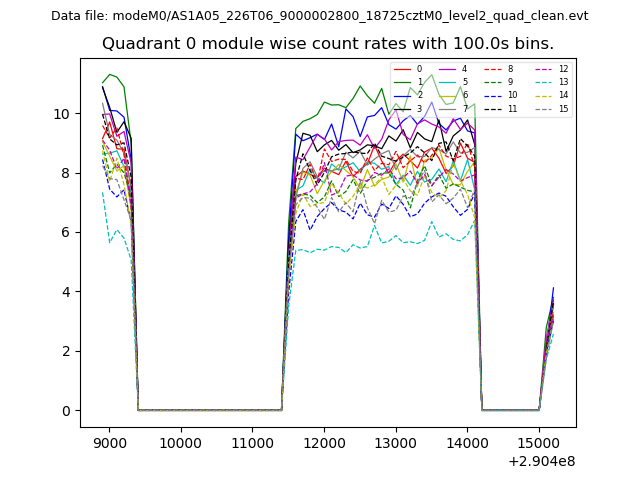 |
 |
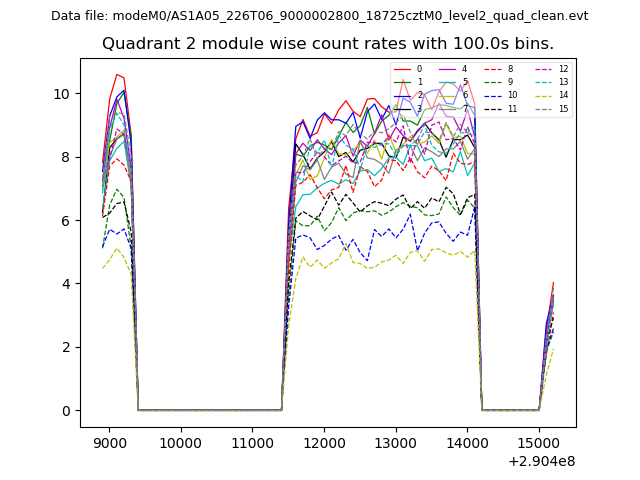
| Module-wise count rates for Quadrant B Data is divided into 100 sec bins |
 |
 |
| Module-wise count rates for Quadrant C Data is divided into 100 sec bins |
 |
 |
| Module-wise count rates for Quadrant D Data is divided into 100 sec bins |
 |
 |
| Parameter | Plot |
|---|---|
| CZT HV Monitor | 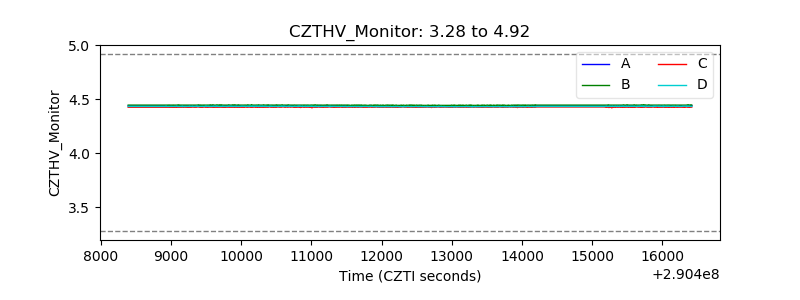 |
| D_VDD |  |
| Temperature 1 | 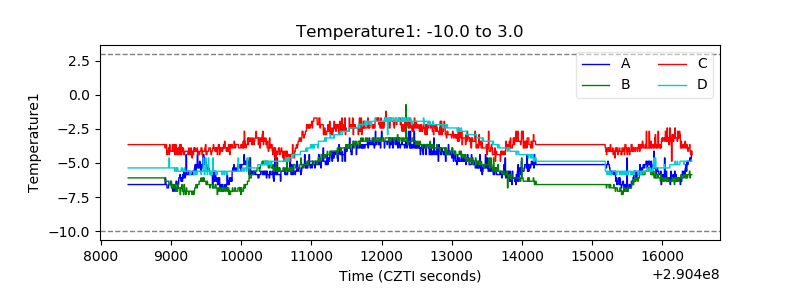 |
| Veto HV Monitor | 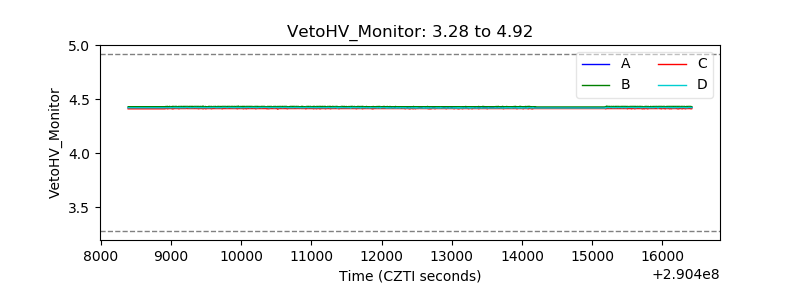 |
| Veto LLD | 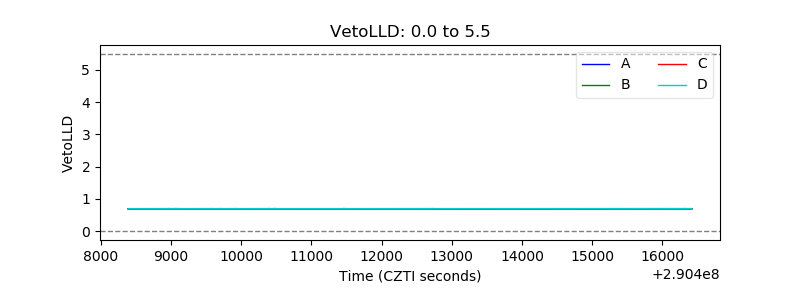 |
| Alpha Counter | 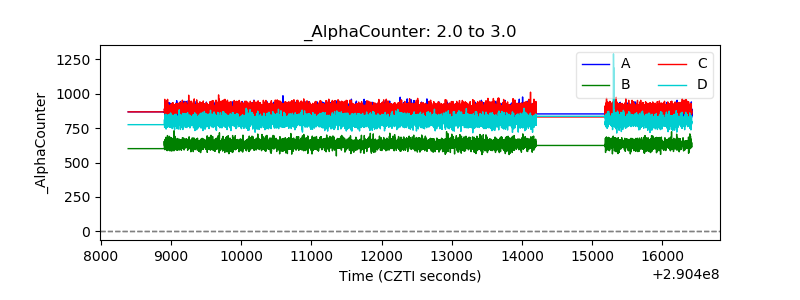 |
| _CPM_Rate | 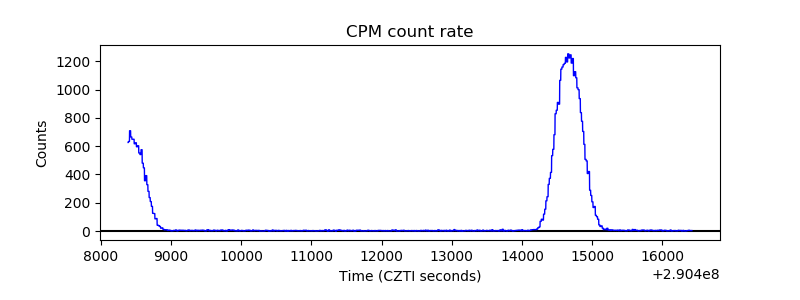 |
| CZT Counter | 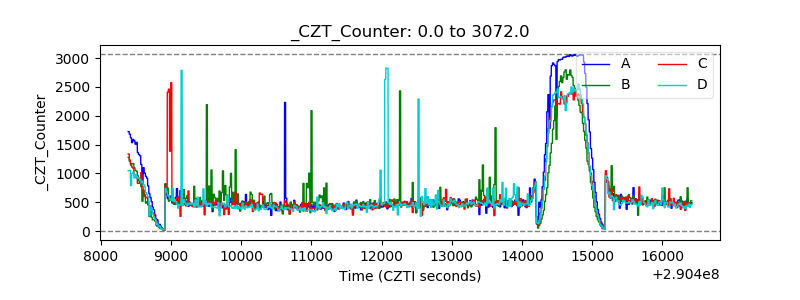 |
| +2.5 Volts monitor |  |
| +5 Volts monitor |  |
| _ROLL_ROT | 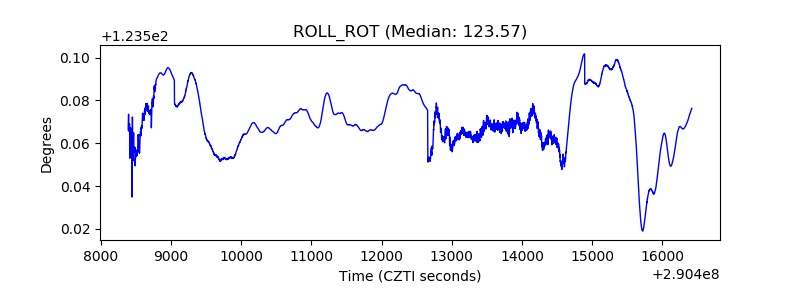 |
| _Roll_DEC | 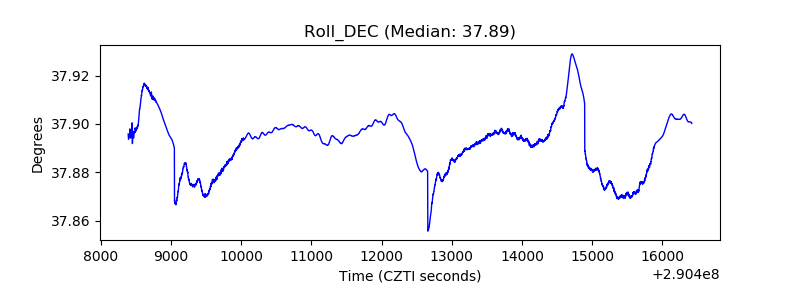 |
| _Roll_RA |  |
| Veto Counter | 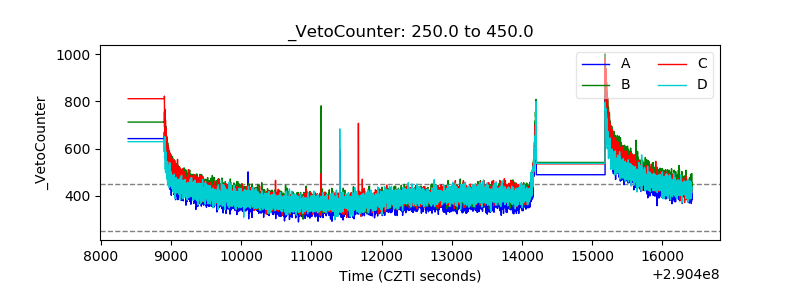 |