| Param | Original file | Final file |
|---|---|---|
| Filename | modeM0/AS1A05_226T06_9000002800_18727cztM0_level2.evt | modeM0/AS1A05_226T06_9000002800_18727cztM0_level2_quad_clean.evt |
| Size (bytes) | 470,972,160 | 73,457,280 |
| Size | 449.2 MB | 70.1 MB |
| Events in quadrant A | 3,456,614 | 446,069 |
| Events in quadrant B | 3,608,346 | 451,356 |
| Events in quadrant C | 3,408,822 | 426,998 |
| Events in quadrant D | 3,326,587 | 424,895 |
| Mode M9 | |||
|---|---|---|---|
| Quadrant | BADHDUFLAG | Total packets | Discarded packets |
| A | 0 | 20 | 0 |
| B | 0 | 20 | 0 |
| C | 0 | 20 | 0 |
| D | 0 | 20 | 0 |
| Mode M0 | |||
|---|---|---|---|
| Quadrant | BADHDUFLAG | Total packets | Discarded packets |
| A | 0 | 14411 | 2 |
| B | 0 | 14869 | 2 |
| C | 0 | 14279 | 2 |
| D | 0 | 14293 | 2 |
| Mode SS | |||
|---|---|---|---|
| Quadrant | BADHDUFLAG | Total packets | Discarded packets |
| A | 0 | 142 | 0 |
| B | 0 | 142 | 0 |
| C | 0 | 142 | 0 |
| D | 0 | 142 | 0 |
| Quadrant | Total seconds | Saturated seconds | Saturation percentage |
|---|---|---|---|
| A | 6808 | 80 | 1.175088% |
| B | 6808 | 118 | 1.733255% |
| C | 6808 | 105 | 1.542303% |
| D | 6809 | 55 | 0.807754% |
Noise dominated data is calculated using 1-second bins in cleaned event files. If a bin has >2000 counts, and if more than 50% of those come from <1% of pixels, then it is considered to be noise-dominated and hence unusable.
| Quadrant | # 1 sec bins | Bins with >0 counts | Bins with >2000 counts | High rate bins dominated by noise | Noise dominated (total time) | Noise dominated (detector-on time) | Marked lightcurve |
|---|---|---|---|---|---|---|---|
| A | 8918 | 6810 | 1 | 1 | 0.01% | 0.01% | 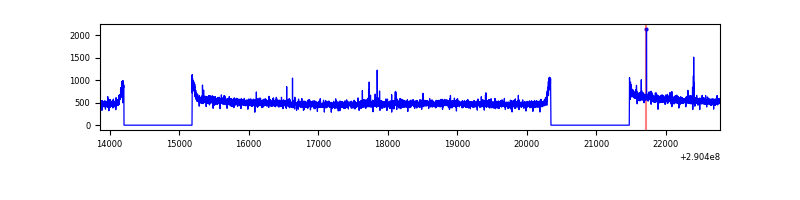 |
| B | 8918 | 6810 | 8 | 8 | 0.09% | 0.12% |  |
| C | 8918 | 6810 | 0 | 0 | 0.00% | 0.00% | 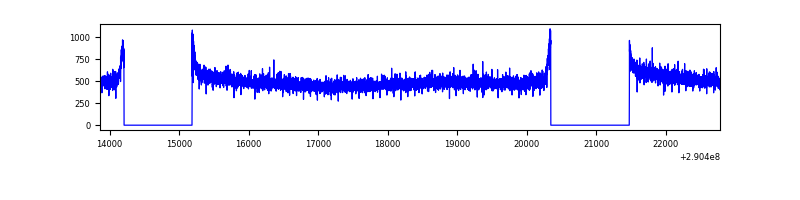 |
| D | 8919 | 6811 | 3 | 3 | 0.03% | 0.04% | 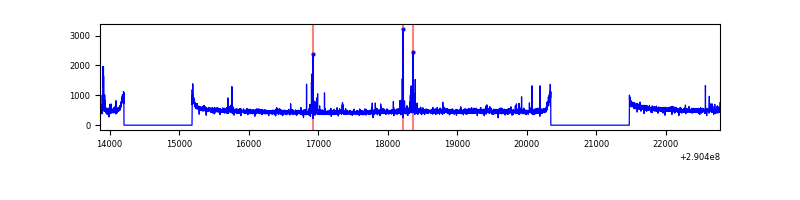 |
Top three noisy pixels from each quadrant. If the there are fewer than three noisy pixels in the level2.evt file, extra rows are filled as -1
| Pixel properties | Quadrant properties | ||||||
|---|---|---|---|---|---|---|---|
| Quadrant | DetID | PixID | Counts | Sigma | Mean | Median | Sigma |
| A | 15 | 192 | 15622 | 82.9 | 889 | 871 | 177.9 |
| A | 13 | 254 | 10757 | 55.56 | 889 | 871 | 177.9 |
| A | 0 | 13 | 10059 | 51.64 | 889 | 871 | 177.9 |
| B | 10 | 245 | 117808 | 694.13 | 881 | 860 | 168.5 |
| B | 3 | 64 | 24940 | 142.92 | 881 | 860 | 168.5 |
| B | 12 | 111 | 20119 | 114.31 | 881 | 860 | 168.5 |
| C | 14 | 238 | 131797 | 671.37 | 838 | 844 | 195.1 |
| C | 3 | 233 | 7765 | 35.48 | 838 | 844 | 195.1 |
| C | 13 | 61 | 5957 | 26.21 | 838 | 844 | 195.1 |
| D | 7 | 96 | 43850 | 203.56 | 855 | 829 | 211.3 |
| D | 10 | 70 | 29607 | 136.17 | 855 | 829 | 211.3 |
| D | 2 | 234 | 28160 | 129.32 | 855 | 829 | 211.3 |
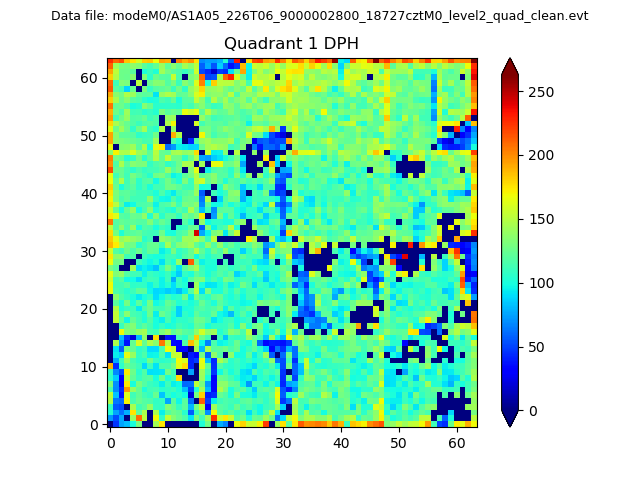
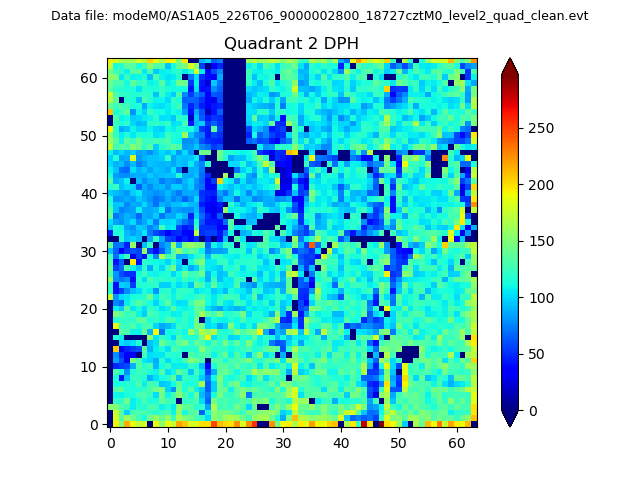
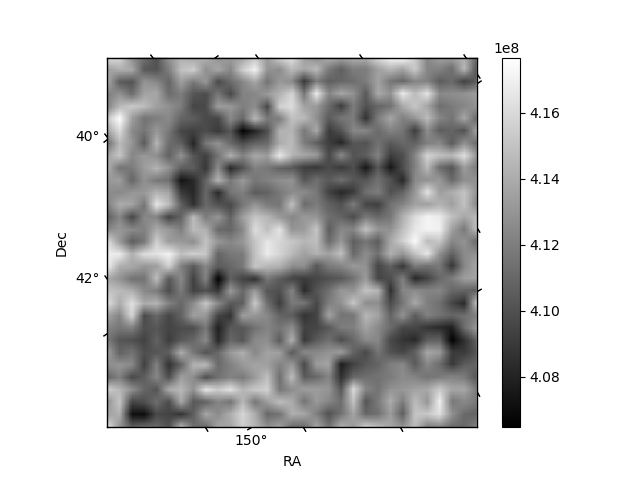
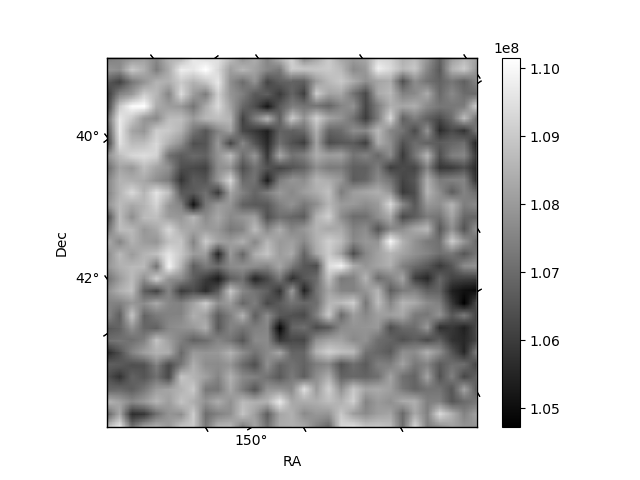
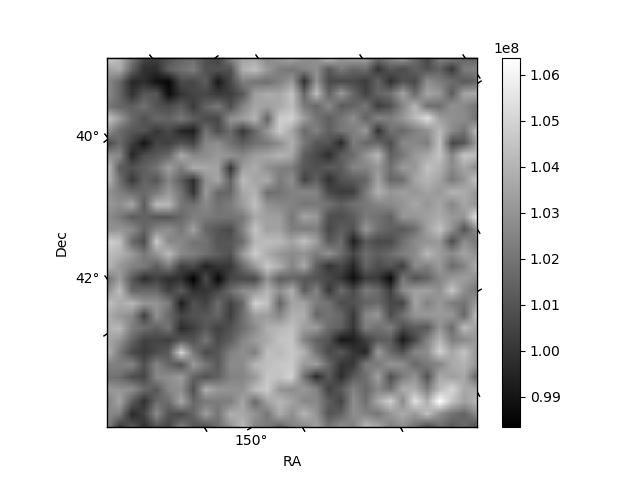
Histogram calculated using DETX and DETY for each event in the final _common_clean file
| Quadrant A | 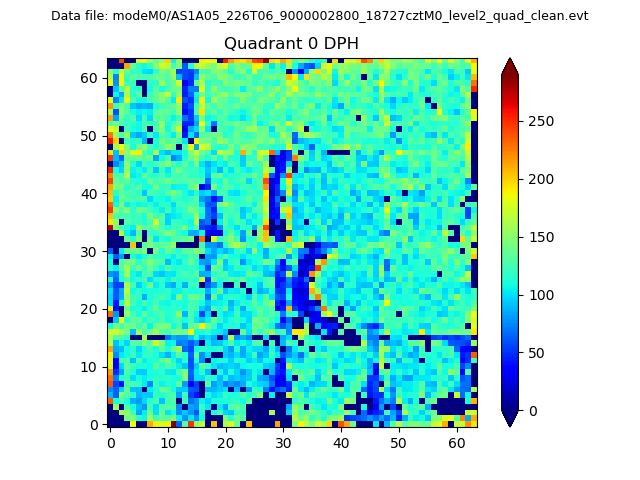 |
 |
Quadrant B |
|---|---|---|---|
| Quadrant D | 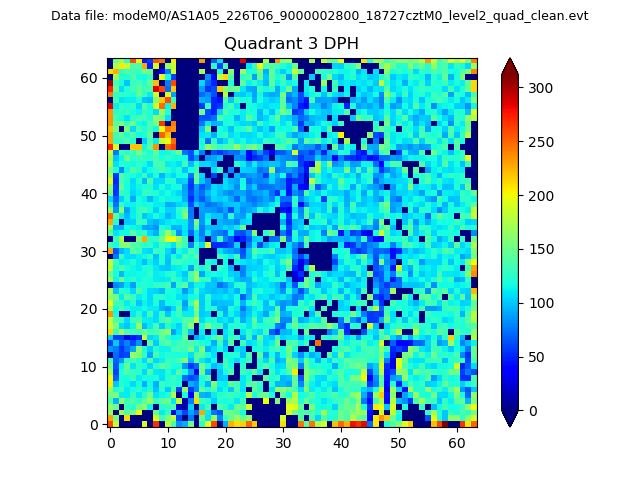 |
 |
Quadrant C |
| Plot type | Count rate plots | Images |
|---|---|---|
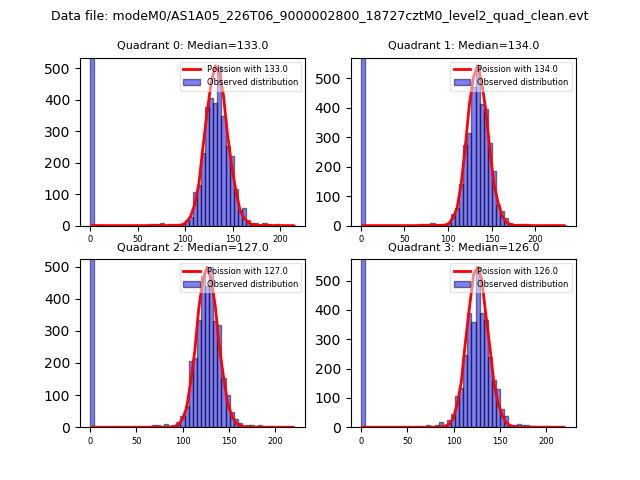
| Comparison with Poisson distribution Blue bars denote a histogram of data divided into 1 sec bins. Red curve is a Poisson curve with rate = median count rate of data. |
 |
 |
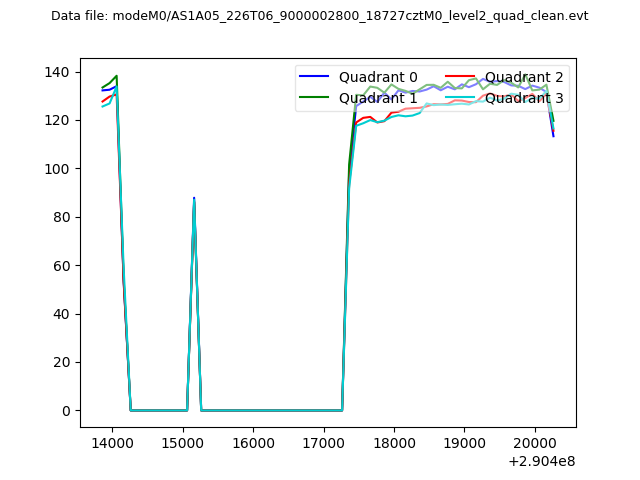
| Quadrant-wise count rates Data is divided into 100 sec bins |
 |
|
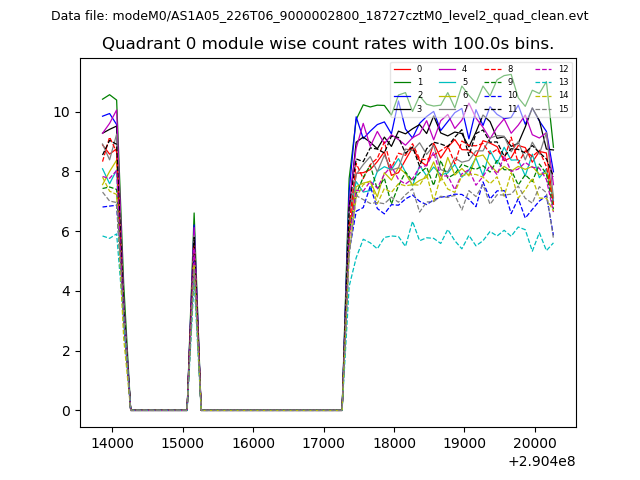
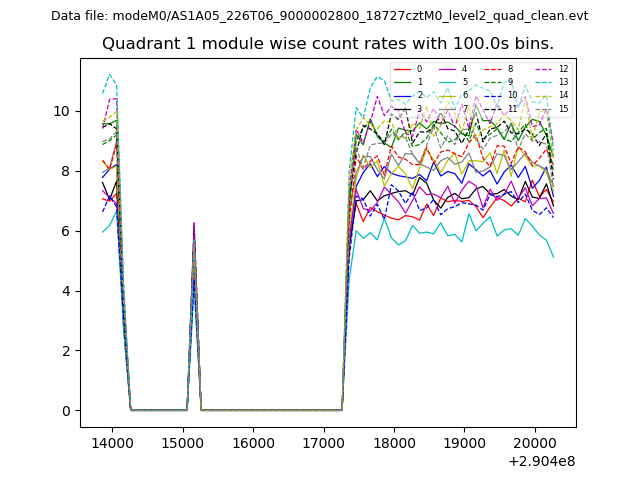
| Module-wise count rates for Quadrant A Data is divided into 100 sec bins |
 |
 |
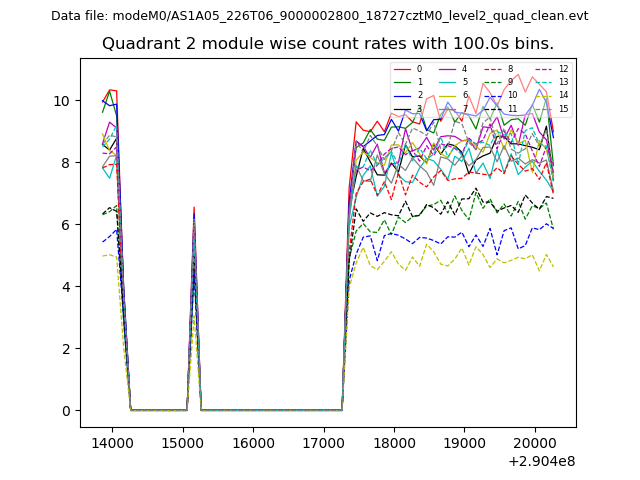
| Module-wise count rates for Quadrant B Data is divided into 100 sec bins |
 |
 |
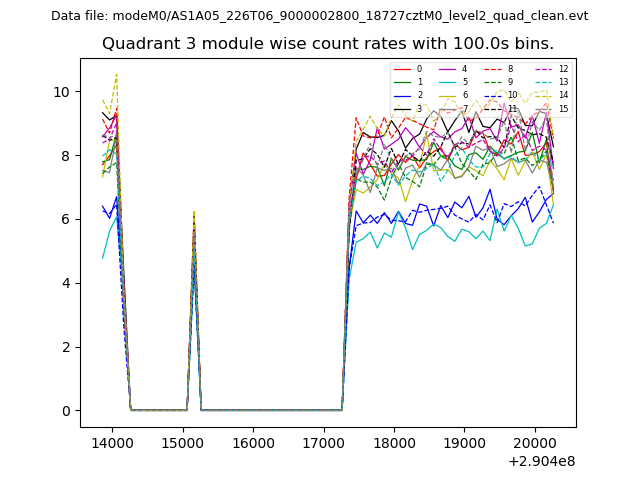
| Module-wise count rates for Quadrant C Data is divided into 100 sec bins |
 |
 |
| Module-wise count rates for Quadrant D Data is divided into 100 sec bins |
 |
 |
| Parameter | Plot |
|---|---|
| CZT HV Monitor | 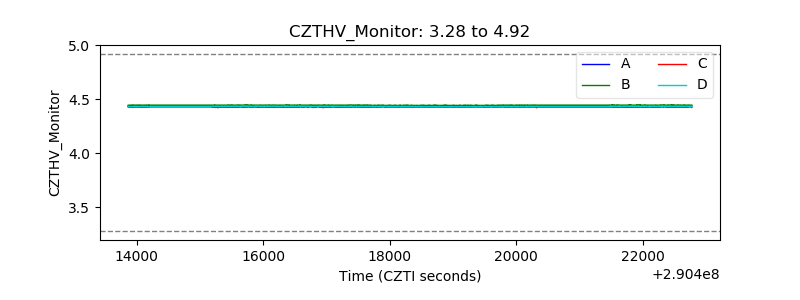 |
| D_VDD |  |
| Temperature 1 | 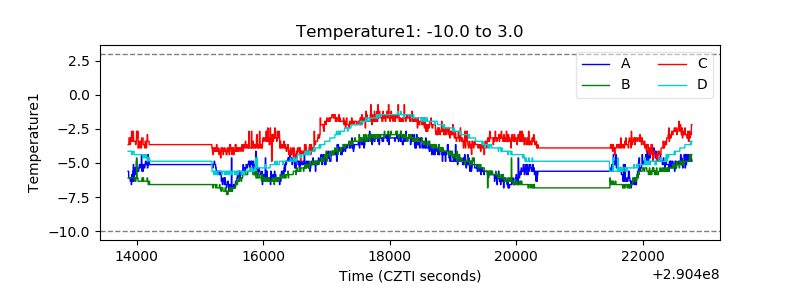 |
| Veto HV Monitor |  |
| Veto LLD | 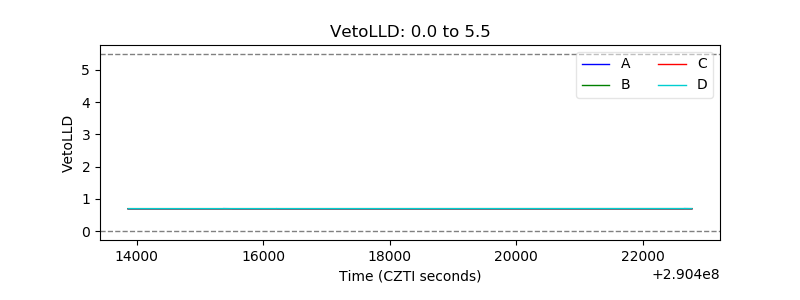 |
| Alpha Counter | 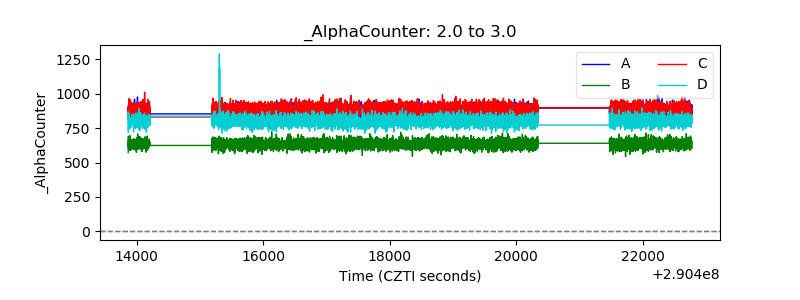 |
| _CPM_Rate | 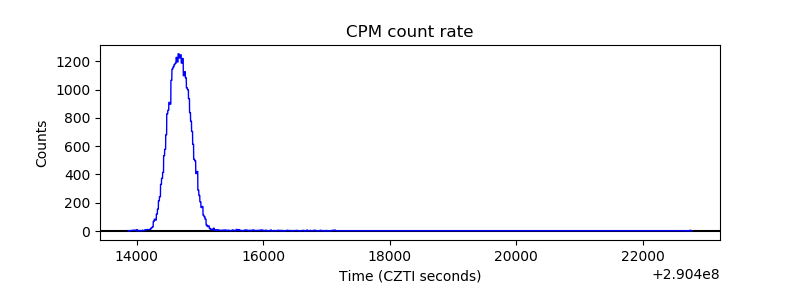 |
| CZT Counter | 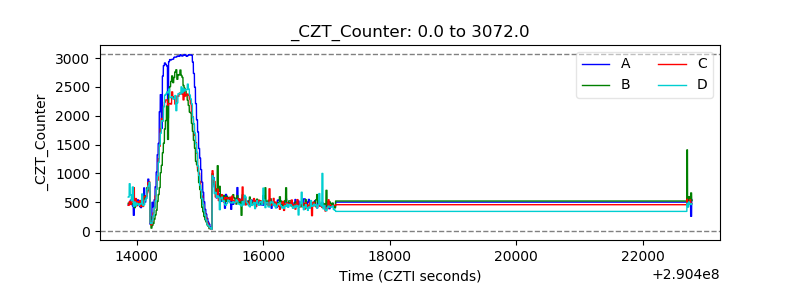 |
| +2.5 Volts monitor |  |
| +5 Volts monitor |  |
| _ROLL_ROT | 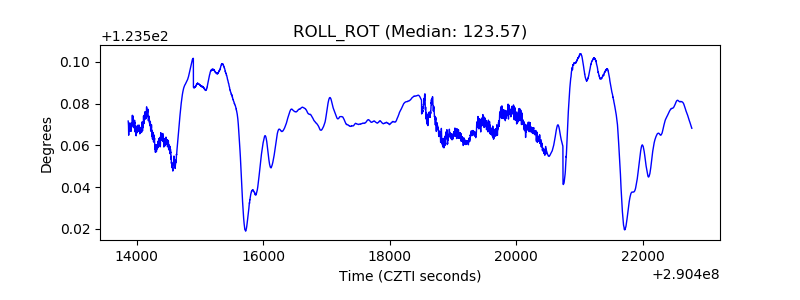 |
| _Roll_DEC | 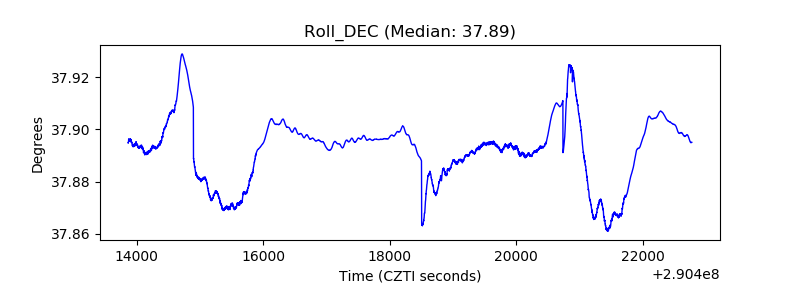 |
| _Roll_RA | 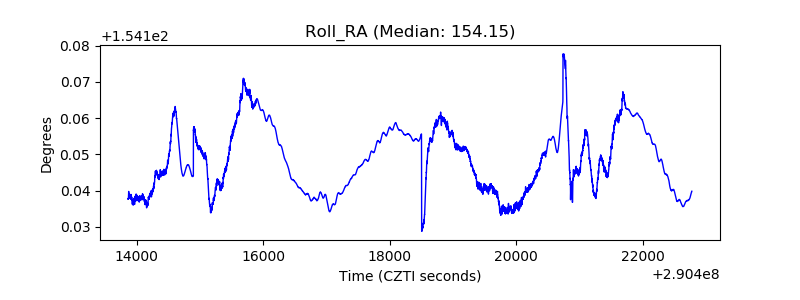 |
| Veto Counter | 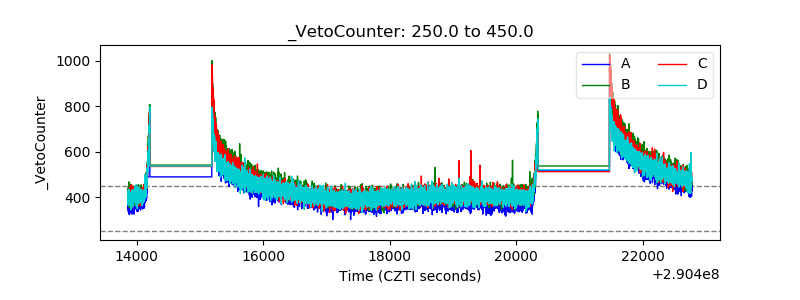 |