| Param | Original file | Final file |
|---|---|---|
| Filename | modeM0/AS1A05_226T06_9000002800_18728cztM0_level2.evt | modeM0/AS1A05_226T06_9000002800_18728cztM0_level2_quad_clean.evt |
| Size (bytes) | 520,678,080 | 77,950,080 |
| Size | 496.6 MB | 74.3 MB |
| Events in quadrant A | 3,581,047 | 489,579 |
| Events in quadrant B | 3,986,675 | 490,307 |
| Events in quadrant C | 4,281,589 | 457,716 |
| Events in quadrant D | 3,469,700 | 460,233 |
| Mode M9 | |||
|---|---|---|---|
| Quadrant | BADHDUFLAG | Total packets | Discarded packets |
| A | 0 | 17 | 0 |
| B | 0 | 18 | 0 |
| C | 0 | 18 | 0 |
| D | 0 | 18 | 0 |
| Mode M0 | |||
|---|---|---|---|
| Quadrant | BADHDUFLAG | Total packets | Discarded packets |
| A | 0 | 14706 | 2 |
| B | 0 | 16080 | 2 |
| C | 0 | 17041 | 2 |
| D | 0 | 14411 | 2 |
| Mode SS | |||
|---|---|---|---|
| Quadrant | BADHDUFLAG | Total packets | Discarded packets |
| A | 0 | 136 | 0 |
| B | 0 | 136 | 0 |
| C | 0 | 136 | 0 |
| D | 0 | 136 | 0 |
| Quadrant | Total seconds | Saturated seconds | Saturation percentage |
|---|---|---|---|
| A | 6629 | 90 | 1.357671% |
| B | 6629 | 181 | 2.730427% |
| C | 6629 | 168 | 2.534319% |
| D | 6629 | 96 | 1.448182% |
Noise dominated data is calculated using 1-second bins in cleaned event files. If a bin has >2000 counts, and if more than 50% of those come from <1% of pixels, then it is considered to be noise-dominated and hence unusable.
| Quadrant | # 1 sec bins | Bins with >0 counts | Bins with >2000 counts | High rate bins dominated by noise | Noise dominated (total time) | Noise dominated (detector-on time) | Marked lightcurve |
|---|---|---|---|---|---|---|---|
| A | 7819 | 6629 | 1 | 1 | 0.01% | 0.02% | 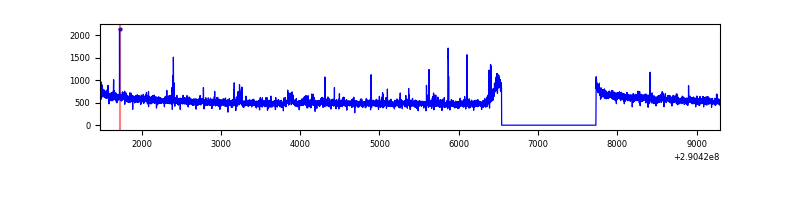 |
| B | 7819 | 6629 | 56 | 56 | 0.72% | 0.84% | 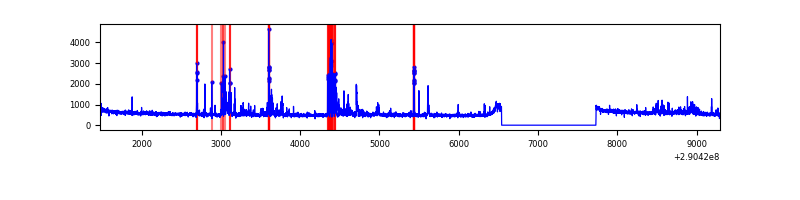 |
| C | 7819 | 6629 | 11 | 11 | 0.14% | 0.17% | 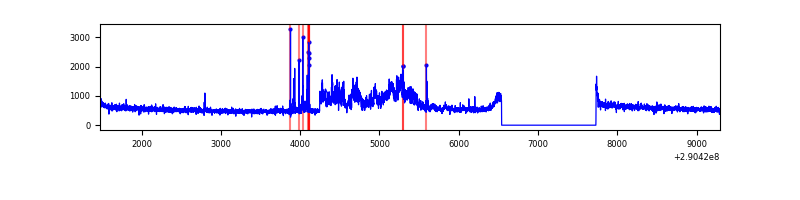 |
| D | 7819 | 6629 | 38 | 38 | 0.49% | 0.57% | 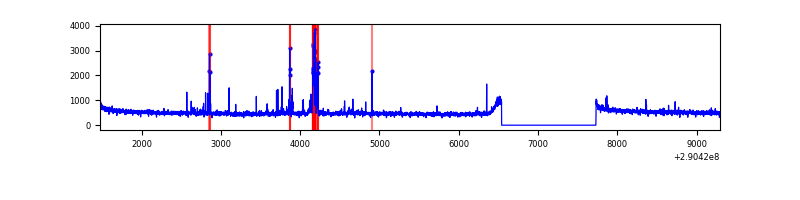 |
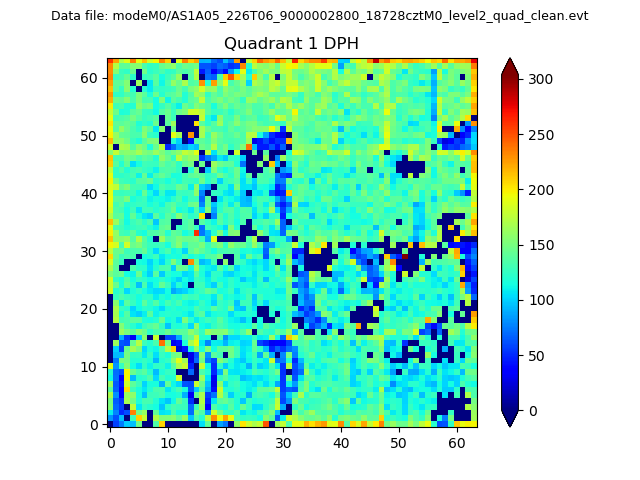
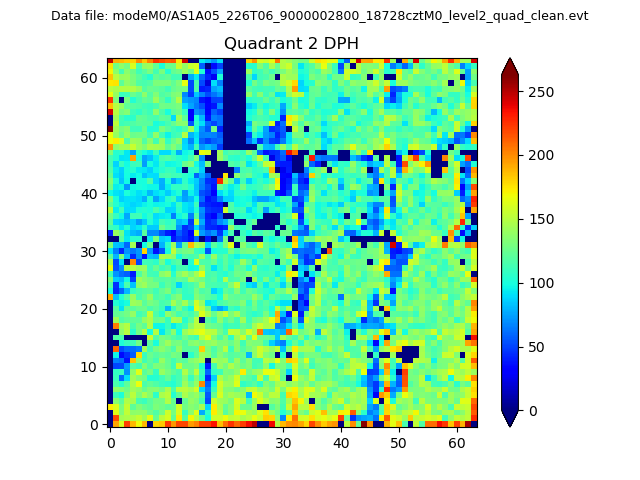
Top three noisy pixels from each quadrant. If the there are fewer than three noisy pixels in the level2.evt file, extra rows are filled as -1
| Pixel properties | Quadrant properties | ||||||
|---|---|---|---|---|---|---|---|
| Quadrant | DetID | PixID | Counts | Sigma | Mean | Median | Sigma |
| A | 15 | 192 | 34060 | 185.47 | 908 | 892 | 178.8 |
| A | 9 | 143 | 15390 | 81.07 | 908 | 892 | 178.8 |
| A | 14 | 111 | 12037 | 62.32 | 908 | 892 | 178.8 |
| B | 10 | 245 | 439148 | 2599.53 | 892 | 873 | 168.6 |
| B | 3 | 64 | 40448 | 234.73 | 892 | 873 | 168.6 |
| B | 12 | 111 | 19748 | 111.95 | 892 | 873 | 168.6 |
| C | 3 | 233 | 828806 | 4206.79 | 848 | 854 | 196.8 |
| C | 14 | 238 | 135224 | 682.73 | 848 | 854 | 196.8 |
| C | 0 | 207 | 14231 | 67.97 | 848 | 854 | 196.8 |
| D | 7 | 238 | 124458 | 596.91 | 866 | 843 | 207.1 |
| D | 10 | 70 | 47467 | 225.14 | 866 | 843 | 207.1 |
| D | 2 | 234 | 25986 | 121.41 | 866 | 843 | 207.1 |
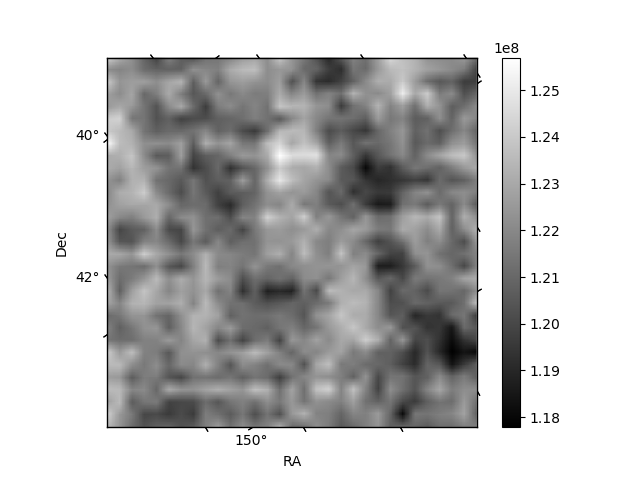
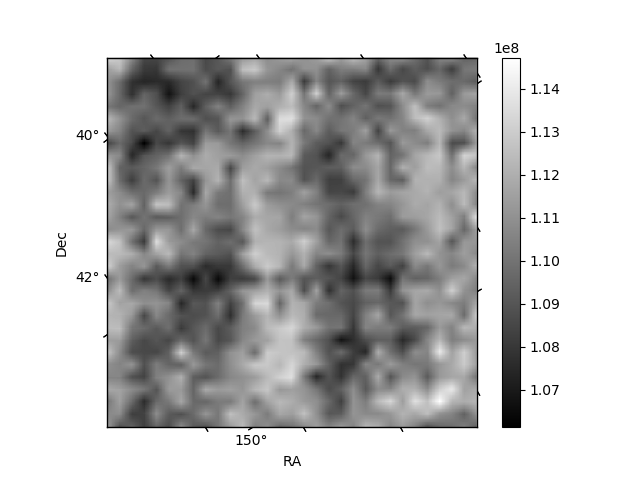
Histogram calculated using DETX and DETY for each event in the final _common_clean file
| Quadrant A | 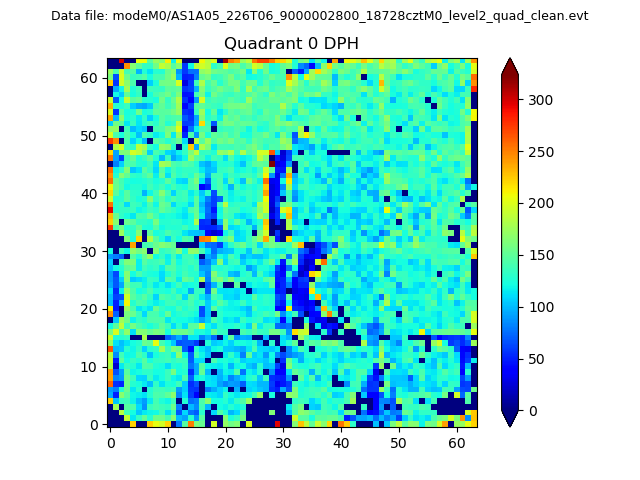 |
 |
Quadrant B |
|---|---|---|---|
| Quadrant D | 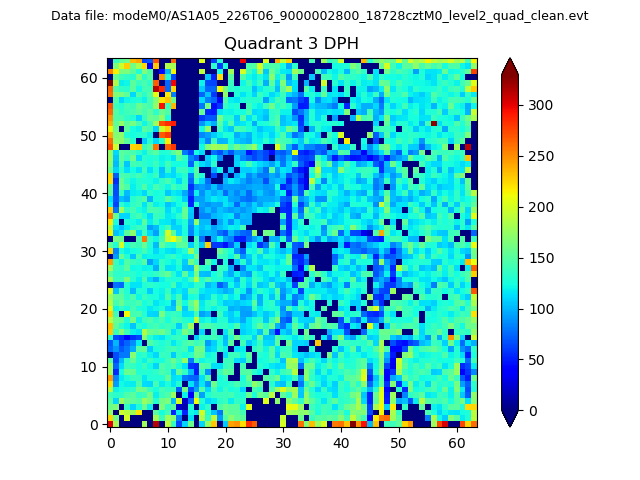 |
 |
Quadrant C |
| Plot type | Count rate plots | Images |
|---|---|---|
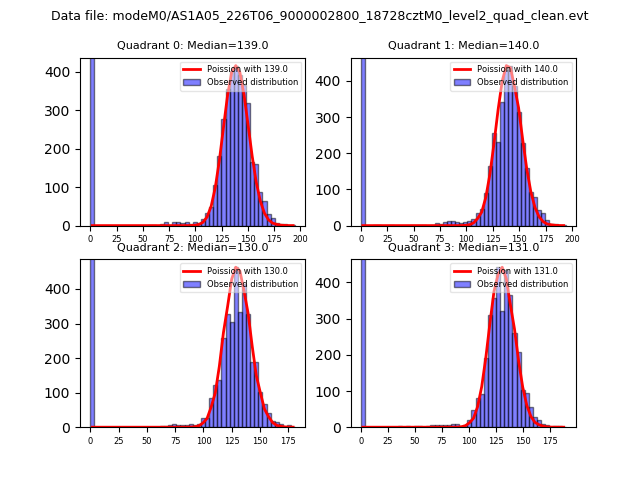
| Comparison with Poisson distribution Blue bars denote a histogram of data divided into 1 sec bins. Red curve is a Poisson curve with rate = median count rate of data. |
 |
 |
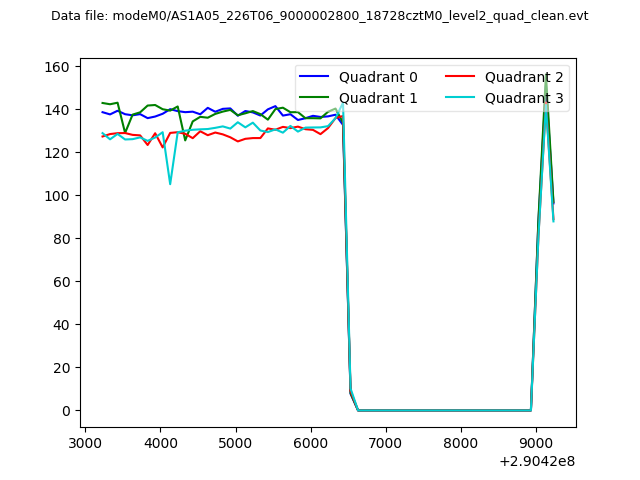
| Quadrant-wise count rates Data is divided into 100 sec bins |
 |
|
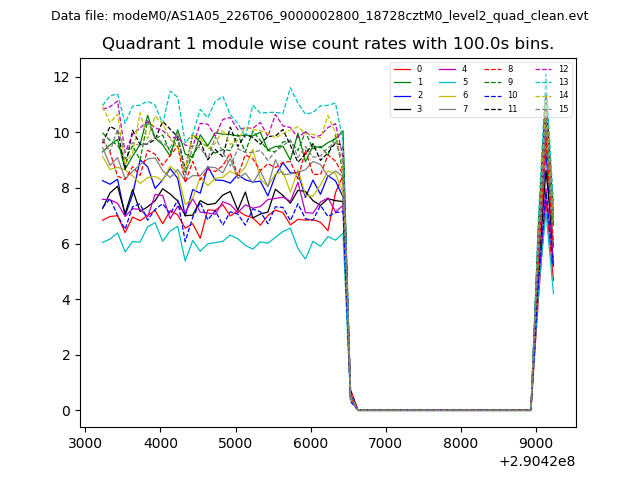
| Module-wise count rates for Quadrant A Data is divided into 100 sec bins |
 |
 |
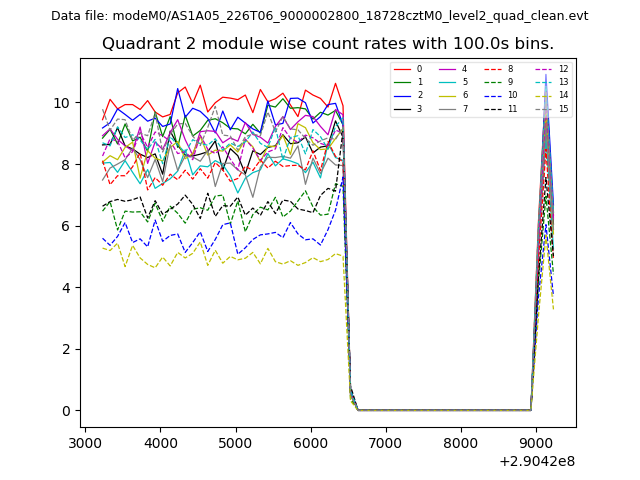
| Module-wise count rates for Quadrant B Data is divided into 100 sec bins |
 |
 |
| Module-wise count rates for Quadrant C Data is divided into 100 sec bins |
 |
 |
| Module-wise count rates for Quadrant D Data is divided into 100 sec bins |
 |
 |
| Parameter | Plot |
|---|---|
| CZT HV Monitor | 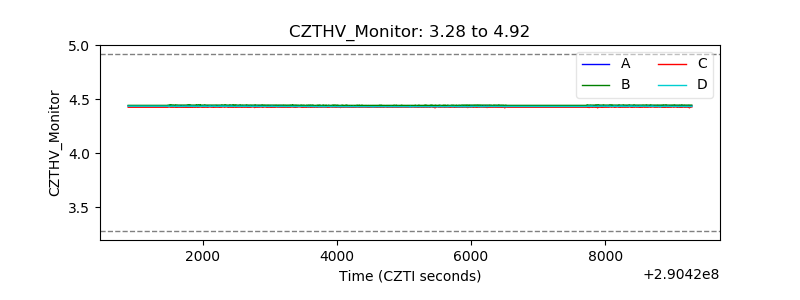 |
| D_VDD | 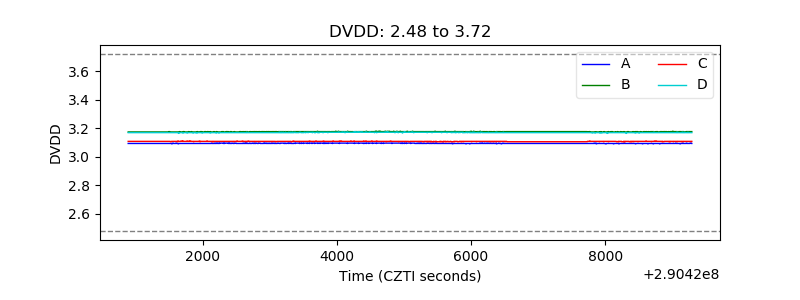 |
| Temperature 1 |  |
| Veto HV Monitor | 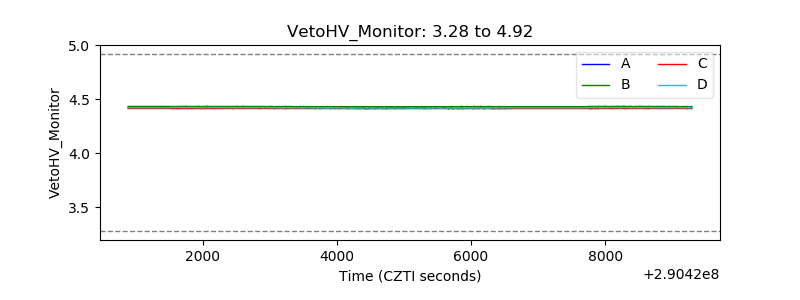 |
| Veto LLD | 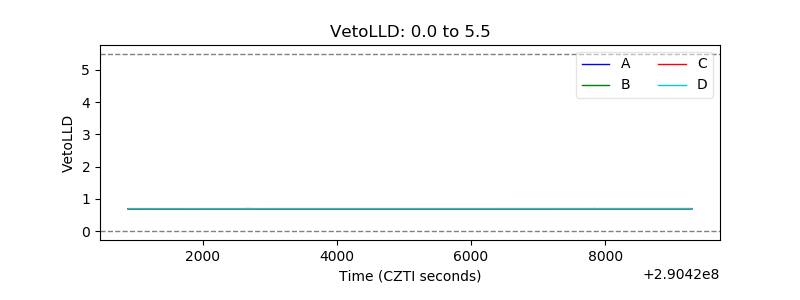 |
| Alpha Counter | 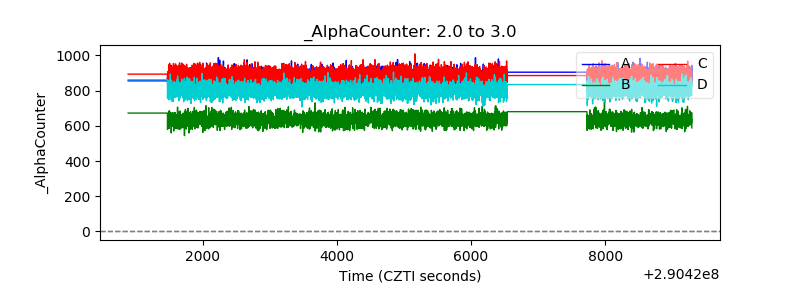 |
| _CPM_Rate | 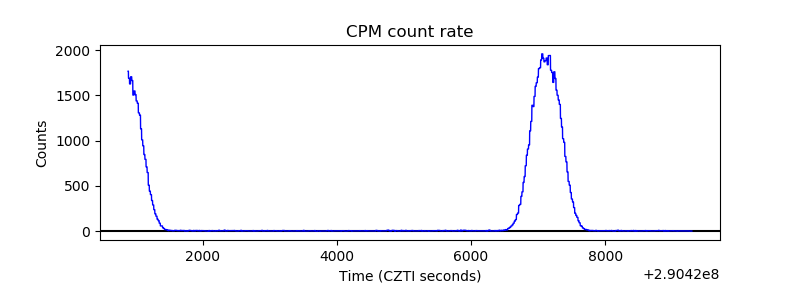 |
| CZT Counter | 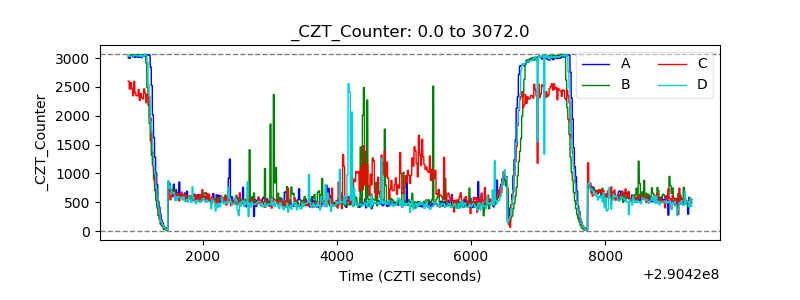 |
| +2.5 Volts monitor |  |
| +5 Volts monitor |  |
| _ROLL_ROT |  |
| _Roll_DEC | 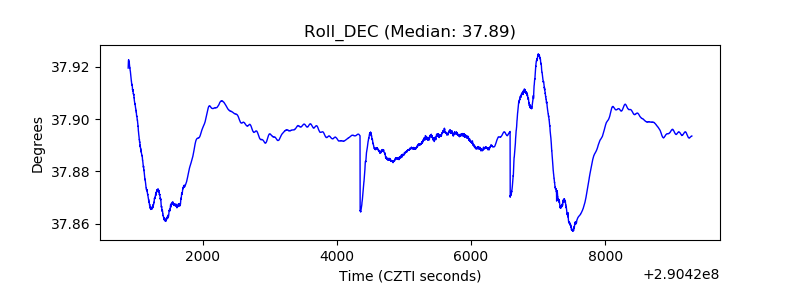 |
| _Roll_RA | 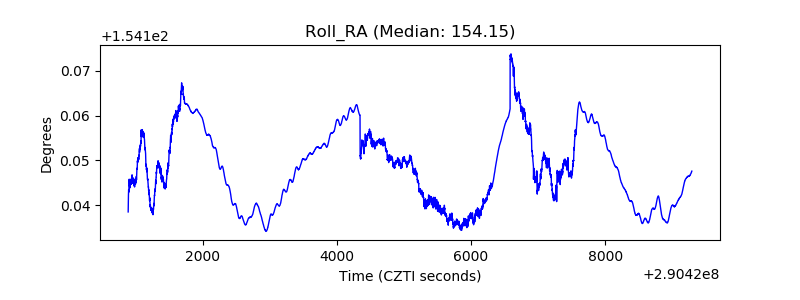 |
| Veto Counter |  |