| Param | Original file | Final file |
|---|---|---|
| Filename | modeM0/AS1A05_226T06_9000002800_18729cztM0_level2.evt | modeM0/AS1A05_226T06_9000002800_18729cztM0_level2_quad_clean.evt |
| Size (bytes) | 239,224,320 | 47,796,480 |
| Size | 228.1 MB | 45.6 MB |
| Events in quadrant A | 1,706,042 | 316,878 |
| Events in quadrant B | 1,937,269 | 315,882 |
| Events in quadrant C | 1,754,522 | 292,144 |
| Events in quadrant D | 1,624,928 | 291,532 |
| Mode M0 | |||
|---|---|---|---|
| Quadrant | BADHDUFLAG | Total packets | Discarded packets |
| A | 0 | 6942 | 0 |
| B | 0 | 7832 | 0 |
| C | 0 | 7146 | 0 |
| D | 0 | 6702 | 0 |
| Mode SS | |||
|---|---|---|---|
| Quadrant | BADHDUFLAG | Total packets | Discarded packets |
| A | 0 | 66 | 0 |
| B | 0 | 66 | 0 |
| C | 0 | 66 | 0 |
| D | 0 | 66 | 0 |
| Quadrant | Total seconds | Saturated seconds | Saturation percentage |
|---|---|---|---|
| A | 3242 | 3 | 0.092535% |
| B | 3243 | 12 | 0.370028% |
| C | 3243 | 20 | 0.616713% |
| D | 3243 | 10 | 0.308356% |
Noise dominated data is calculated using 1-second bins in cleaned event files. If a bin has >2000 counts, and if more than 50% of those come from <1% of pixels, then it is considered to be noise-dominated and hence unusable.
| Quadrant | # 1 sec bins | Bins with >0 counts | Bins with >2000 counts | High rate bins dominated by noise | Noise dominated (total time) | Noise dominated (detector-on time) | Marked lightcurve |
|---|---|---|---|---|---|---|---|
| A | 3242 | 3242 | 1 | 1 | 0.03% | 0.03% | 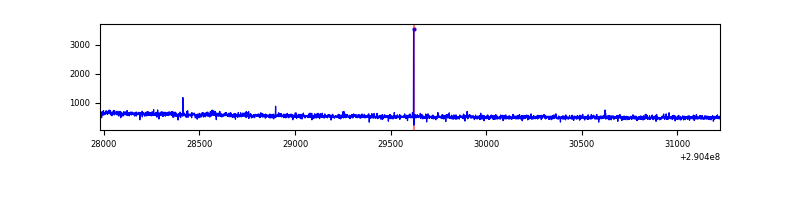 |
| B | 3243 | 3243 | 6 | 6 | 0.19% | 0.19% | 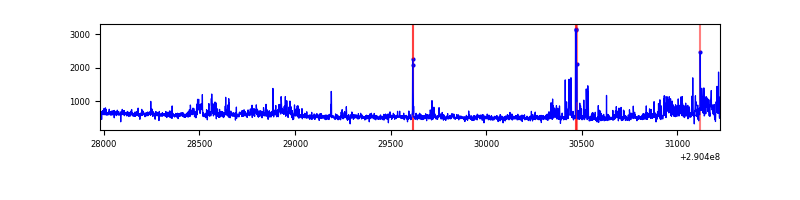 |
| C | 3243 | 3243 | 7 | 7 | 0.22% | 0.22% | 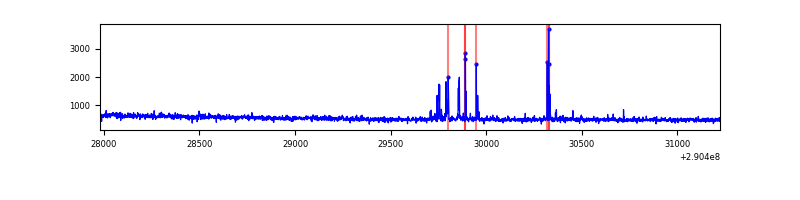 |
| D | 3243 | 3243 | 7 | 7 | 0.22% | 0.22% | 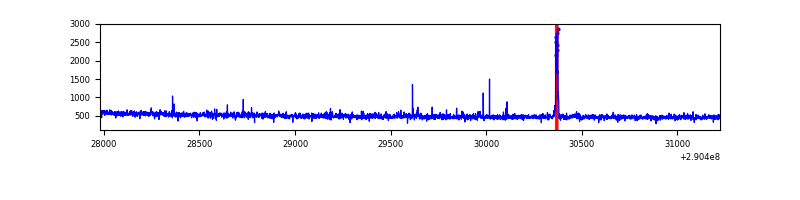 |
Top three noisy pixels from each quadrant. If the there are fewer than three noisy pixels in the level2.evt file, extra rows are filled as -1
| Pixel properties | Quadrant properties | ||||||
|---|---|---|---|---|---|---|---|
| Quadrant | DetID | PixID | Counts | Sigma | Mean | Median | Sigma |
| A | 11 | 29 | 8377 | 89.62 | 438 | 431 | 88.7 |
| A | 9 | 143 | 5718 | 59.63 | 438 | 431 | 88.7 |
| A | 13 | 254 | 5237 | 54.2 | 438 | 431 | 88.7 |
| B | 10 | 245 | 245485 | 3051.35 | 429 | 420 | 80.3 |
| B | 12 | 111 | 9153 | 108.74 | 429 | 420 | 80.3 |
| B | 11 | 111 | 8153 | 96.28 | 429 | 420 | 80.3 |
| C | 14 | 238 | 65902 | 692.7 | 408 | 412 | 94.5 |
| C | 0 | 207 | 65158 | 684.83 | 408 | 412 | 94.5 |
| C | 3 | 233 | 31077 | 324.35 | 408 | 412 | 94.5 |
| D | 10 | 70 | 32456 | 314.94 | 419 | 408 | 101.8 |
| D | 2 | 234 | 14174 | 135.28 | 419 | 408 | 101.8 |
| D | 7 | 96 | 6908 | 63.88 | 419 | 408 | 101.8 |
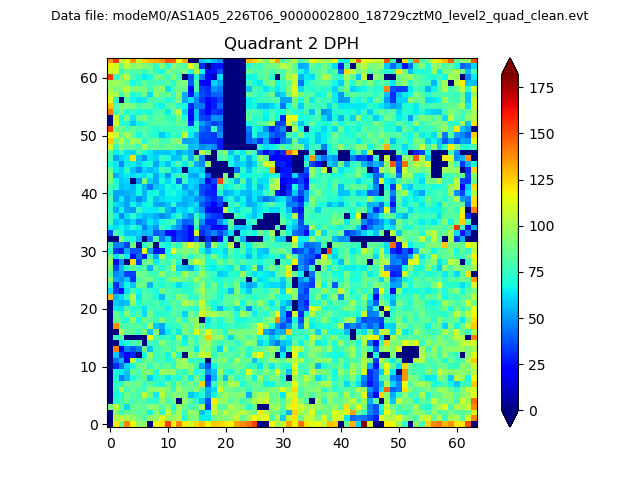
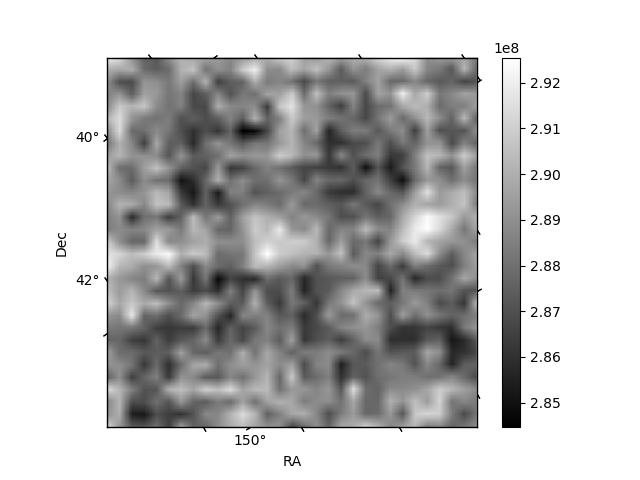
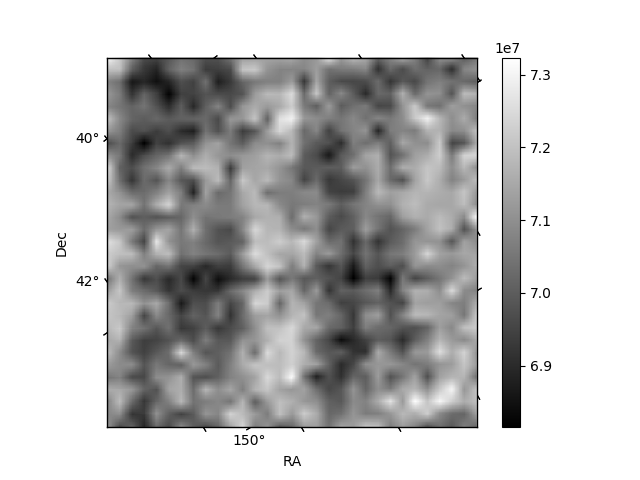
Histogram calculated using DETX and DETY for each event in the final _common_clean file
| Quadrant A | 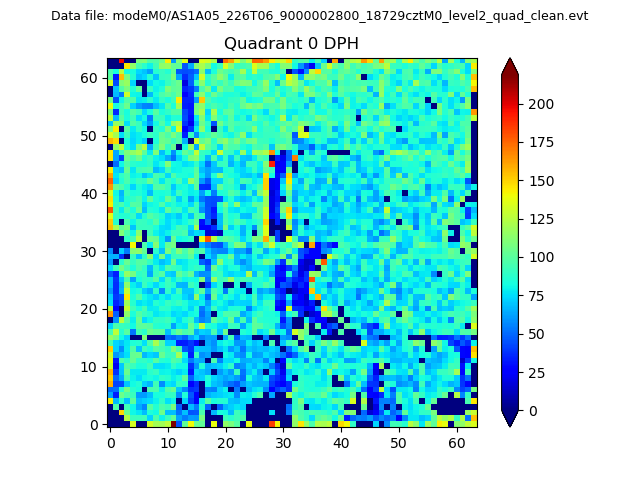 |
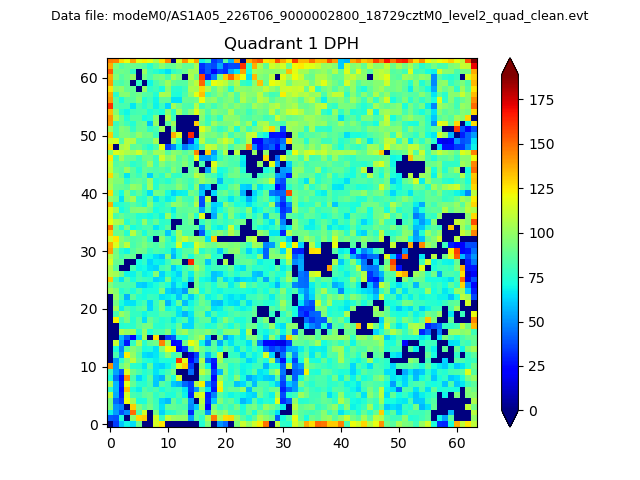 |
Quadrant B |
|---|---|---|---|
| Quadrant D | 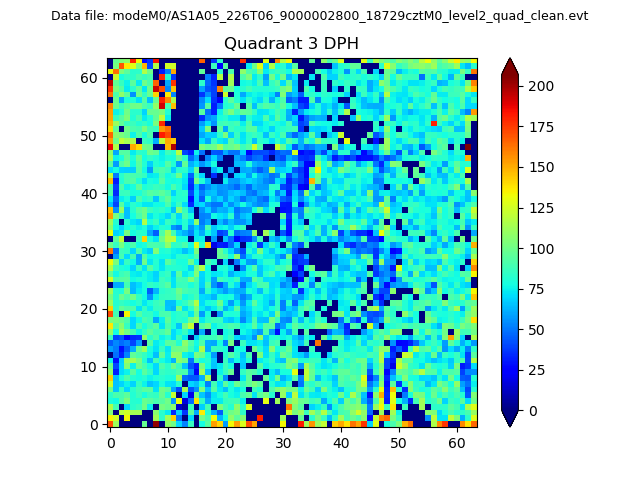 |
 |
Quadrant C |
| Plot type | Count rate plots | Images |
|---|---|---|
| Comparison with Poisson distribution Blue bars denote a histogram of data divided into 1 sec bins. Red curve is a Poisson curve with rate = median count rate of data. |
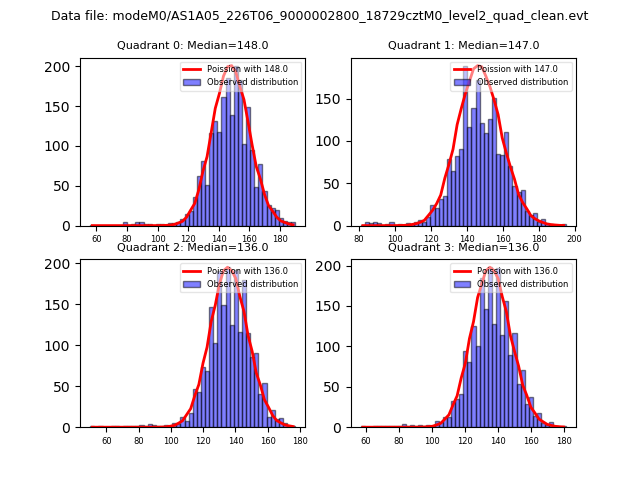 |
 |
| Quadrant-wise count rates Data is divided into 100 sec bins |
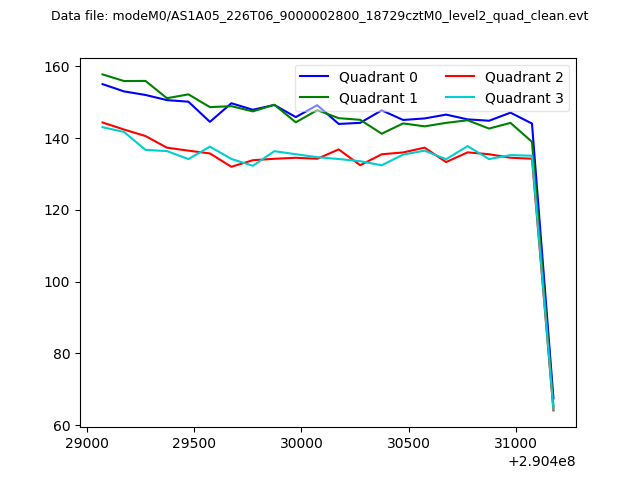 |
|
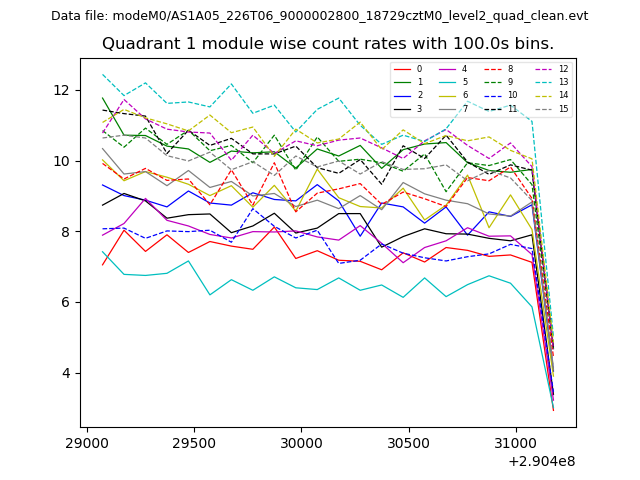
| Module-wise count rates for Quadrant A Data is divided into 100 sec bins |
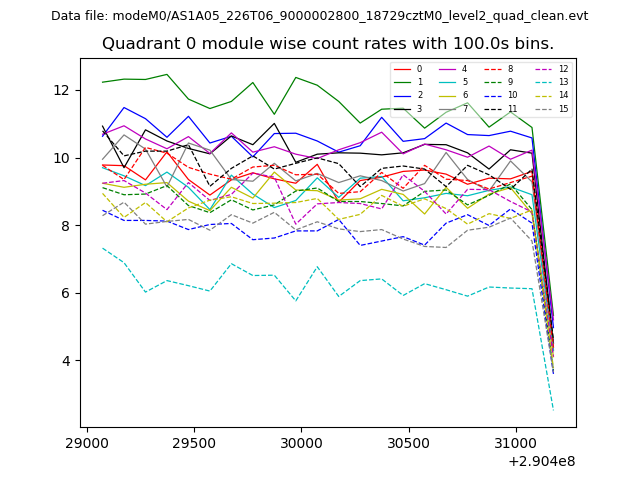 |
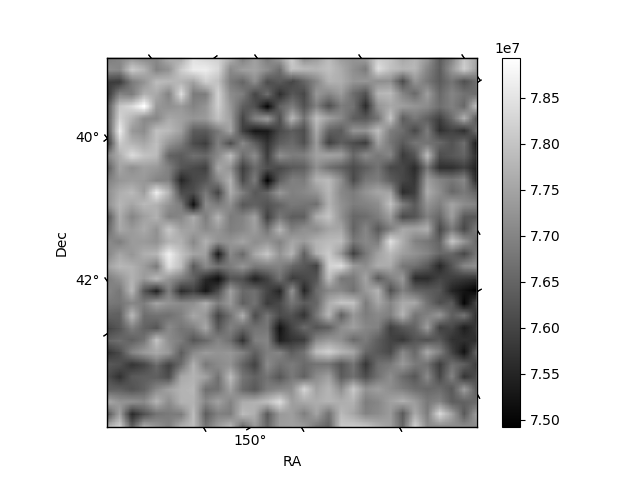 |
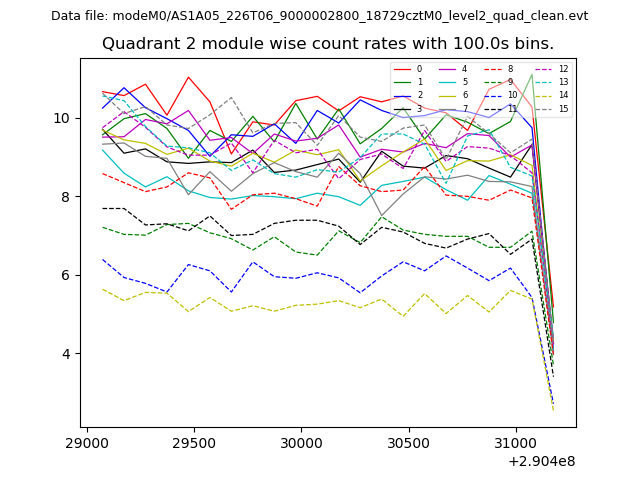
| Module-wise count rates for Quadrant B Data is divided into 100 sec bins |
 |
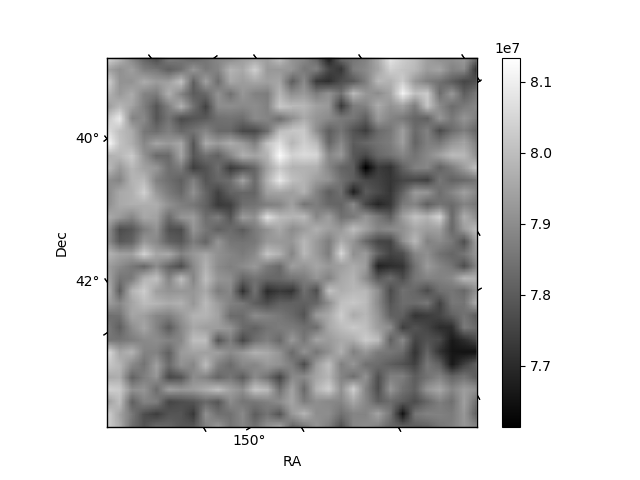 |
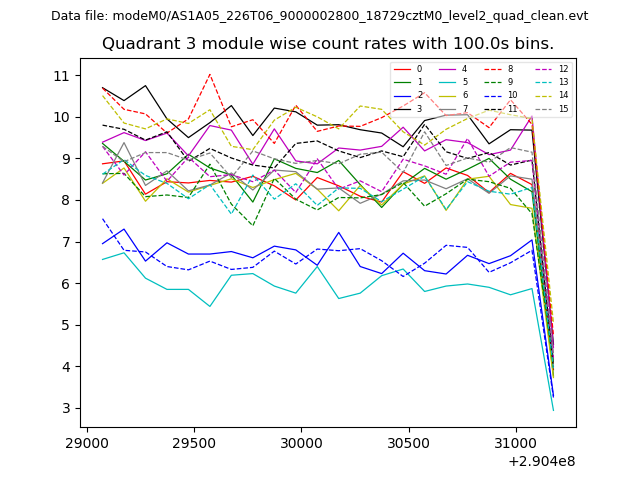
| Module-wise count rates for Quadrant C Data is divided into 100 sec bins |
 |
 |
| Module-wise count rates for Quadrant D Data is divided into 100 sec bins |
 |
 |
| Parameter | Plot |
|---|---|
| CZT HV Monitor | 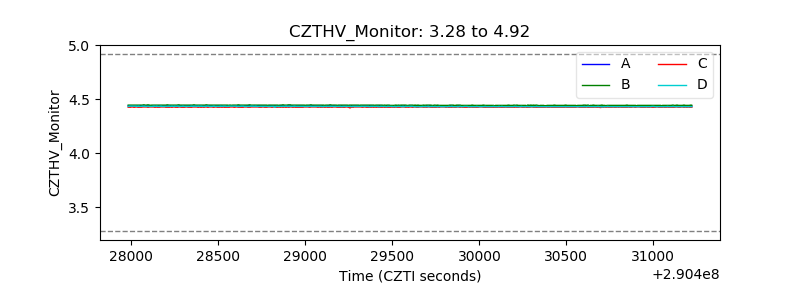 |
| D_VDD | 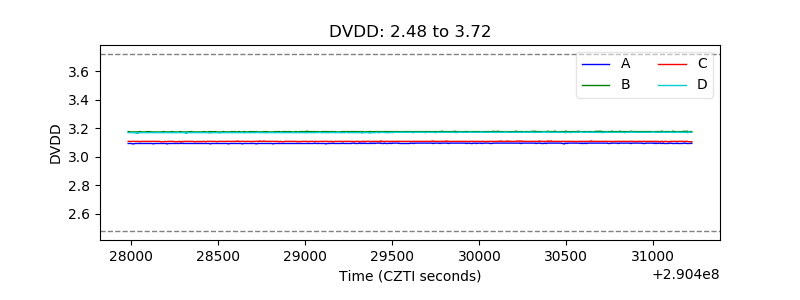 |
| Temperature 1 |  |
| Veto HV Monitor | 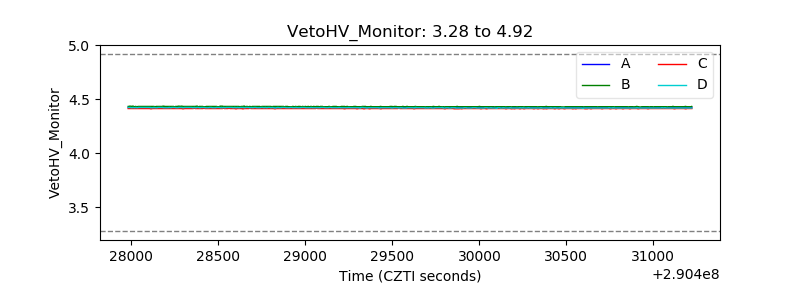 |
| Veto LLD | 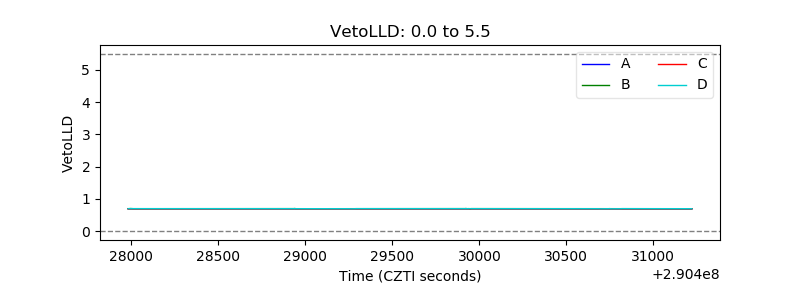 |
| Alpha Counter | 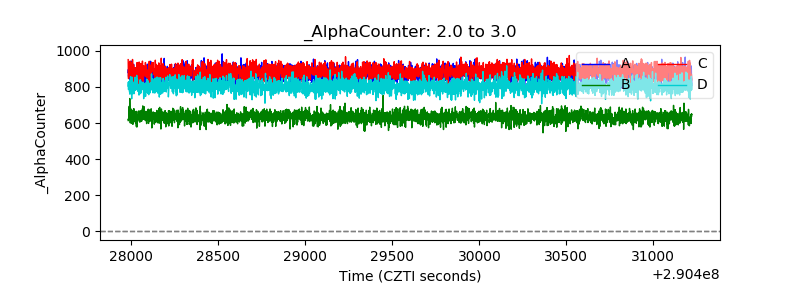 |
| _CPM_Rate | 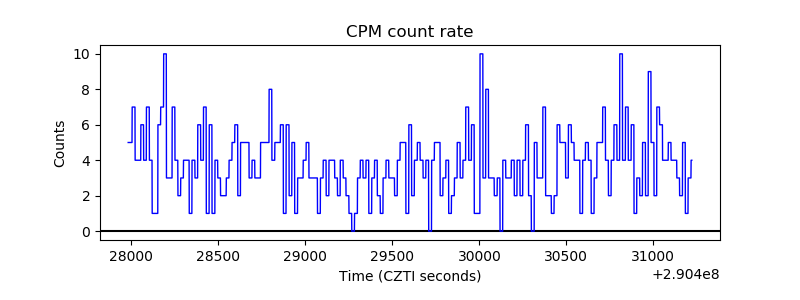 |
| CZT Counter | 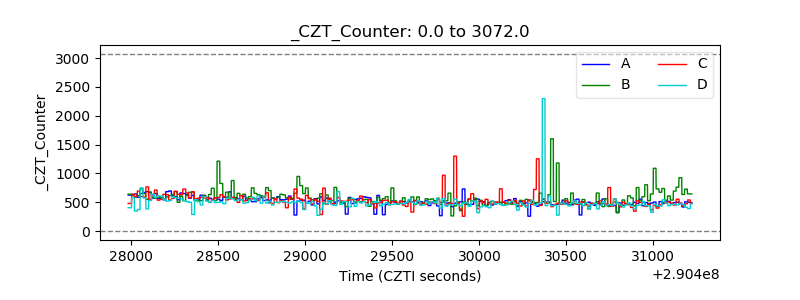 |
| +2.5 Volts monitor |  |
| +5 Volts monitor |  |
| _ROLL_ROT | 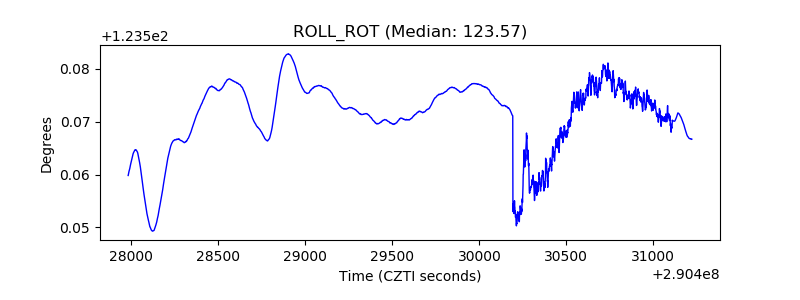 |
| _Roll_DEC | 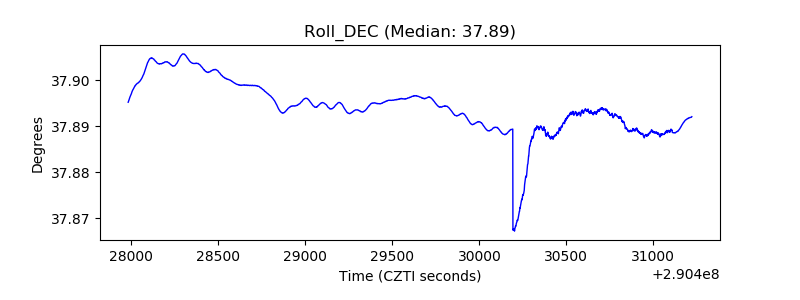 |
| _Roll_RA | 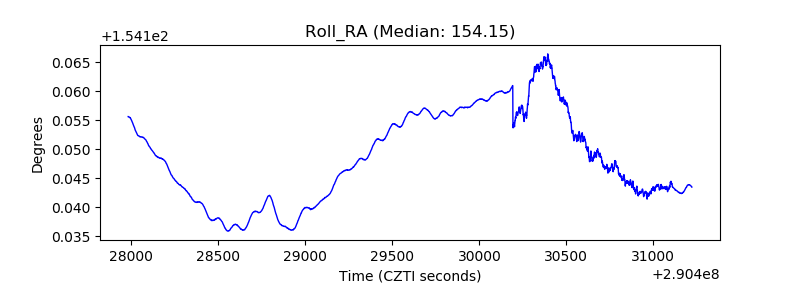 |
| Veto Counter | 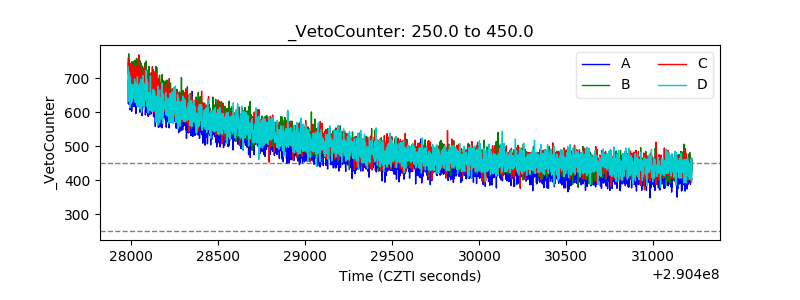 |