| Param | Original file | Final file |
|---|---|---|
| Filename | modeM0/AS1A05_156T01_9000002804cztM0_level2.fits | modeM0/AS1A05_156T01_9000002804cztM0_level2_quad_clean.evt |
| Size (bytes) | 743,296,320 | 695,980,800 |
| Size | 708.9 MB | 663.7 MB |
| Events in quadrant A | 4,584,516 | 4,133,063 |
| Events in quadrant B | 4,383,508 | 4,132,614 |
| Events in quadrant C | 4,467,636 | 3,973,234 |
| Events in quadrant D | 3,938,804 | 3,702,241 |
| Mode M0 | |||
|---|---|---|---|
| Quadrant | BADHDUFLAG | Total packets | Discarded packets |
| A | 0 | 157602 | 0 |
| B | 0 | 160867 | 0 |
| C | 0 | 161001 | 0 |
| D | 0 | 168437 | 0 |
| Mode M9 | |||
|---|---|---|---|
| Quadrant | BADHDUFLAG | Total packets | Discarded packets |
| A | 0 | 124 | 0 |
| B | 0 | 124 | 0 |
| C | 0 | 124 | 0 |
| D | 0 | 124 | 0 |
| Mode SS | |||
|---|---|---|---|
| Quadrant | BADHDUFLAG | Total packets | Discarded packets |
| A | 0 | 1458 | 0 |
| B | 0 | 1458 | 0 |
| C | 0 | 1458 | 0 |
| D | 0 | 1458 | 0 |
| Quadrant | Total seconds | Saturated seconds | Saturation percentage |
|---|---|---|---|
| A | 75146 | 757 | 1.007372% |
| B | 75146 | 1146 | 1.525031% |
| C | 75146 | 1369 | 1.821787% |
| D | 75146 | 1133 | 1.507732% |
Noise dominated data is calculated using 1-second bins in cleaned event files. If a bin has >2000 counts, and if more than 50% of those come from <1% of pixels, then it is considered to be noise-dominated and hence unusable.
| Quadrant | # 1 sec bins | Bins with >0 counts | Bins with >2000 counts | High rate bins dominated by noise | Noise dominated (total time) | Noise dominated (detector-on time) | Marked lightcurve |
|---|---|---|---|---|---|---|---|
| A | 87467 | 75145 | 0 | 0 | 0.00% | 0.00% |  |
| B | 87467 | 75146 | 0 | 0 | 0.00% | 0.00% |  |
| C | 87467 | 75144 | 0 | 0 | 0.00% | 0.00% |  |
| D | 87467 | 75143 | 0 | 0 | 0.00% | 0.00% |  |
Top three noisy pixels from each quadrant. If the there are fewer than three noisy pixels in the level2.evt file, extra rows are filled as -1
| Pixel properties | Quadrant properties | ||||||
|---|---|---|---|---|---|---|---|
| Quadrant | DetID | PixID | Counts | Sigma | Mean | Median | Sigma |
| A | 0 | 29 | 4326 | 10.93 | 1194 | 1120 | 293.4 |
| A | 7 | 110 | 3591 | 8.42 | 1194 | 1120 | 293.4 |
| A | 9 | 19 | 3467 | 8.0 | 1194 | 1120 | 293.4 |
| B | 2 | 9 | 3602 | 10.97 | 1158 | 1105 | 227.7 |
| B | 2 | 8 | 3034 | 8.47 | 1158 | 1105 | 227.7 |
| B | 5 | 128 | 2865 | 7.73 | 1158 | 1105 | 227.7 |
| C | 1 | 80 | 3334 | 7.44 | 1178 | 1102 | 300.0 |
| C | 1 | 81 | 3317 | 7.38 | 1178 | 1102 | 300.0 |
| C | 12 | 241 | 3087 | 6.62 | 1178 | 1102 | 300.0 |
| D | 10 | 190 | 2959 | 6.56 | 1123 | 1025 | 294.8 |
| D | 3 | 14 | 2837 | 6.15 | 1123 | 1025 | 294.8 |
| D | 10 | 189 | 2745 | 5.84 | 1123 | 1025 | 294.8 |
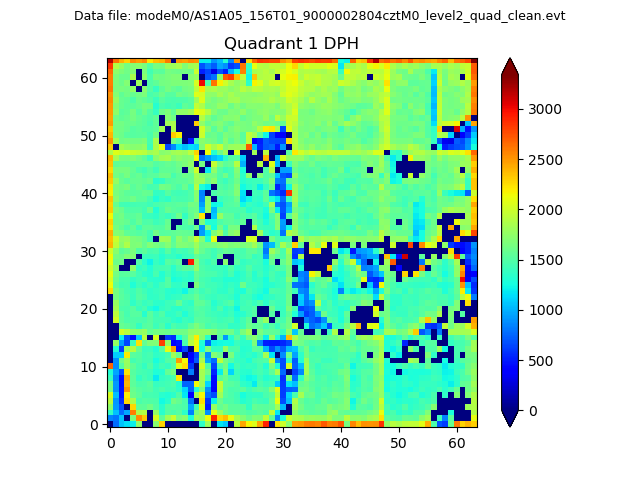
Histogram calculated using DETX and DETY for each event in the final _common_clean file
| Quadrant A |  |
 |
Quadrant B |
|---|---|---|---|
| Quadrant D |  |
 |
Quadrant C |
| Plot type | Count rate plots | Images |
|---|---|---|
| Comparison with Poisson distribution Blue bars denote a histogram of data divided into 1 sec bins. Red curve is a Poisson curve with rate = median count rate of data. |
 |
 |
| Quadrant-wise count rates Data is divided into 100 sec bins |
 |
|
| Module-wise count rates for Quadrant A Data is divided into 100 sec bins |
 |
 |
| Module-wise count rates for Quadrant B Data is divided into 100 sec bins |
 |
 |
| Module-wise count rates for Quadrant C Data is divided into 100 sec bins |
 |
 |
| Module-wise count rates for Quadrant D Data is divided into 100 sec bins |
 |
 |
| Parameter | Plot |
|---|---|
| CZT HV Monitor |  |
| D_VDD |  |
| Temperature 1 |  |
| Veto HV Monitor |  |
| Veto LLD |  |
| Alpha Counter |  |
| _CPM_Rate |  |
| CZT Counter |  |
| +2.5 Volts monitor |  |
| +5 Volts monitor |  |
| _ROLL_ROT |  |
| _Roll_DEC |  |
| _Roll_RA |  |
| Veto Counter |  |