| Param | Original file | Final file |
|---|---|---|
| Filename | modeM0/AS1A05_156T01_9000002804_18746cztM0_level2.evt | modeM0/AS1A05_156T01_9000002804_18746cztM0_level2_quad_clean.evt |
| Size (bytes) | 460,373,760 | 89,400,960 |
| Size | 439.0 MB | 85.3 MB |
| Events in quadrant A | 3,352,427 | 571,237 |
| Events in quadrant B | 3,295,688 | 577,413 |
| Events in quadrant C | 3,473,730 | 557,361 |
| Events in quadrant D | 3,384,703 | 553,914 |
| Mode M0 | |||
|---|---|---|---|
| Quadrant | BADHDUFLAG | Total packets | Discarded packets |
| A | 0 | 14099 | 2 |
| B | 0 | 13748 | 2 |
| C | 0 | 14296 | 2 |
| D | 0 | 14137 | 2 |
| Mode M9 | |||
|---|---|---|---|
| Quadrant | BADHDUFLAG | Total packets | Discarded packets |
| A | 0 | 18 | 0 |
| B | 0 | 19 | 0 |
| C | 0 | 19 | 0 |
| D | 0 | 19 | 0 |
| Mode SS | |||
|---|---|---|---|
| Quadrant | BADHDUFLAG | Total packets | Discarded packets |
| A | 0 | 130 | 0 |
| B | 0 | 130 | 0 |
| C | 0 | 130 | 0 |
| D | 0 | 130 | 0 |
| Quadrant | Total seconds | Saturated seconds | Saturation percentage |
|---|---|---|---|
| A | 6414 | 105 | 1.637044% |
| B | 6414 | 123 | 1.917680% |
| C | 6414 | 162 | 2.525725% |
| D | 6414 | 105 | 1.637044% |
Noise dominated data is calculated using 1-second bins in cleaned event files. If a bin has >2000 counts, and if more than 50% of those come from <1% of pixels, then it is considered to be noise-dominated and hence unusable.
| Quadrant | # 1 sec bins | Bins with >0 counts | Bins with >2000 counts | High rate bins dominated by noise | Noise dominated (total time) | Noise dominated (detector-on time) | Marked lightcurve |
|---|---|---|---|---|---|---|---|
| A | 7549 | 6415 | 0 | 0 | 0.00% | 0.00% | 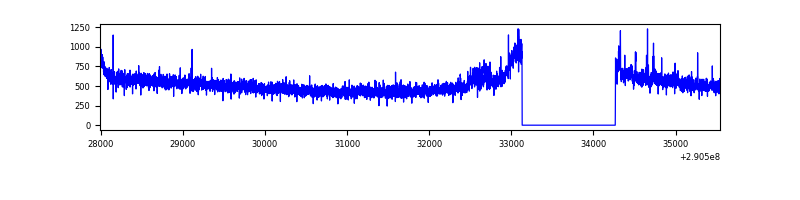 |
| B | 7549 | 6415 | 1 | 1 | 0.01% | 0.02% | 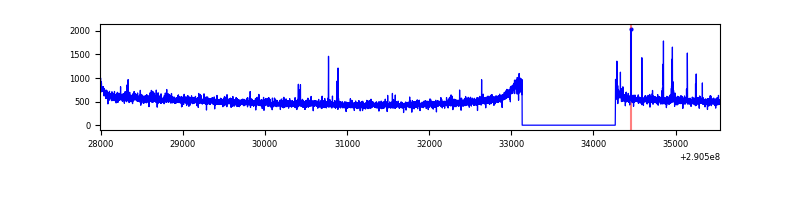 |
| C | 7549 | 6415 | 1 | 1 | 0.01% | 0.02% | 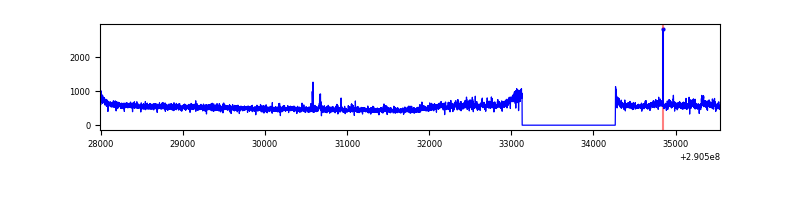 |
| D | 7549 | 6415 | 4 | 4 | 0.05% | 0.06% | 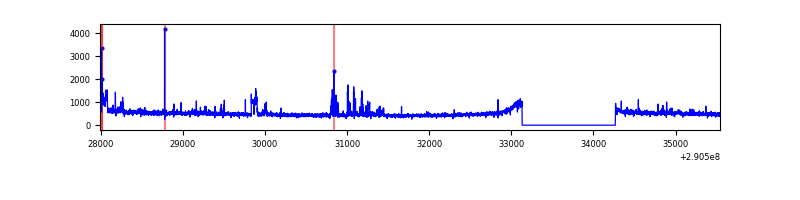 |
Top three noisy pixels from each quadrant. If the there are fewer than three noisy pixels in the level2.evt file, extra rows are filled as -1
| Pixel properties | Quadrant properties | ||||||
|---|---|---|---|---|---|---|---|
| Quadrant | DetID | PixID | Counts | Sigma | Mean | Median | Sigma |
| A | 15 | 192 | 99382 | 590.02 | 837 | 823 | 167.0 |
| A | 15 | 191 | 17130 | 97.62 | 837 | 823 | 167.0 |
| A | 13 | 254 | 10444 | 57.6 | 837 | 823 | 167.0 |
| B | 12 | 111 | 18648 | 113.33 | 831 | 812 | 157.4 |
| B | 11 | 111 | 16216 | 97.88 | 831 | 812 | 157.4 |
| B | 14 | 111 | 13982 | 83.68 | 831 | 812 | 157.4 |
| C | 3 | 233 | 190618 | 1017.9 | 806 | 811 | 186.5 |
| C | 14 | 238 | 126324 | 673.1 | 806 | 811 | 186.5 |
| C | 9 | 54 | 16471 | 83.98 | 806 | 811 | 186.5 |
| D | 14 | 34 | 102531 | 511.76 | 821 | 796 | 198.8 |
| D | 7 | 38 | 44192 | 218.29 | 821 | 796 | 198.8 |
| D | 13 | 168 | 44020 | 217.43 | 821 | 796 | 198.8 |
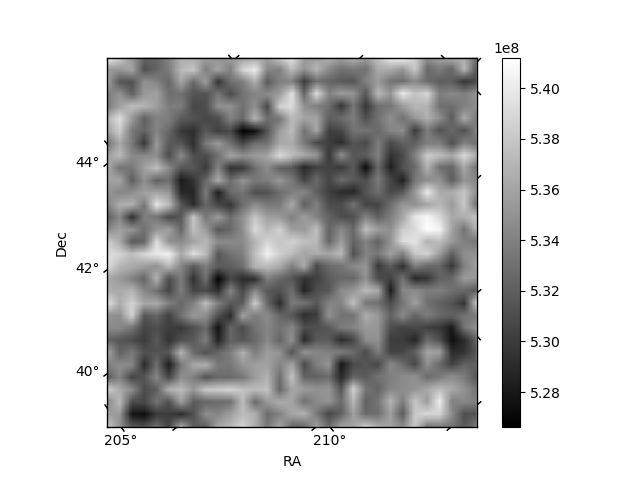
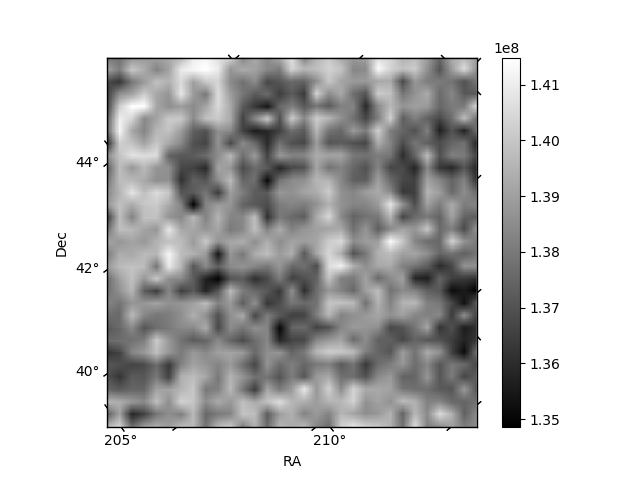
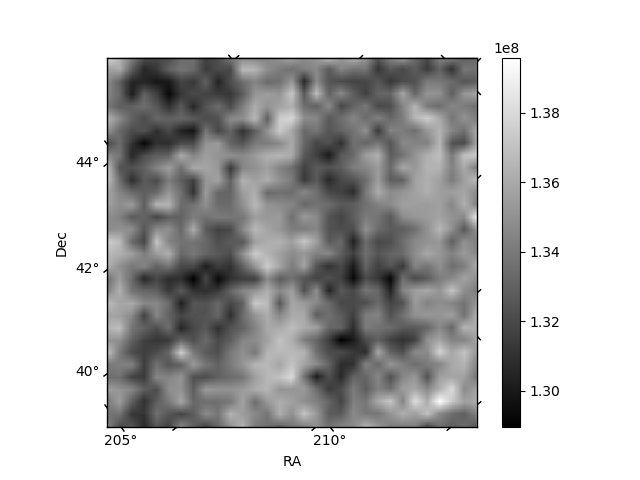
Histogram calculated using DETX and DETY for each event in the final _common_clean file
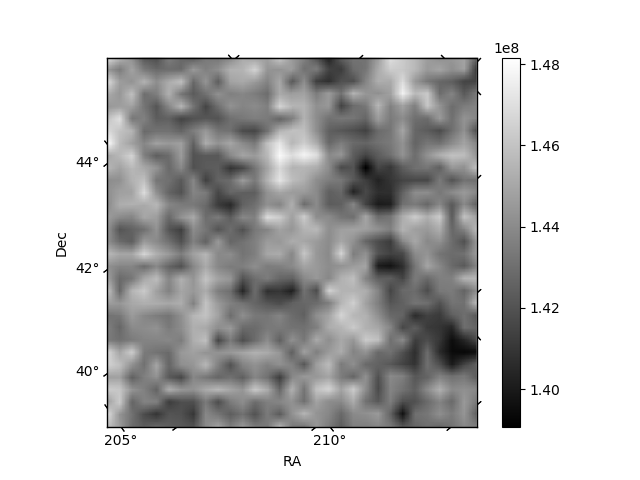
| Quadrant A | 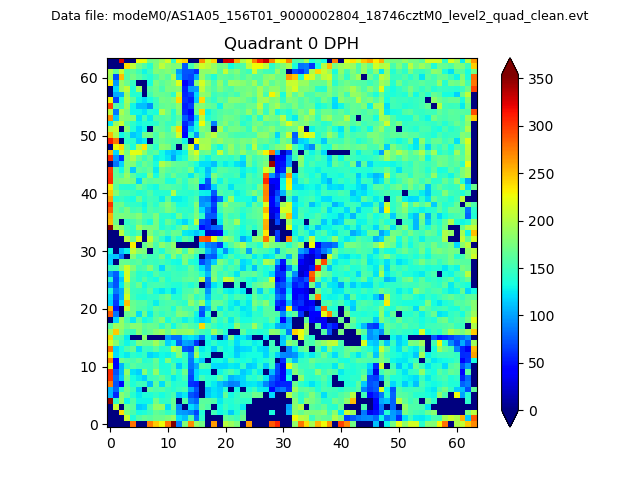 |
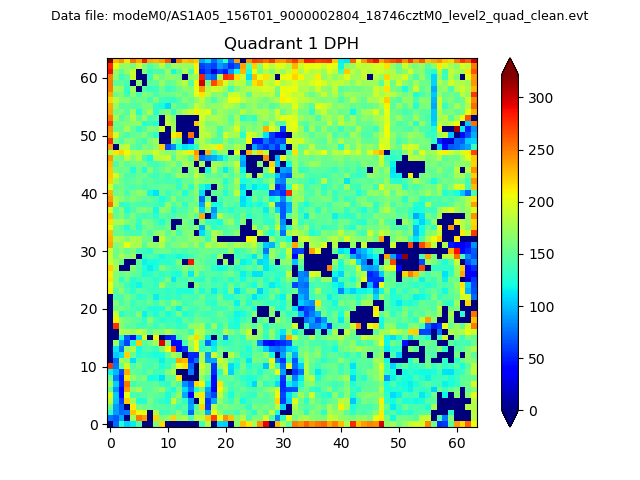 |
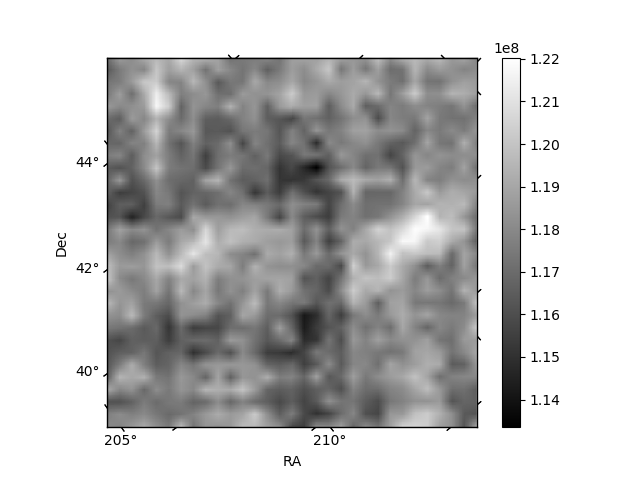
Quadrant B |
|---|---|---|---|
| Quadrant D |  |
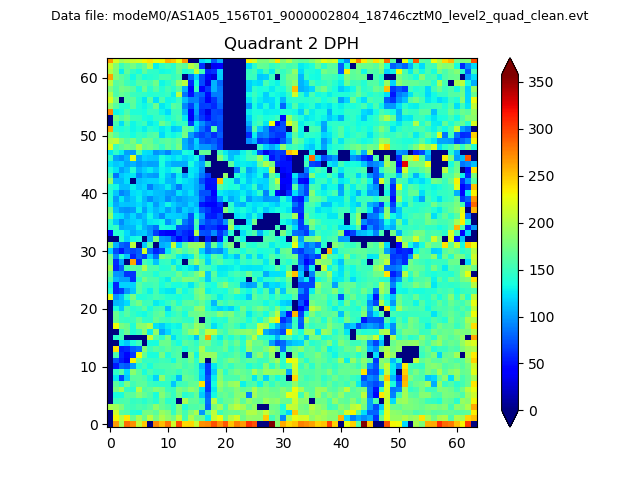 |
Quadrant C |
| Plot type | Count rate plots | Images |
|---|---|---|
| Comparison with Poisson distribution Blue bars denote a histogram of data divided into 1 sec bins. Red curve is a Poisson curve with rate = median count rate of data. |
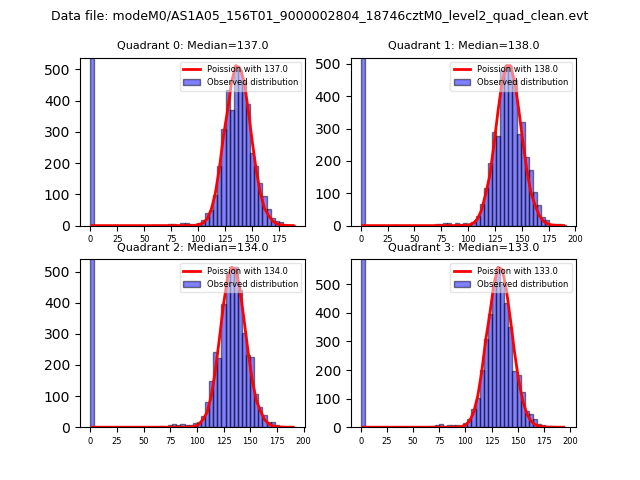 |
 |
| Quadrant-wise count rates Data is divided into 100 sec bins |
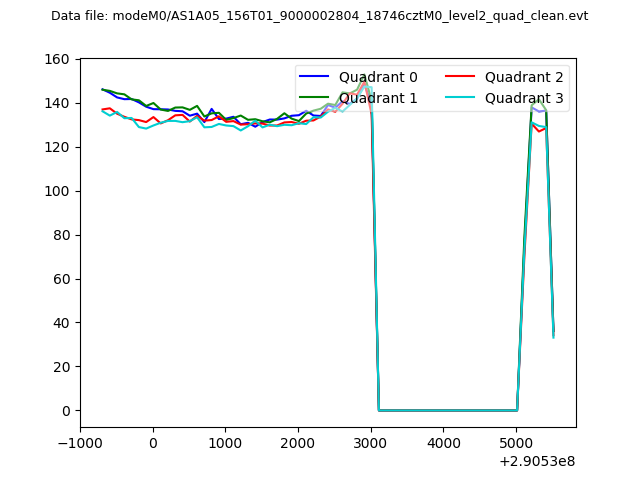 |
|
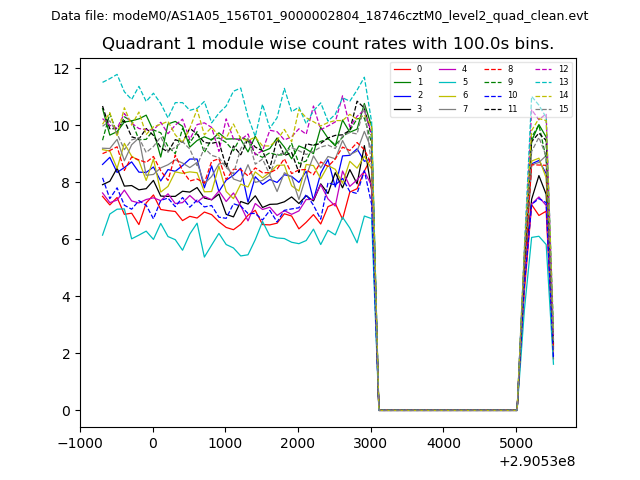
| Module-wise count rates for Quadrant A Data is divided into 100 sec bins |
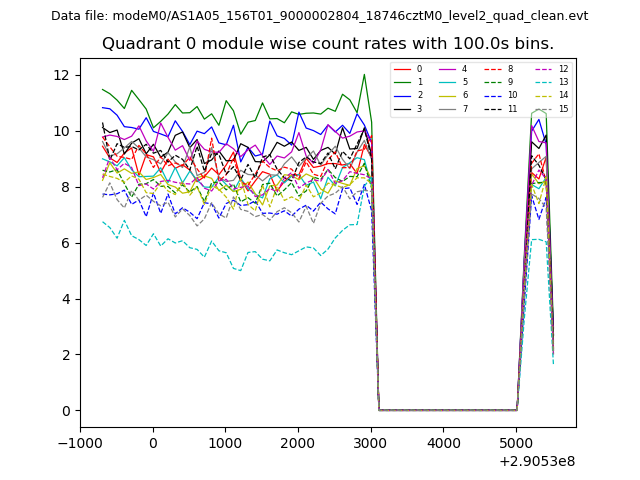 |
 |
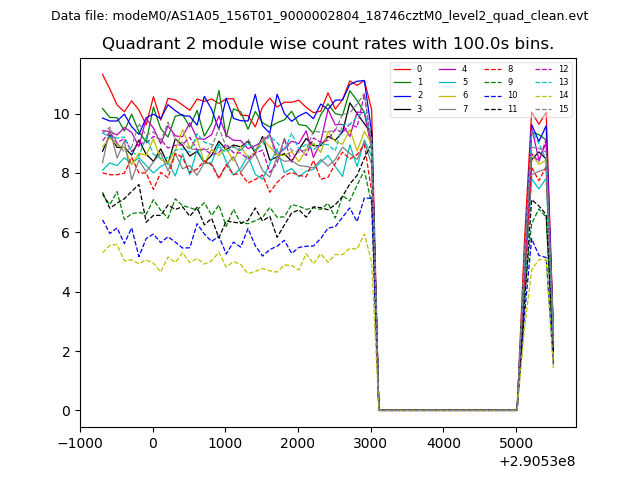
| Module-wise count rates for Quadrant B Data is divided into 100 sec bins |
 |
 |
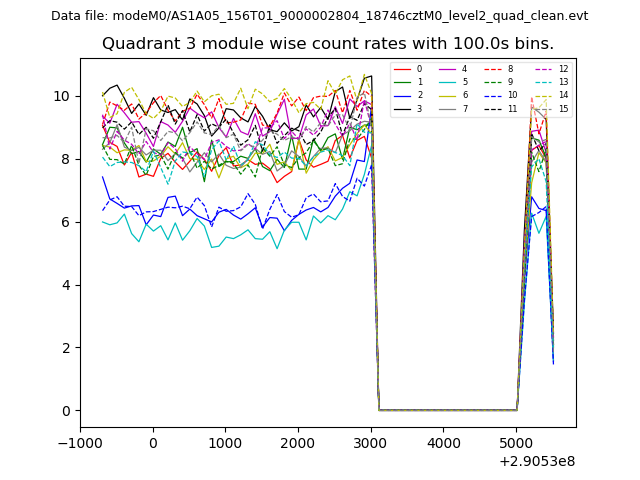
| Module-wise count rates for Quadrant C Data is divided into 100 sec bins |
 |
 |
| Module-wise count rates for Quadrant D Data is divided into 100 sec bins |
 |
 |
| Parameter | Plot |
|---|---|
| CZT HV Monitor | 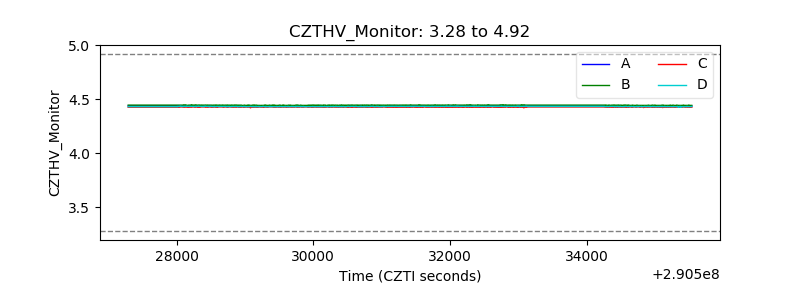 |
| D_VDD | 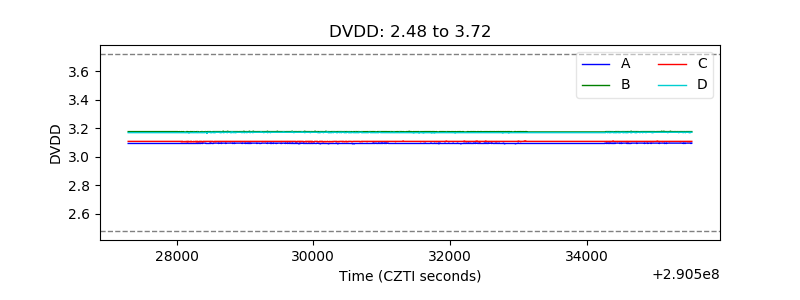 |
| Temperature 1 | 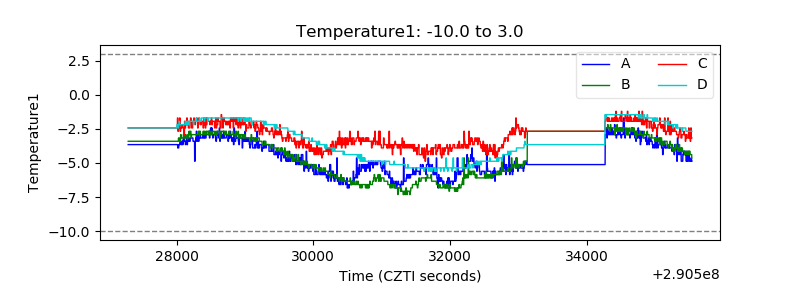 |
| Veto HV Monitor | 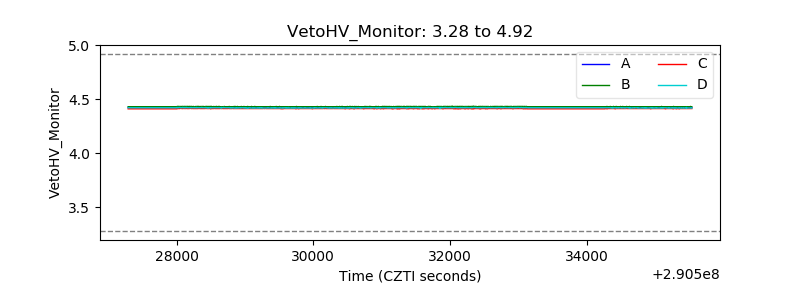 |
| Veto LLD | 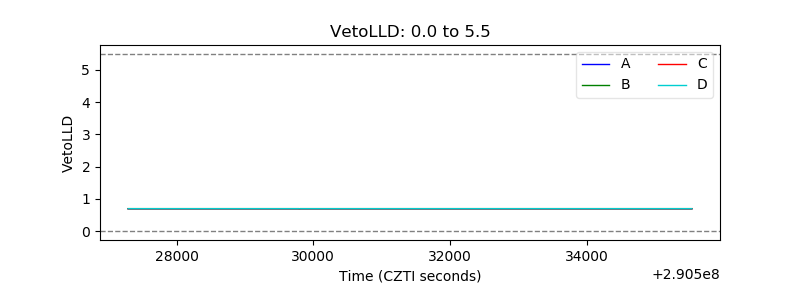 |
| Alpha Counter | 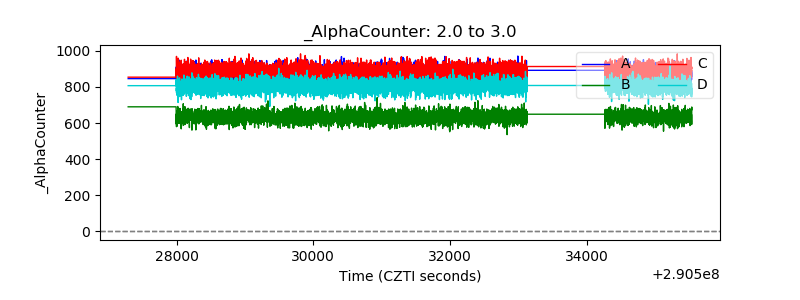 |
| _CPM_Rate | 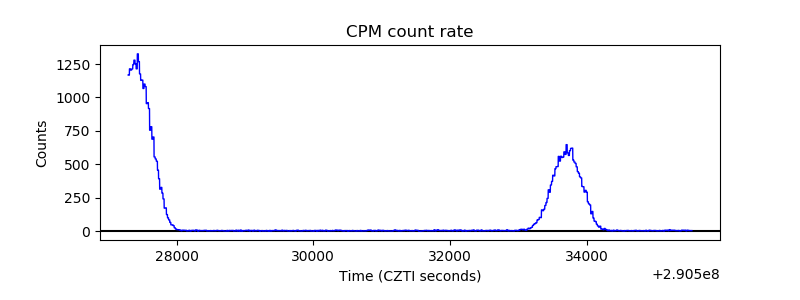 |
| CZT Counter | 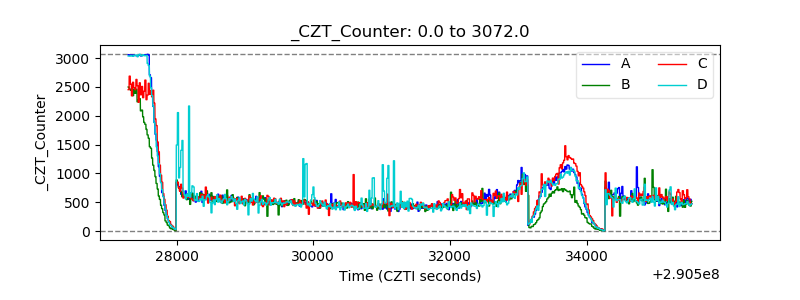 |
| +2.5 Volts monitor |  |
| +5 Volts monitor |  |
| _ROLL_ROT | 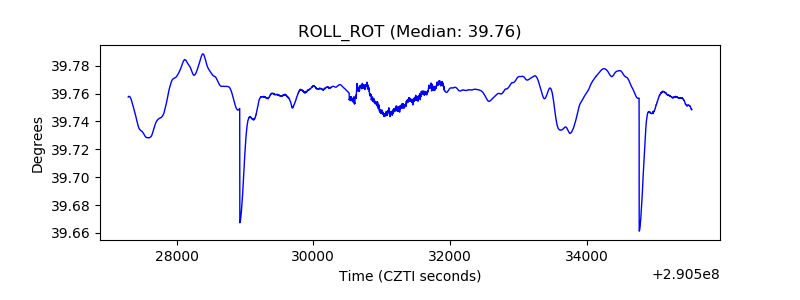 |
| _Roll_DEC | 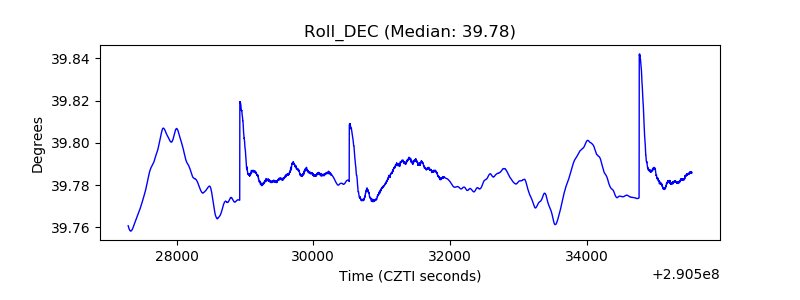 |
| _Roll_RA | 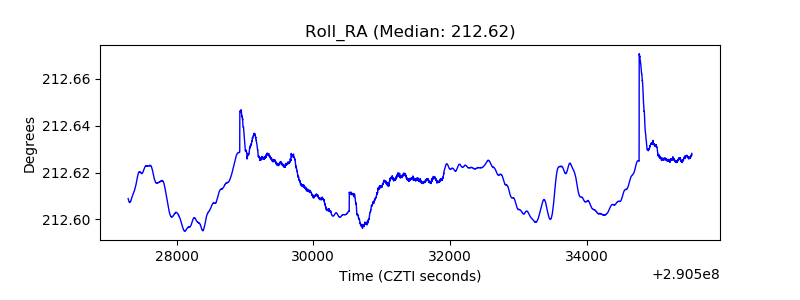 |
| Veto Counter | 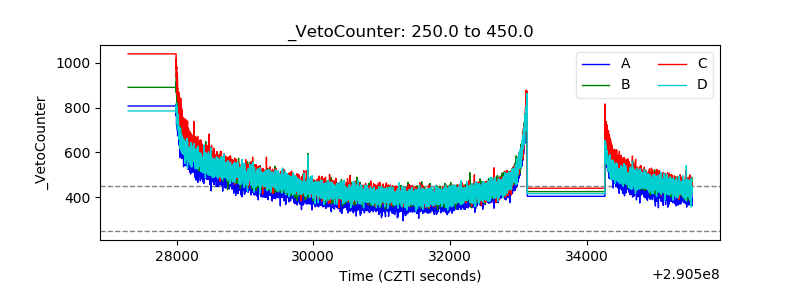 |