| Param | Original file | Final file |
|---|---|---|
| Filename | modeM0/AS1A05_156T01_9000002804_18747cztM0_level2.evt | modeM0/AS1A05_156T01_9000002804_18747cztM0_level2_quad_clean.evt |
| Size (bytes) | 491,172,480 | 95,722,560 |
| Size | 468.4 MB | 91.3 MB |
| Events in quadrant A | 3,450,175 | 610,641 |
| Events in quadrant B | 3,417,004 | 620,009 |
| Events in quadrant C | 4,209,453 | 597,475 |
| Events in quadrant D | 3,335,035 | 595,347 |
| Mode M0 | |||
|---|---|---|---|
| Quadrant | BADHDUFLAG | Total packets | Discarded packets |
| A | 0 | 14669 | 2 |
| B | 0 | 14484 | 2 |
| C | 0 | 16817 | 2 |
| D | 0 | 14559 | 2 |
| Mode M9 | |||
|---|---|---|---|
| Quadrant | BADHDUFLAG | Total packets | Discarded packets |
| A | 0 | 20 | 0 |
| B | 0 | 20 | 0 |
| C | 0 | 20 | 0 |
| D | 0 | 20 | 0 |
| Mode SS | |||
|---|---|---|---|
| Quadrant | BADHDUFLAG | Total packets | Discarded packets |
| A | 0 | 140 | 0 |
| B | 0 | 140 | 0 |
| C | 0 | 140 | 0 |
| D | 0 | 140 | 0 |
| Quadrant | Total seconds | Saturated seconds | Saturation percentage |
|---|---|---|---|
| A | 6823 | 147 | 2.154478% |
| B | 6824 | 166 | 2.432591% |
| C | 6824 | 381 | 5.583236% |
| D | 6824 | 103 | 1.509379% |
Noise dominated data is calculated using 1-second bins in cleaned event files. If a bin has >2000 counts, and if more than 50% of those come from <1% of pixels, then it is considered to be noise-dominated and hence unusable.
| Quadrant | # 1 sec bins | Bins with >0 counts | Bins with >2000 counts | High rate bins dominated by noise | Noise dominated (total time) | Noise dominated (detector-on time) | Marked lightcurve |
|---|---|---|---|---|---|---|---|
| A | 8808 | 6825 | 0 | 0 | 0.00% | 0.00% | 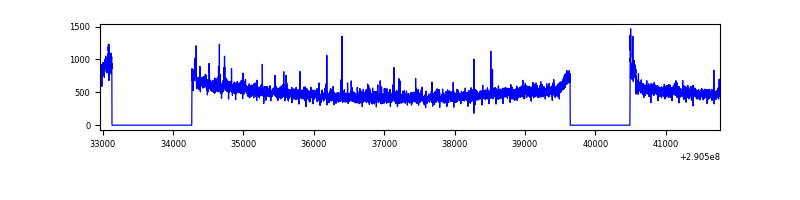 |
| B | 8809 | 6826 | 2 | 2 | 0.02% | 0.03% | 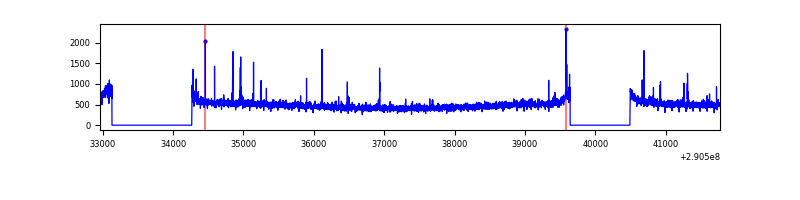 |
| C | 8809 | 6826 | 52 | 52 | 0.59% | 0.76% | 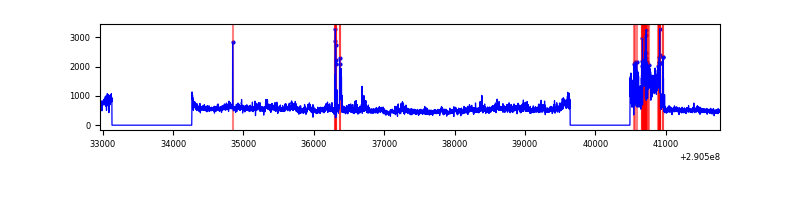 |
| D | 8809 | 6826 | 0 | 0 | 0.00% | 0.00% |  |
Top three noisy pixels from each quadrant. If the there are fewer than three noisy pixels in the level2.evt file, extra rows are filled as -1
| Pixel properties | Quadrant properties | ||||||
|---|---|---|---|---|---|---|---|
| Quadrant | DetID | PixID | Counts | Sigma | Mean | Median | Sigma |
| A | 15 | 192 | 127604 | 739.18 | 856 | 838 | 171.5 |
| A | 15 | 191 | 17940 | 99.72 | 856 | 838 | 171.5 |
| A | 13 | 254 | 11539 | 62.4 | 856 | 838 | 171.5 |
| B | 0 | 190 | 20978 | 123.32 | 852 | 830 | 163.4 |
| B | 12 | 111 | 19520 | 114.4 | 852 | 830 | 163.4 |
| B | 11 | 111 | 17022 | 99.11 | 852 | 830 | 163.4 |
| C | 3 | 233 | 864522 | 4527.05 | 819 | 825 | 190.8 |
| C | 14 | 238 | 126901 | 660.83 | 819 | 825 | 190.8 |
| C | 8 | 222 | 20992 | 105.7 | 819 | 825 | 190.8 |
| D | 7 | 38 | 69445 | 336.96 | 842 | 816 | 203.7 |
| D | 13 | 168 | 47725 | 230.31 | 842 | 816 | 203.7 |
| D | 2 | 234 | 30317 | 144.84 | 842 | 816 | 203.7 |
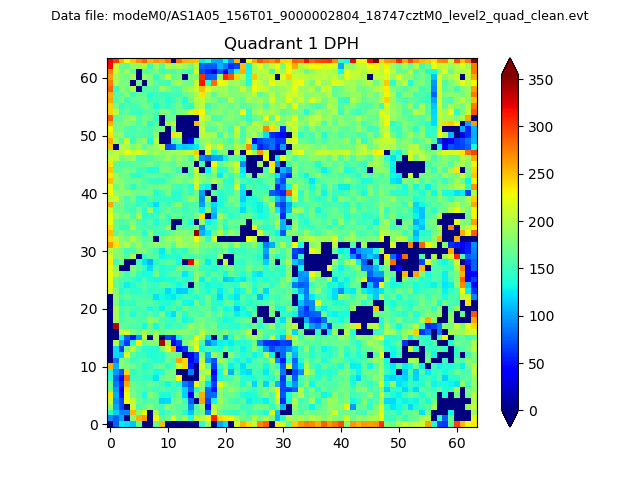
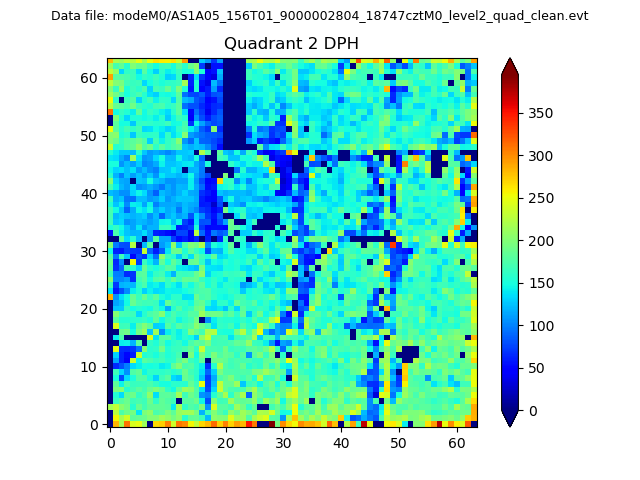
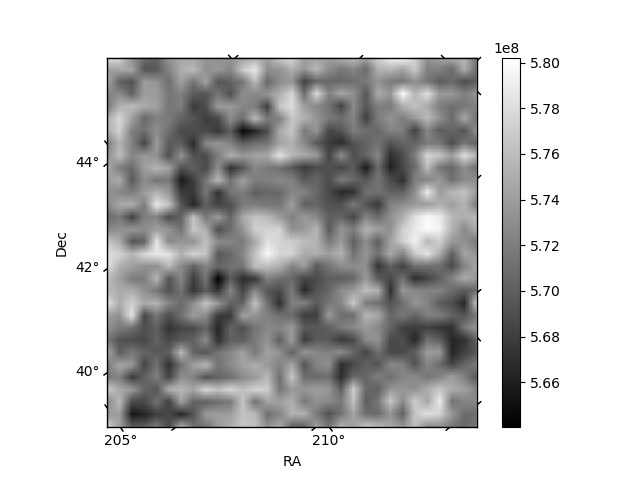
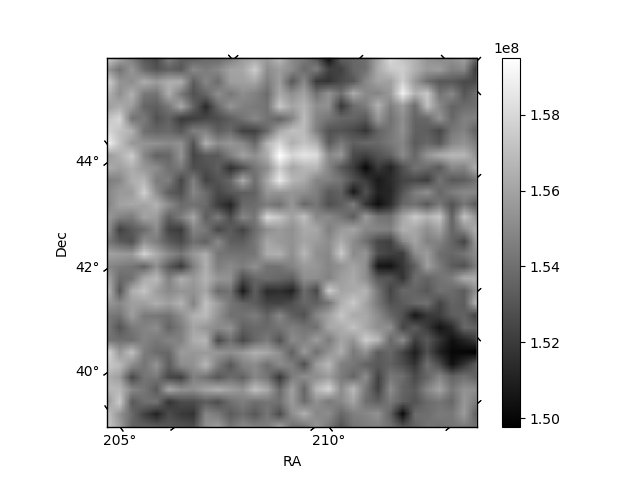
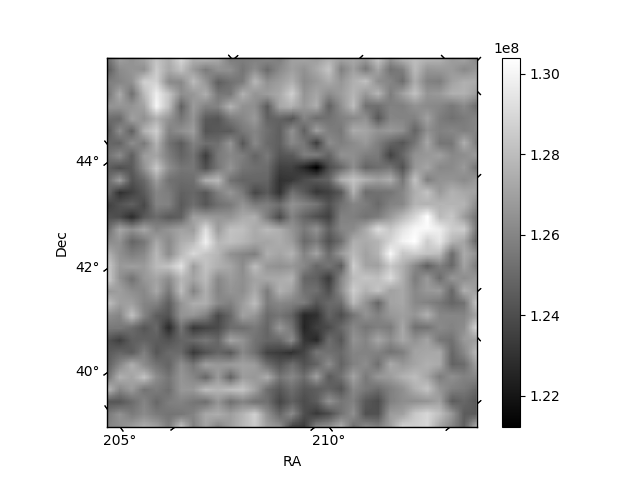
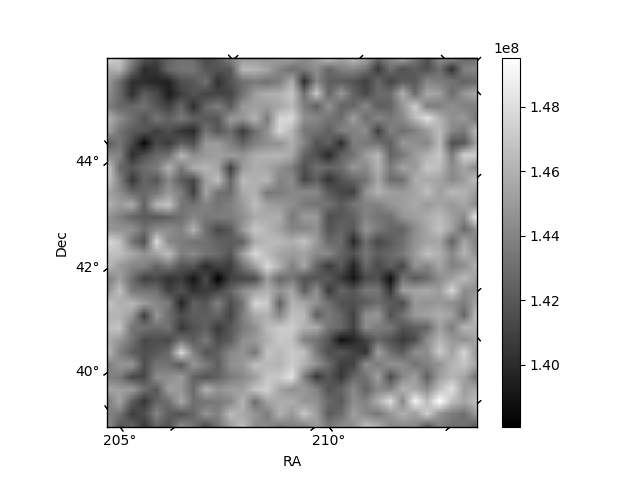
Histogram calculated using DETX and DETY for each event in the final _common_clean file
| Quadrant A | 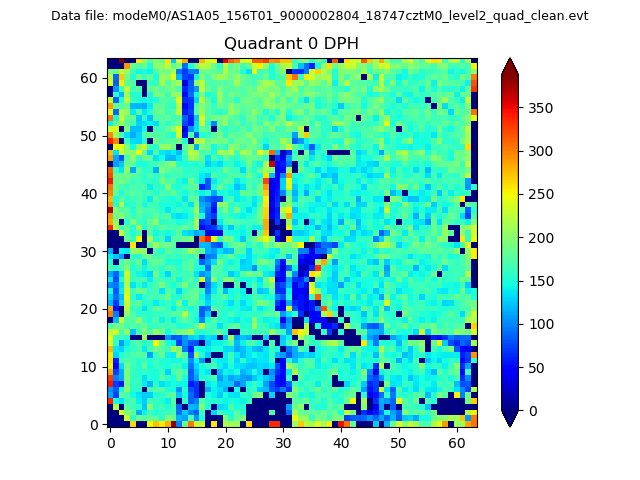 |
 |
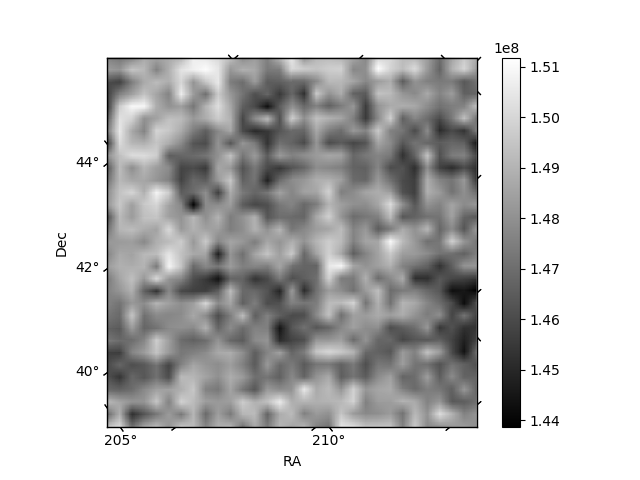
Quadrant B |
|---|---|---|---|
| Quadrant D | 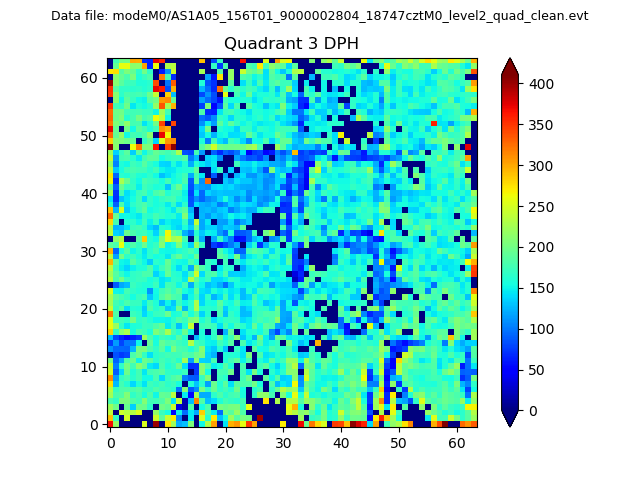 |
 |
Quadrant C |
| Plot type | Count rate plots | Images |
|---|---|---|
| Comparison with Poisson distribution Blue bars denote a histogram of data divided into 1 sec bins. Red curve is a Poisson curve with rate = median count rate of data. |
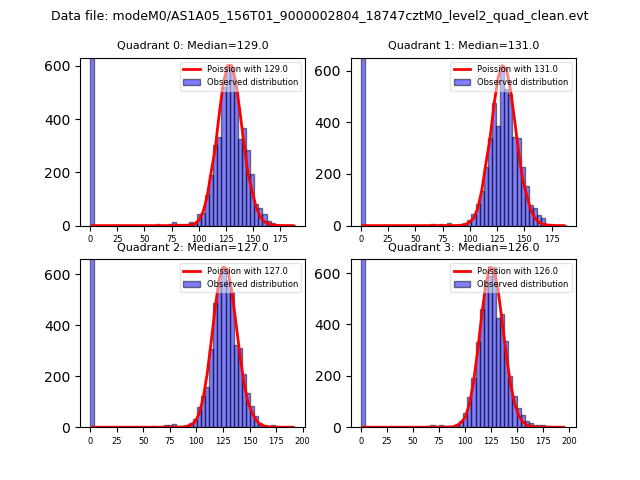 |
 |
| Quadrant-wise count rates Data is divided into 100 sec bins |
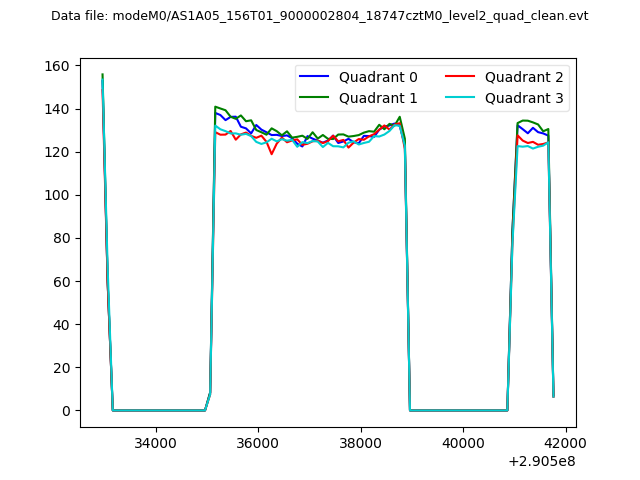 |
|
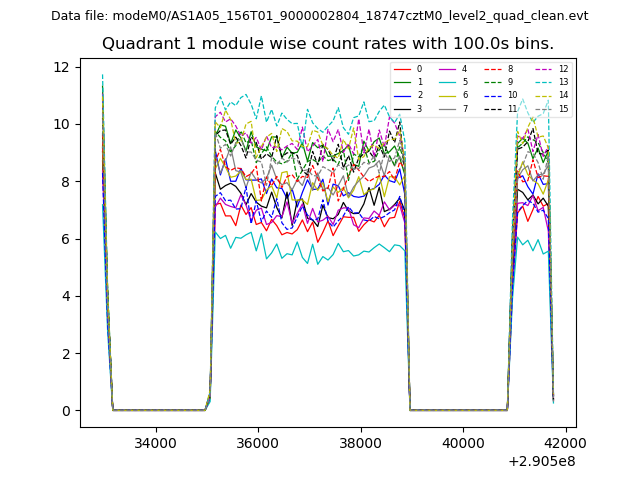
| Module-wise count rates for Quadrant A Data is divided into 100 sec bins |
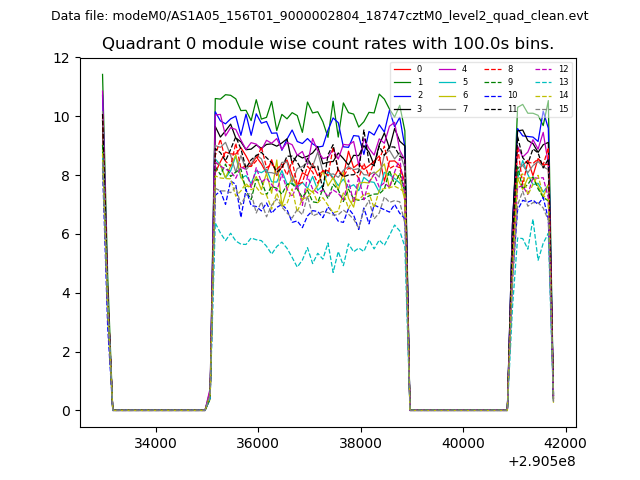 |
 |
| Module-wise count rates for Quadrant B Data is divided into 100 sec bins |
 |
 |
| Module-wise count rates for Quadrant C Data is divided into 100 sec bins |
 |
 |
| Module-wise count rates for Quadrant D Data is divided into 100 sec bins |
 |
 |
| Parameter | Plot |
|---|---|
| CZT HV Monitor | 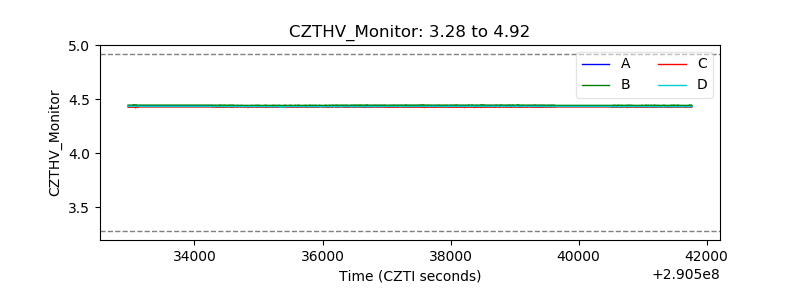 |
| D_VDD | 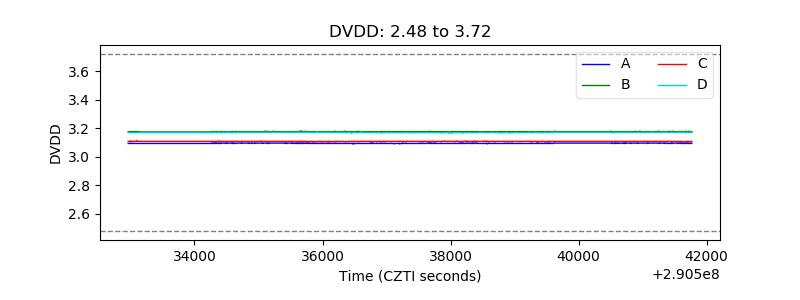 |
| Temperature 1 | 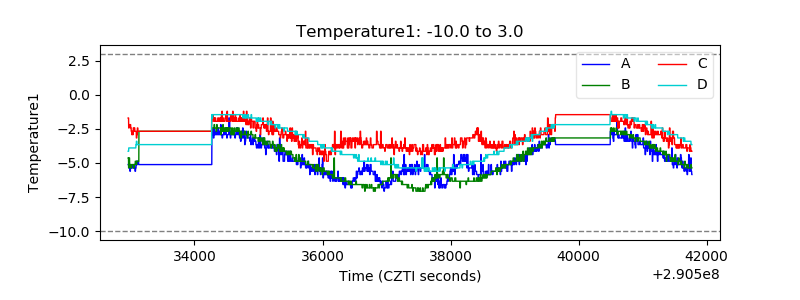 |
| Veto HV Monitor | 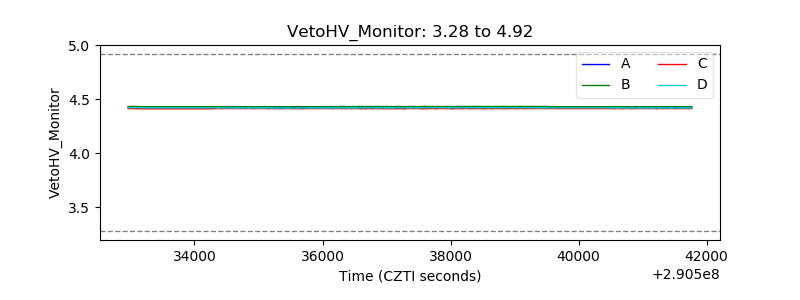 |
| Veto LLD | 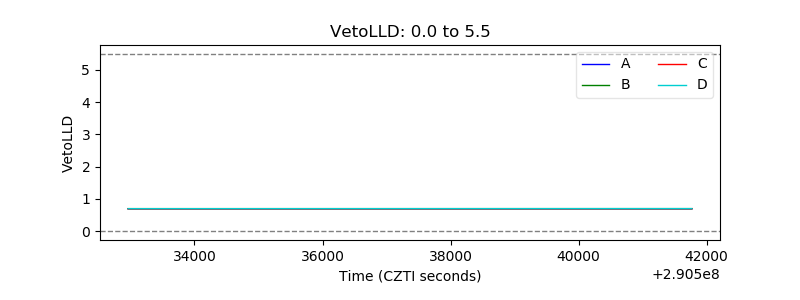 |
| Alpha Counter | 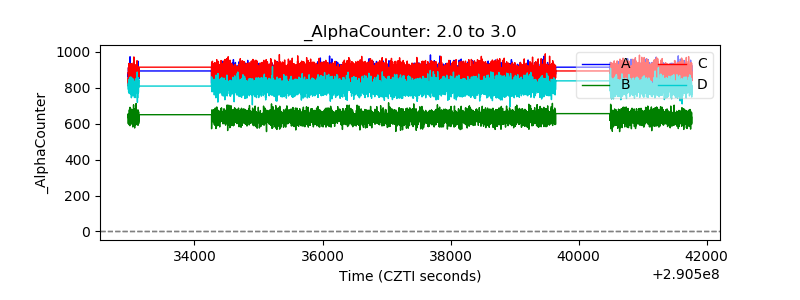 |
| _CPM_Rate | 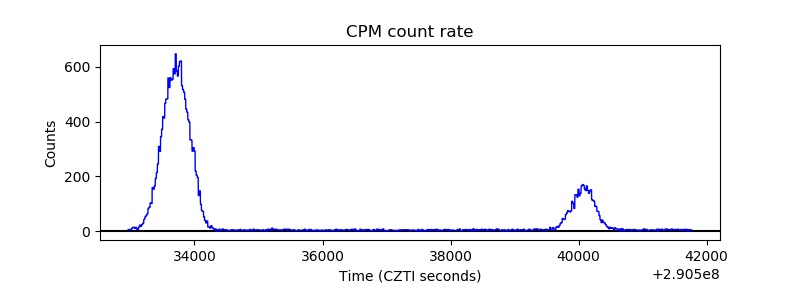 |
| CZT Counter | 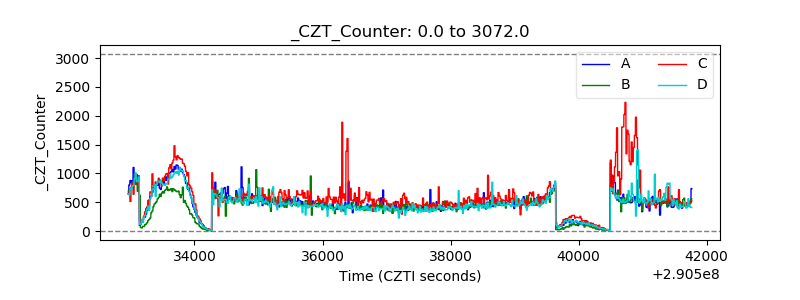 |
| +2.5 Volts monitor |  |
| +5 Volts monitor |  |
| _ROLL_ROT | 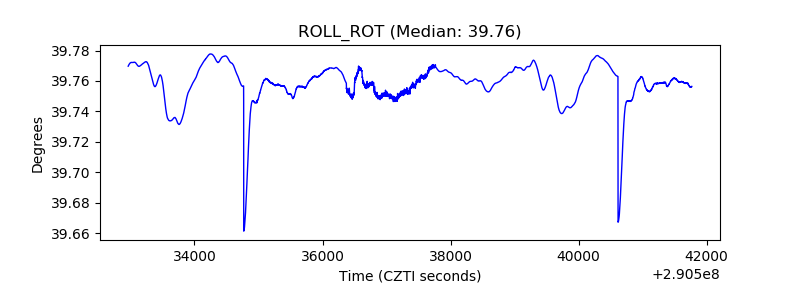 |
| _Roll_DEC | 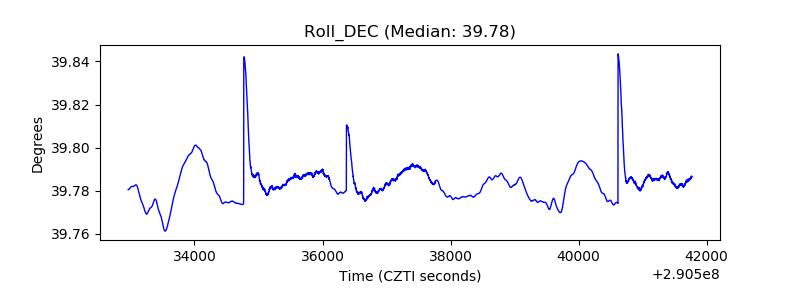 |
| _Roll_RA | 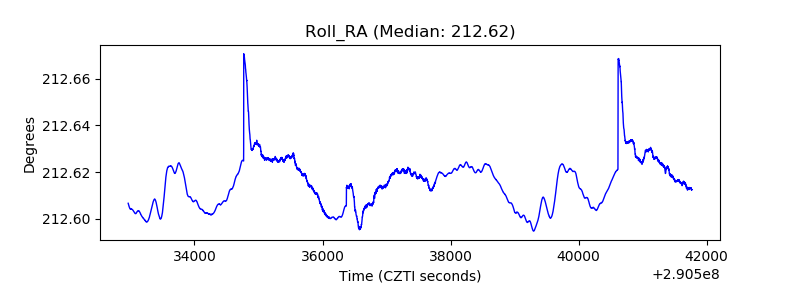 |
| Veto Counter | 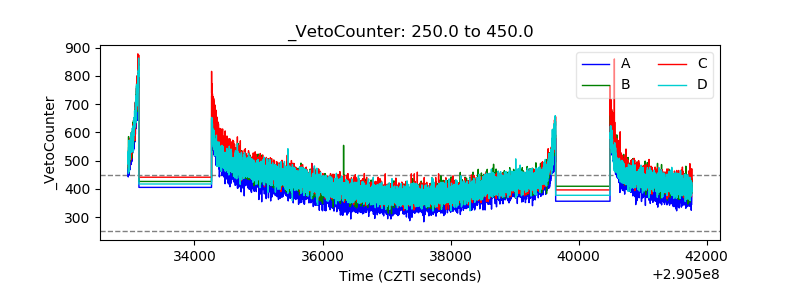 |