| Param | Original file | Final file |
|---|---|---|
| Filename | modeM0/AS1A05_156T01_9000002804_18748cztM0_level2.evt | modeM0/AS1A05_156T01_9000002804_18748cztM0_level2_quad_clean.evt |
| Size (bytes) | 577,100,160 | 106,433,280 |
| Size | 550.4 MB | 101.5 MB |
| Events in quadrant A | 3,958,357 | 670,665 |
| Events in quadrant B | 4,063,114 | 677,395 |
| Events in quadrant C | 4,418,257 | 656,663 |
| Events in quadrant D | 4,482,445 | 650,184 |
| Mode M0 | |||
|---|---|---|---|
| Quadrant | BADHDUFLAG | Total packets | Discarded packets |
| A | 0 | 17086 | 2 |
| B | 0 | 17338 | 2 |
| C | 0 | 18454 | 2 |
| D | 0 | 18999 | 2 |
| Mode M9 | |||
|---|---|---|---|
| Quadrant | BADHDUFLAG | Total packets | Discarded packets |
| A | 0 | 13 | 0 |
| B | 0 | 13 | 0 |
| C | 0 | 13 | 0 |
| D | 0 | 13 | 0 |
| Mode SS | |||
|---|---|---|---|
| Quadrant | BADHDUFLAG | Total packets | Discarded packets |
| A | 0 | 168 | 0 |
| B | 0 | 168 | 0 |
| C | 0 | 168 | 0 |
| D | 0 | 168 | 0 |
| Quadrant | Total seconds | Saturated seconds | Saturation percentage |
|---|---|---|---|
| A | 8177 | 111 | 1.357466% |
| B | 8178 | 171 | 2.090976% |
| C | 8178 | 358 | 4.377598% |
| D | 8178 | 267 | 3.264857% |
Noise dominated data is calculated using 1-second bins in cleaned event files. If a bin has >2000 counts, and if more than 50% of those come from <1% of pixels, then it is considered to be noise-dominated and hence unusable.
| Quadrant | # 1 sec bins | Bins with >0 counts | Bins with >2000 counts | High rate bins dominated by noise | Noise dominated (total time) | Noise dominated (detector-on time) | Marked lightcurve |
|---|---|---|---|---|---|---|---|
| A | 9437 | 8179 | 1 | 1 | 0.01% | 0.01% | 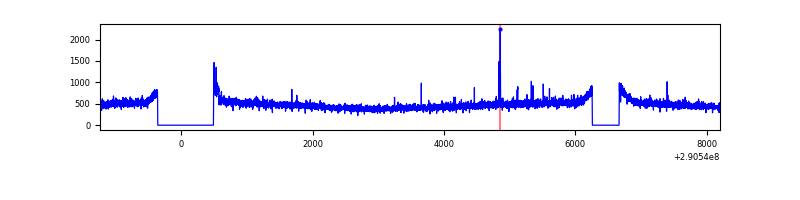 |
| B | 9438 | 8180 | 5 | 5 | 0.05% | 0.06% | 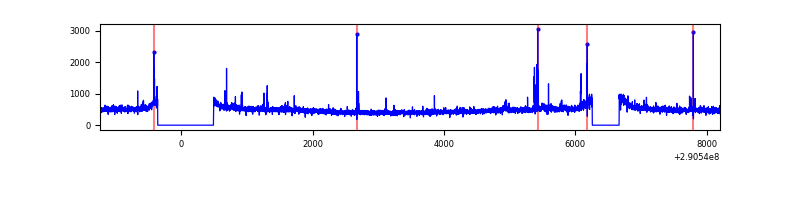 |
| C | 9438 | 8180 | 44 | 44 | 0.47% | 0.54% | 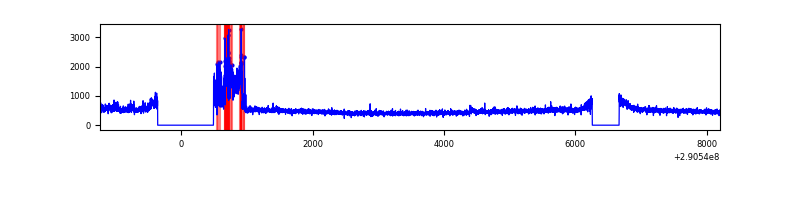 |
| D | 9438 | 8180 | 137 | 137 | 1.45% | 1.67% | 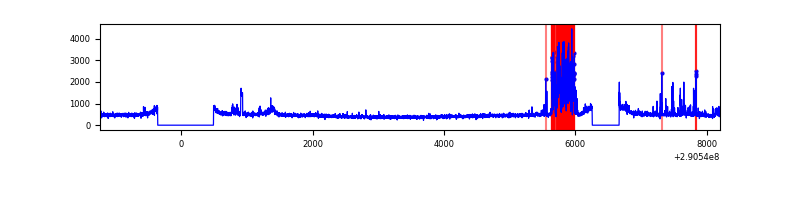 |
Top three noisy pixels from each quadrant. If the there are fewer than three noisy pixels in the level2.evt file, extra rows are filled as -1
| Pixel properties | Quadrant properties | ||||||
|---|---|---|---|---|---|---|---|
| Quadrant | DetID | PixID | Counts | Sigma | Mean | Median | Sigma |
| A | 15 | 192 | 38172 | 182.63 | 1009 | 985 | 203.6 |
| A | 15 | 191 | 18082 | 83.97 | 1009 | 985 | 203.6 |
| A | 13 | 254 | 14835 | 68.02 | 1009 | 985 | 203.6 |
| B | 15 | 201 | 28638 | 142.83 | 1007 | 979 | 193.6 |
| B | 12 | 111 | 23364 | 115.6 | 1007 | 979 | 193.6 |
| B | 3 | 64 | 20726 | 101.98 | 1007 | 979 | 193.6 |
| C | 3 | 233 | 487551 | 2155.94 | 966 | 971 | 225.7 |
| C | 14 | 238 | 148675 | 654.45 | 966 | 971 | 225.7 |
| C | 9 | 54 | 11561 | 46.92 | 966 | 971 | 225.7 |
| D | 14 | 34 | 585442 | 2464.03 | 979 | 950 | 237.2 |
| D | 13 | 168 | 100574 | 419.98 | 979 | 950 | 237.2 |
| D | 7 | 38 | 69215 | 287.78 | 979 | 950 | 237.2 |
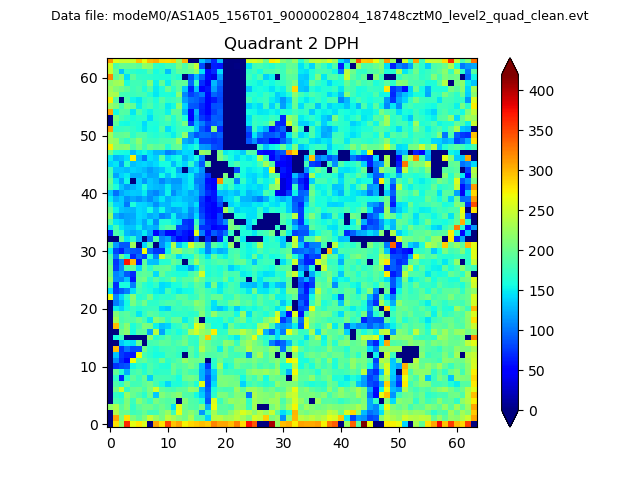
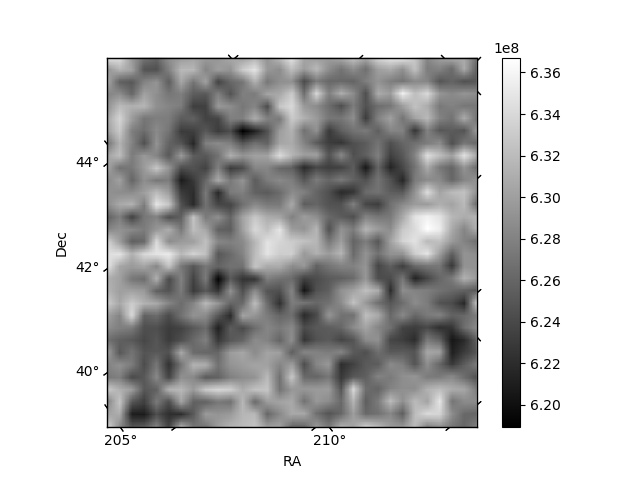
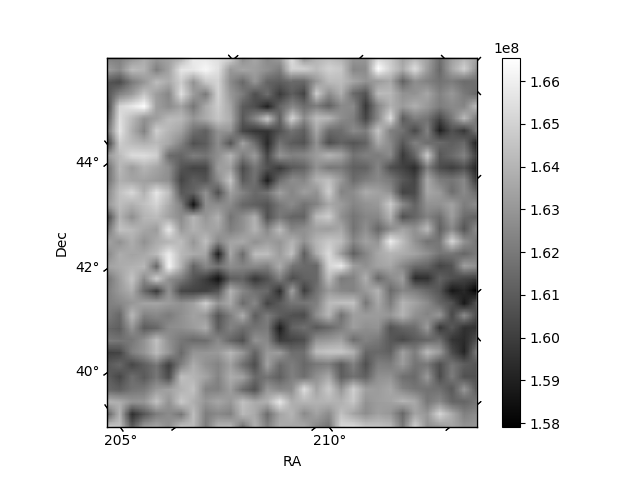
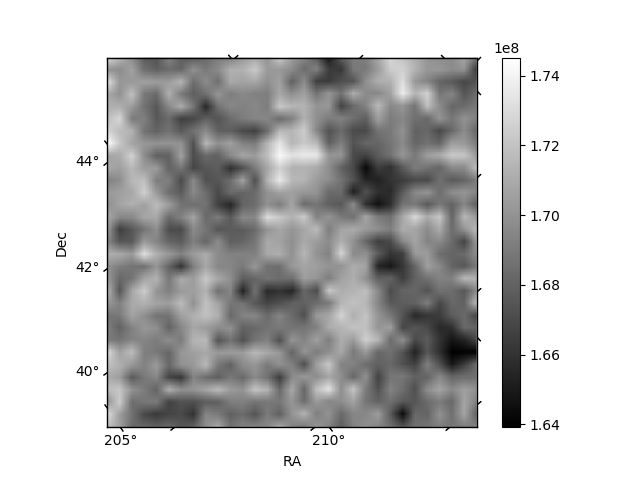
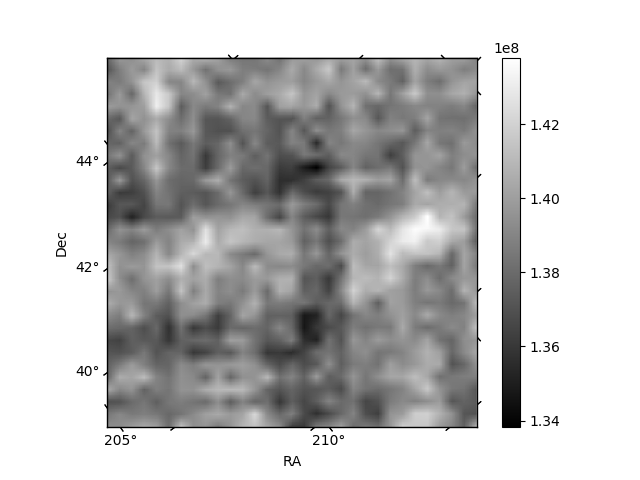
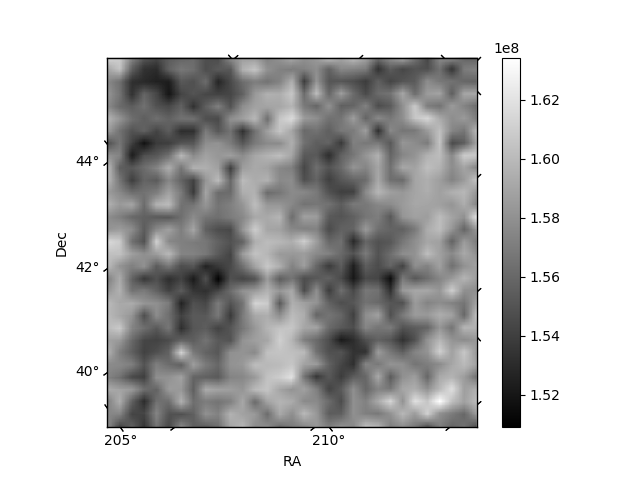
Histogram calculated using DETX and DETY for each event in the final _common_clean file
| Quadrant A | 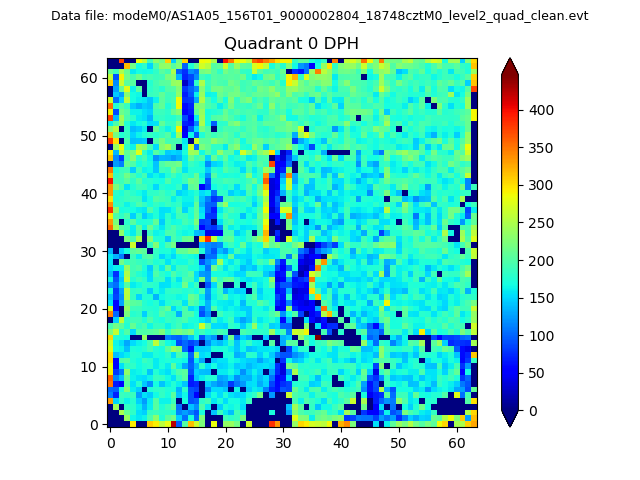 |
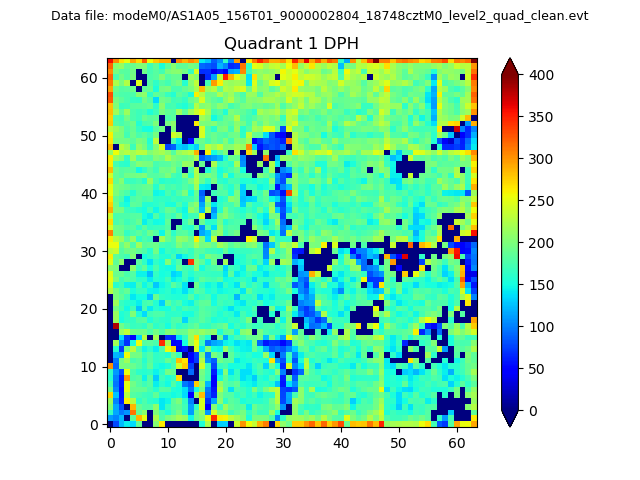 |
Quadrant B |
|---|---|---|---|
| Quadrant D | 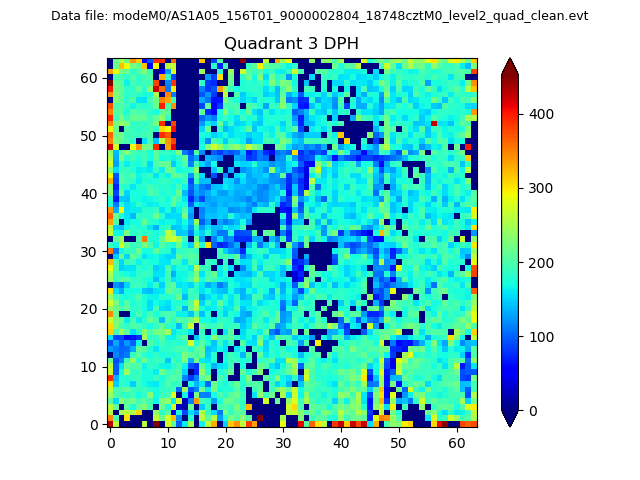 |
 |
Quadrant C |
| Plot type | Count rate plots | Images |
|---|---|---|
| Comparison with Poisson distribution Blue bars denote a histogram of data divided into 1 sec bins. Red curve is a Poisson curve with rate = median count rate of data. |
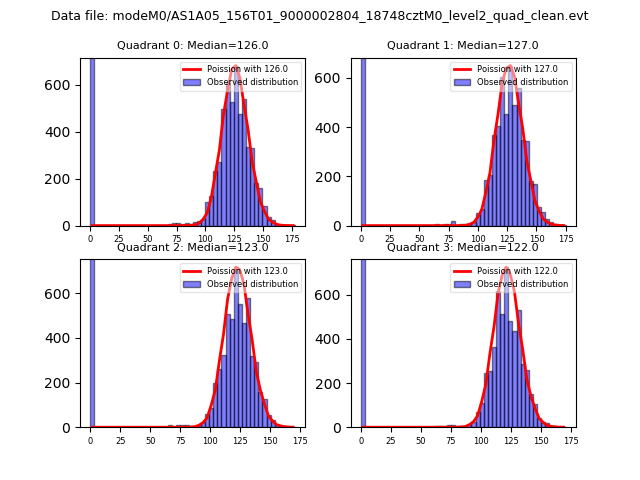 |
 |
| Quadrant-wise count rates Data is divided into 100 sec bins |
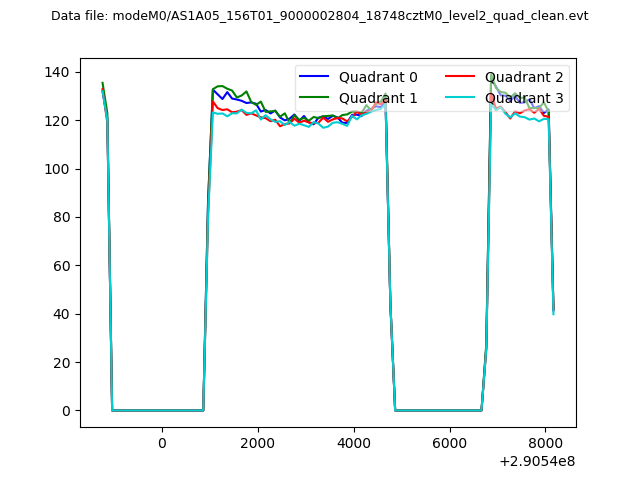 |
|
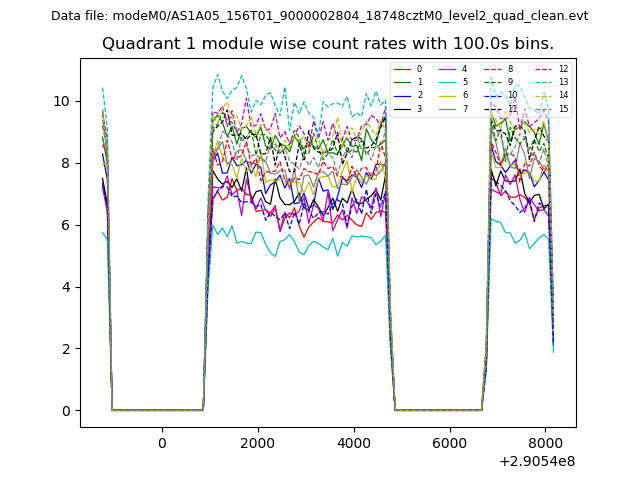
| Module-wise count rates for Quadrant A Data is divided into 100 sec bins |
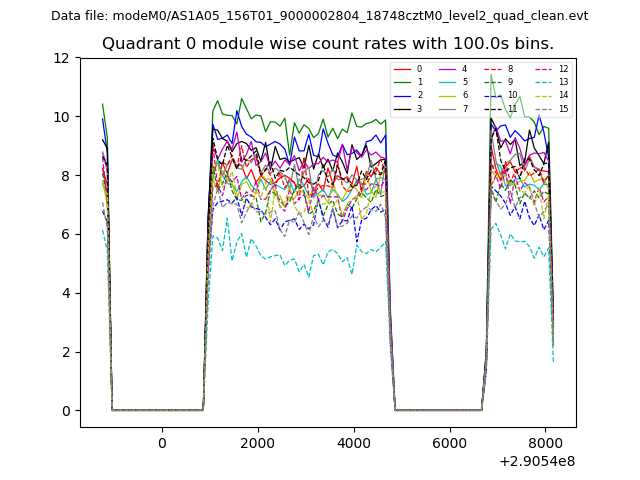 |
 |
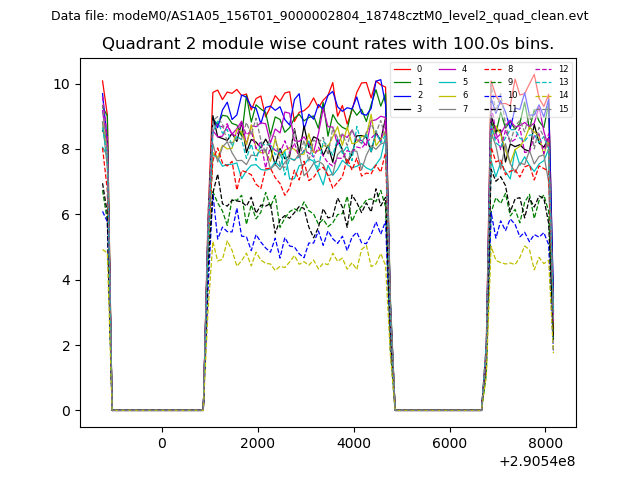
| Module-wise count rates for Quadrant B Data is divided into 100 sec bins |
 |
 |
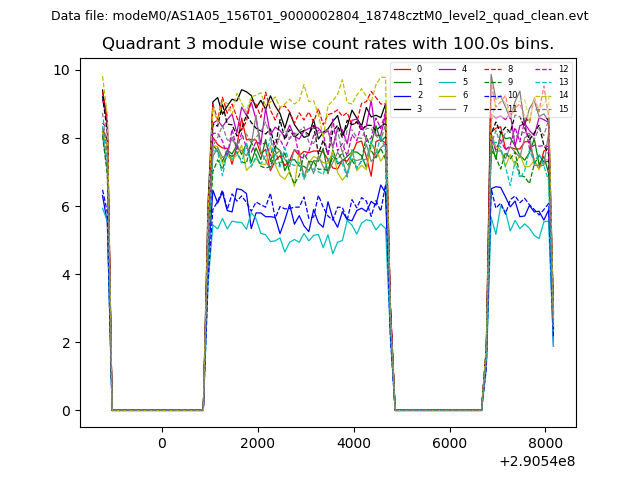
| Module-wise count rates for Quadrant C Data is divided into 100 sec bins |
 |
 |
| Module-wise count rates for Quadrant D Data is divided into 100 sec bins |
 |
 |
| Parameter | Plot |
|---|---|
| CZT HV Monitor | 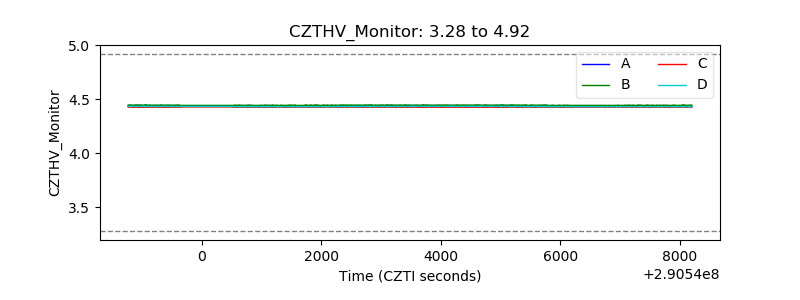 |
| D_VDD | 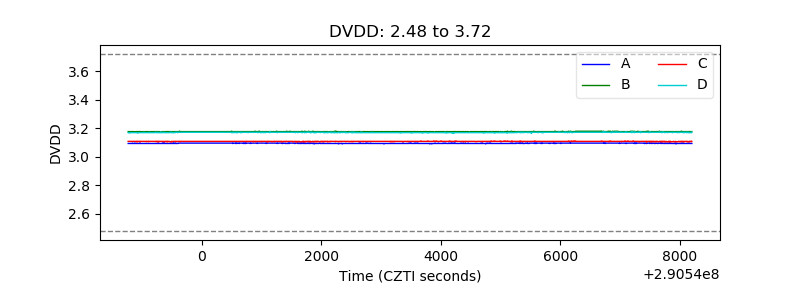 |
| Temperature 1 | 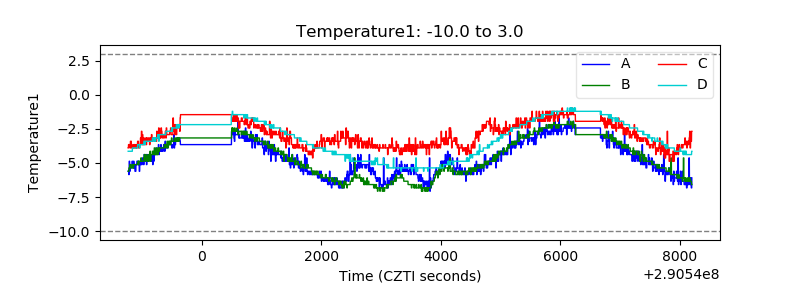 |
| Veto HV Monitor | 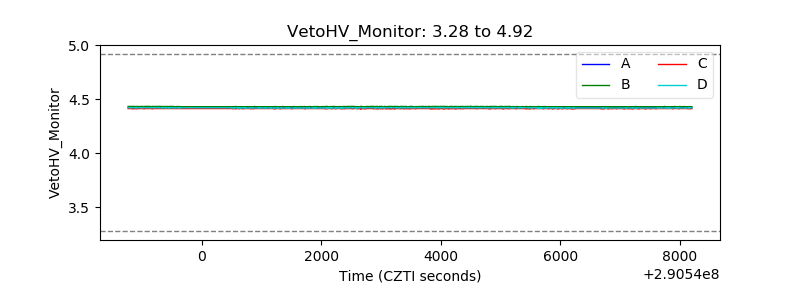 |
| Veto LLD | 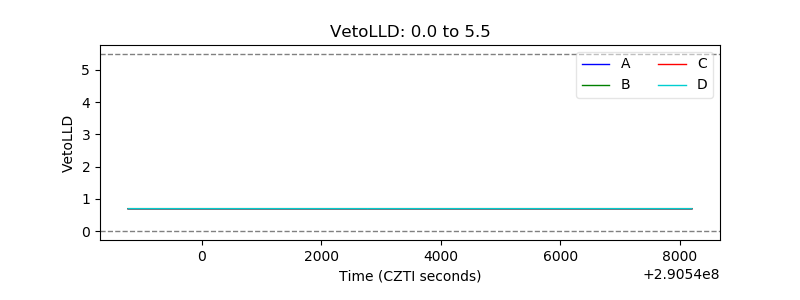 |
| Alpha Counter | 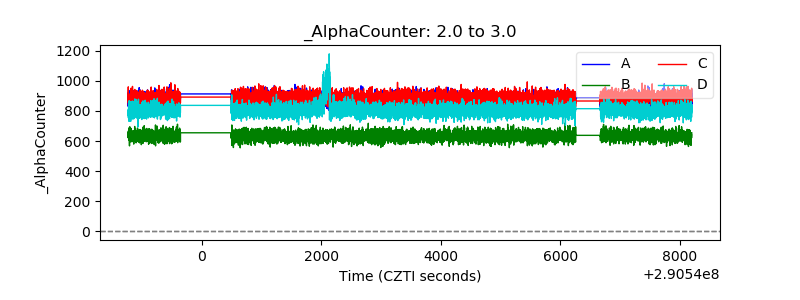 |
| _CPM_Rate | 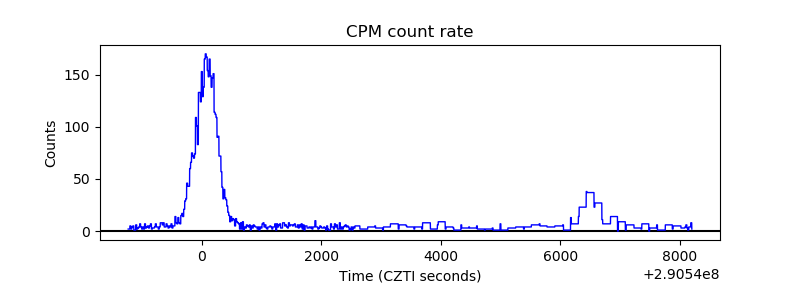 |
| CZT Counter | 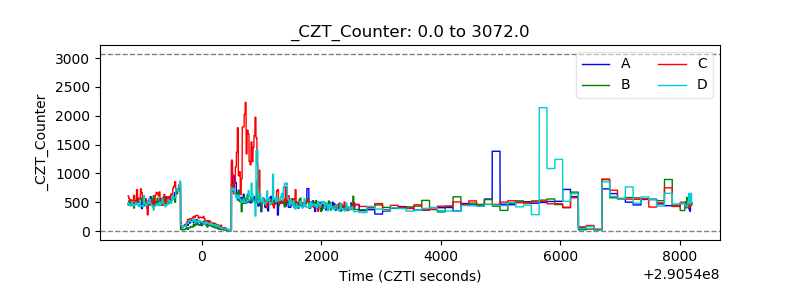 |
| +2.5 Volts monitor |  |
| +5 Volts monitor |  |
| _ROLL_ROT | 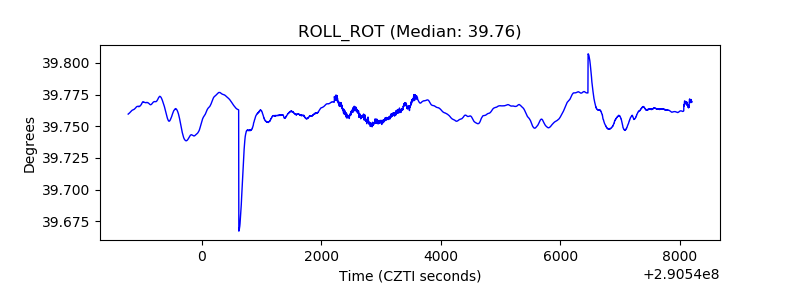 |
| _Roll_DEC | 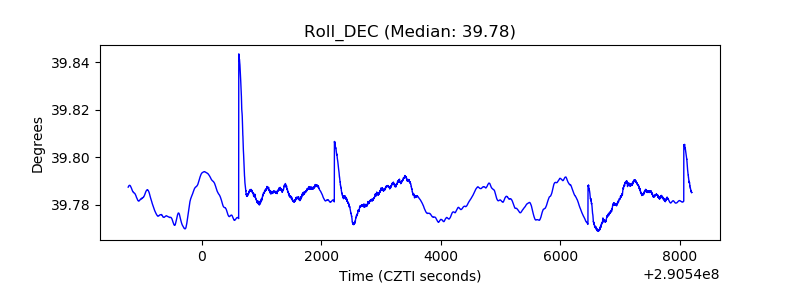 |
| _Roll_RA | 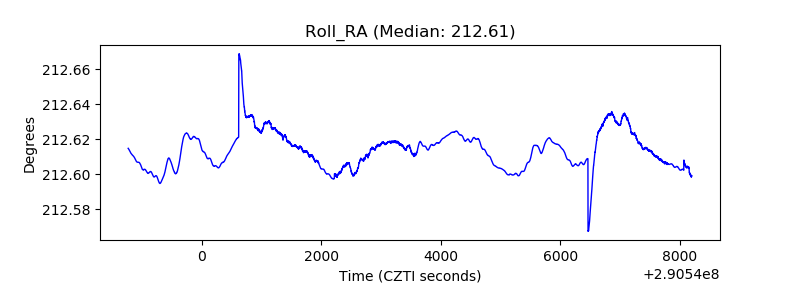 |
| Veto Counter | 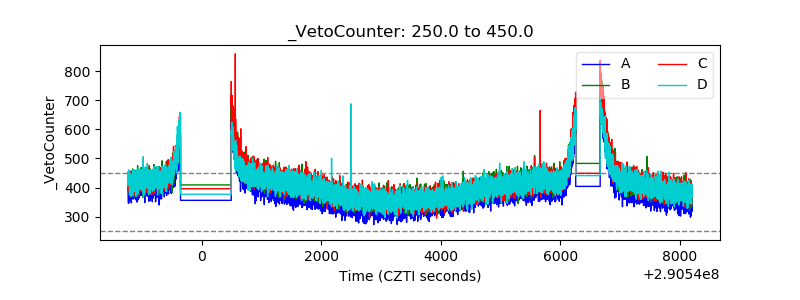 |