| Param | Original file | Final file |
|---|---|---|
| Filename | modeM0/AS1A05_156T01_9000002804_18750cztM0_level2.evt | modeM0/AS1A05_156T01_9000002804_18750cztM0_level2_quad_clean.evt |
| Size (bytes) | 498,925,440 | 104,417,280 |
| Size | 475.8 MB | 99.6 MB |
| Events in quadrant A | 3,435,324 | 666,885 |
| Events in quadrant B | 3,697,902 | 675,694 |
| Events in quadrant C | 3,630,214 | 658,239 |
| Events in quadrant D | 3,840,157 | 642,690 |
| Mode M0 | |||
|---|---|---|---|
| Quadrant | BADHDUFLAG | Total packets | Discarded packets |
| A | 0 | 15372 | 2 |
| B | 0 | 16056 | 2 |
| C | 0 | 15810 | 2 |
| D | 0 | 16785 | 2 |
| Mode M9 | |||
|---|---|---|---|
| Quadrant | BADHDUFLAG | Total packets | Discarded packets |
| A | 0 | 6 | 0 |
| B | 0 | 7 | 0 |
| C | 0 | 7 | 0 |
| D | 0 | 7 | 0 |
| Mode SS | |||
|---|---|---|---|
| Quadrant | BADHDUFLAG | Total packets | Discarded packets |
| A | 0 | 152 | 0 |
| B | 0 | 152 | 0 |
| C | 0 | 152 | 0 |
| D | 0 | 152 | 0 |
| Quadrant | Total seconds | Saturated seconds | Saturation percentage |
|---|---|---|---|
| A | 7459 | 32 | 0.429012% |
| B | 7459 | 130 | 1.742861% |
| C | 7458 | 104 | 1.394476% |
| D | 7458 | 96 | 1.287208% |
Noise dominated data is calculated using 1-second bins in cleaned event files. If a bin has >2000 counts, and if more than 50% of those come from <1% of pixels, then it is considered to be noise-dominated and hence unusable.
| Quadrant | # 1 sec bins | Bins with >0 counts | Bins with >2000 counts | High rate bins dominated by noise | Noise dominated (total time) | Noise dominated (detector-on time) | Marked lightcurve |
|---|---|---|---|---|---|---|---|
| A | 7880 | 7460 | 0 | 0 | 0.00% | 0.00% |  |
| B | 7880 | 7460 | 42 | 42 | 0.53% | 0.56% |  |
| C | 7879 | 7459 | 9 | 9 | 0.11% | 0.12% |  |
| D | 7879 | 7459 | 25 | 25 | 0.32% | 0.34% |  |
Top three noisy pixels from each quadrant. If the there are fewer than three noisy pixels in the level2.evt file, extra rows are filled as -1
| Pixel properties | Quadrant properties | ||||||
|---|---|---|---|---|---|---|---|
| Quadrant | DetID | PixID | Counts | Sigma | Mean | Median | Sigma |
| A | 13 | 254 | 11025 | 56.53 | 887 | 867 | 179.7 |
| A | 15 | 192 | 9938 | 50.48 | 887 | 867 | 179.7 |
| A | 0 | 226 | 7586 | 37.39 | 887 | 867 | 179.7 |
| B | 15 | 201 | 169604 | 984.83 | 882 | 859 | 171.3 |
| B | 0 | 230 | 24419 | 137.5 | 882 | 859 | 171.3 |
| B | 12 | 111 | 20942 | 117.21 | 882 | 859 | 171.3 |
| C | 14 | 238 | 133132 | 652.87 | 858 | 862 | 202.6 |
| C | 3 | 233 | 131060 | 642.65 | 858 | 862 | 202.6 |
| C | 0 | 239 | 17663 | 82.93 | 858 | 862 | 202.6 |
| D | 13 | 168 | 453608 | 2159.88 | 862 | 837 | 209.6 |
| D | 7 | 38 | 43455 | 203.3 | 862 | 837 | 209.6 |
| D | 7 | 238 | 43423 | 203.15 | 862 | 837 | 209.6 |
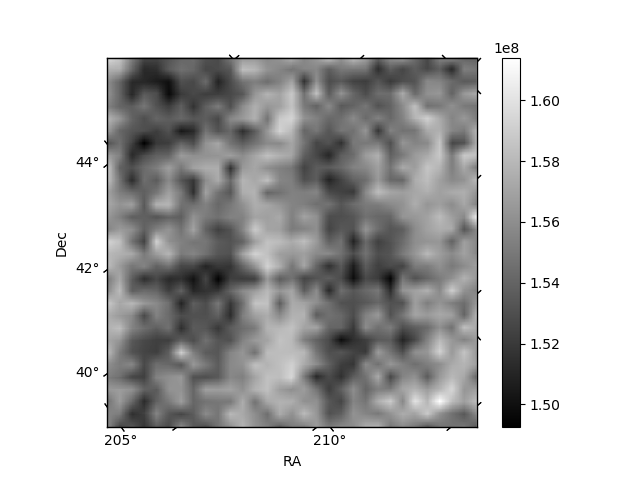
Histogram calculated using DETX and DETY for each event in the final _common_clean file
| Quadrant A | 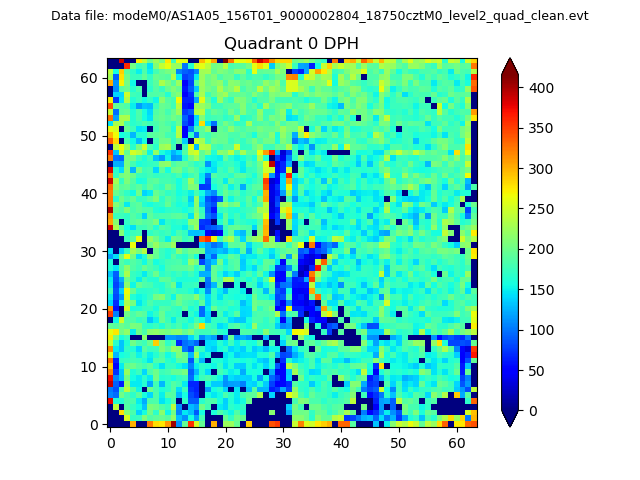 |
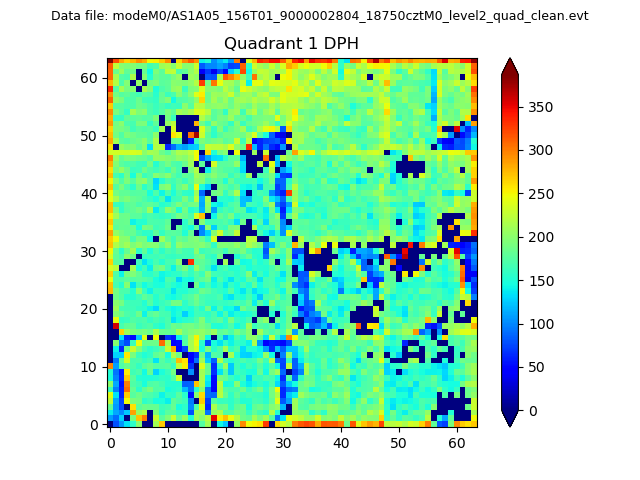 |
Quadrant B |
|---|---|---|---|
| Quadrant D |  |
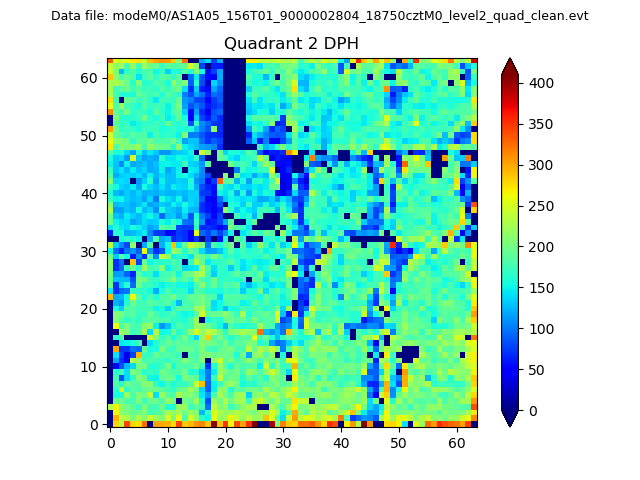 |
Quadrant C |
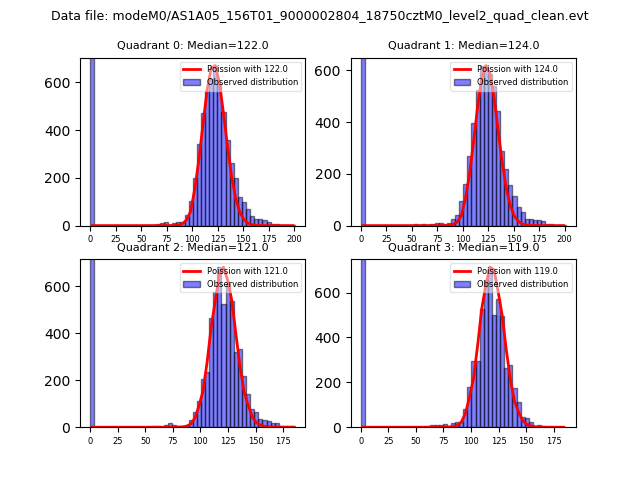
| Plot type | Count rate plots | Images |
|---|---|---|
| Comparison with Poisson distribution Blue bars denote a histogram of data divided into 1 sec bins. Red curve is a Poisson curve with rate = median count rate of data. |
 |
 |
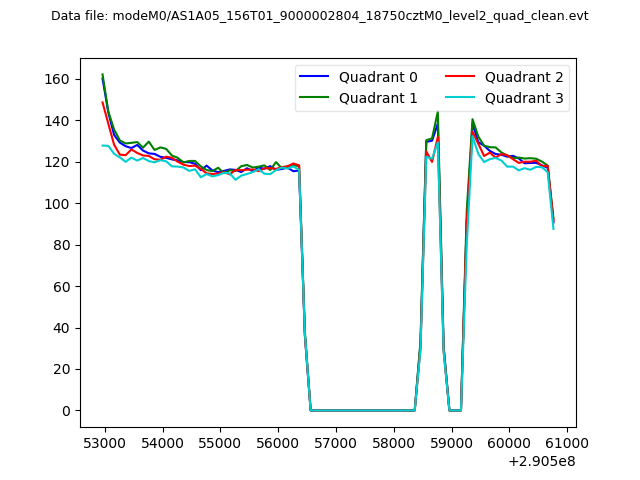
| Quadrant-wise count rates Data is divided into 100 sec bins |
 |
|
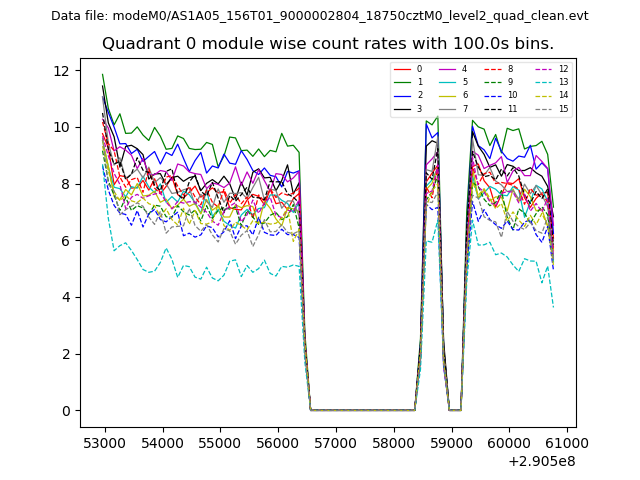
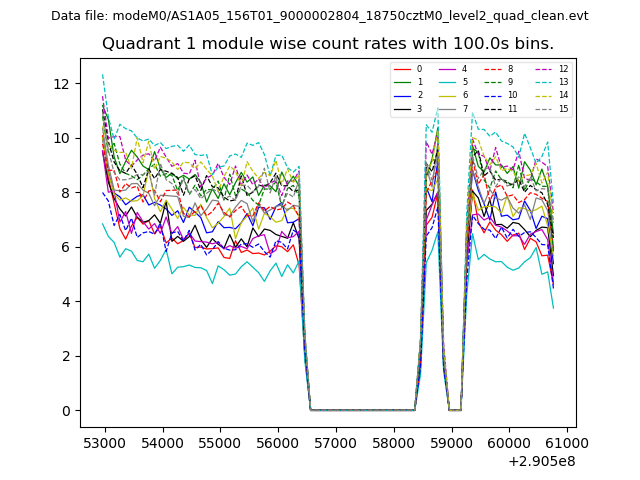
| Module-wise count rates for Quadrant A Data is divided into 100 sec bins |
 |
 |
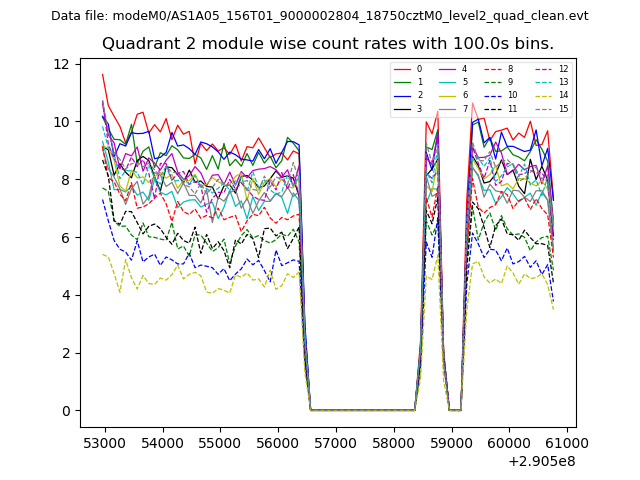
| Module-wise count rates for Quadrant B Data is divided into 100 sec bins |
 |
 |
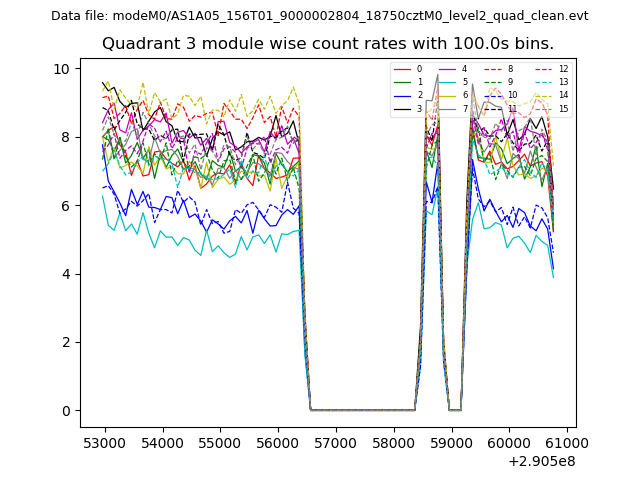
| Module-wise count rates for Quadrant C Data is divided into 100 sec bins |
 |
 |
| Module-wise count rates for Quadrant D Data is divided into 100 sec bins |
 |
 |
| Parameter | Plot |
|---|---|
| CZT HV Monitor | 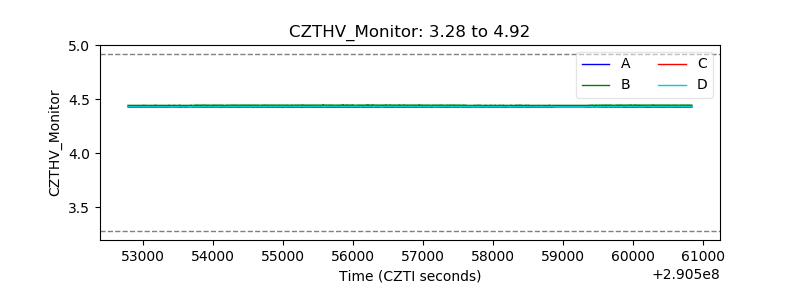 |
| D_VDD | 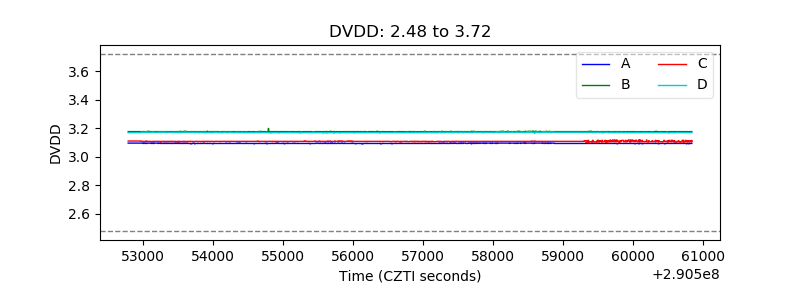 |
| Temperature 1 | 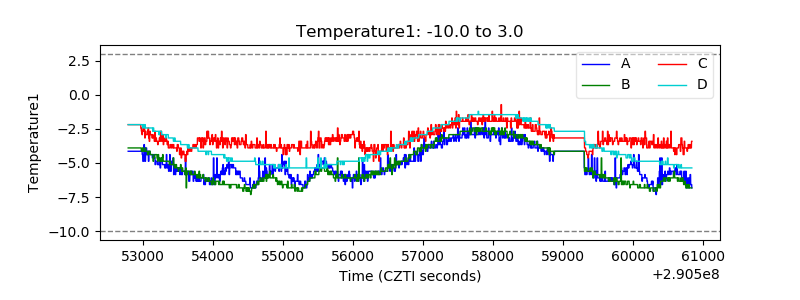 |
| Veto HV Monitor | 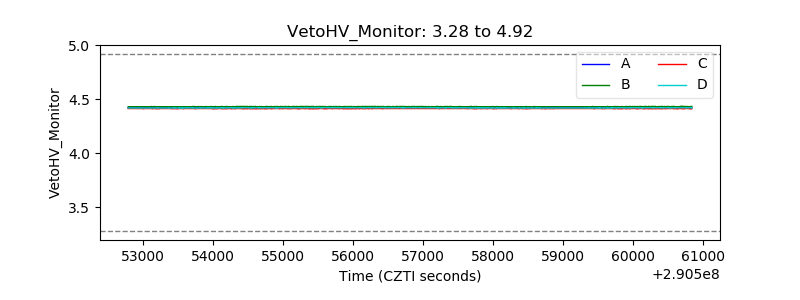 |
| Veto LLD | 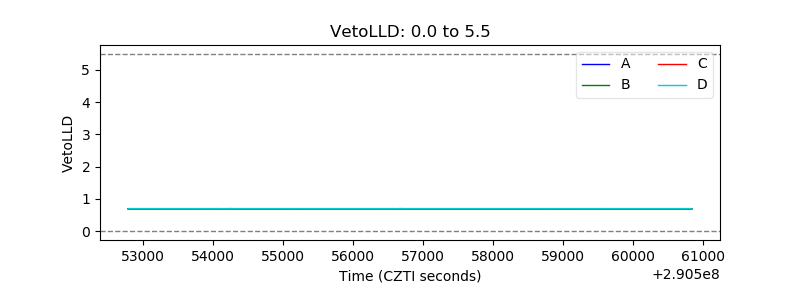 |
| Alpha Counter | 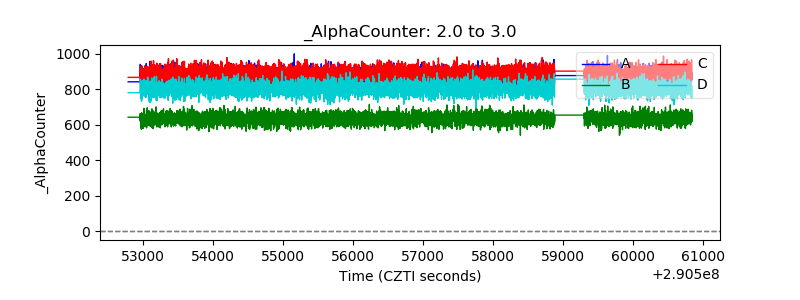 |
| _CPM_Rate |  |
| CZT Counter | 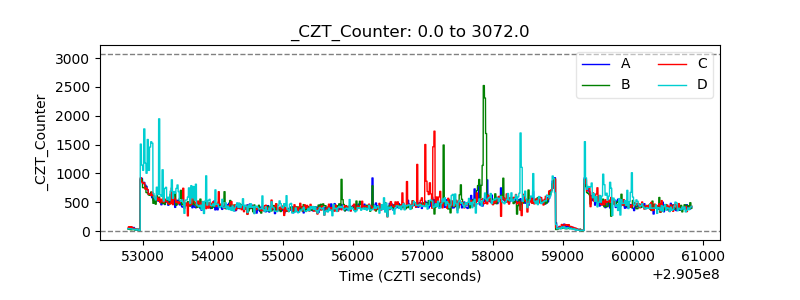 |
| +2.5 Volts monitor | 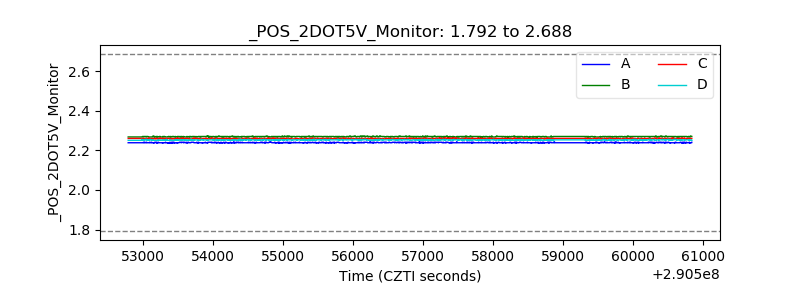 |
| +5 Volts monitor | 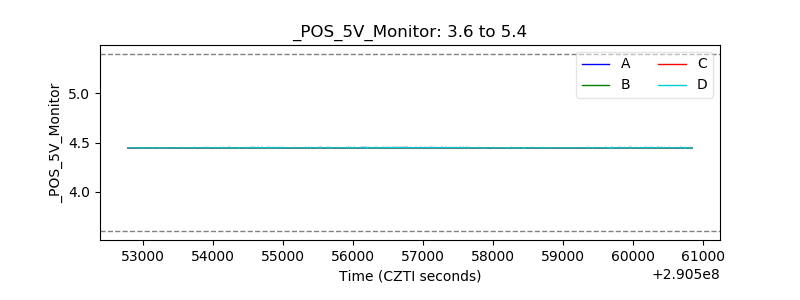 |
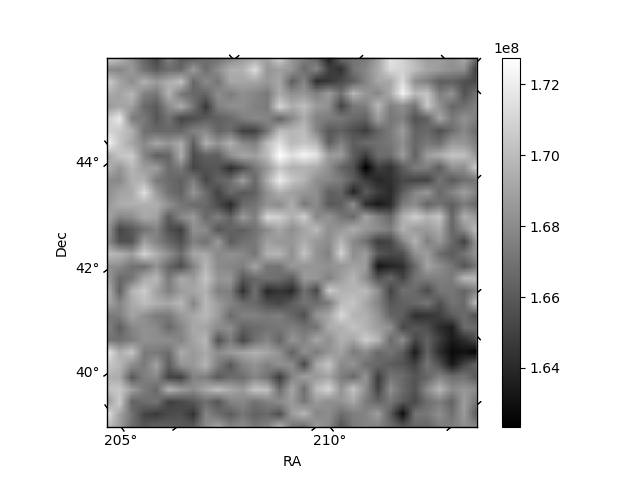
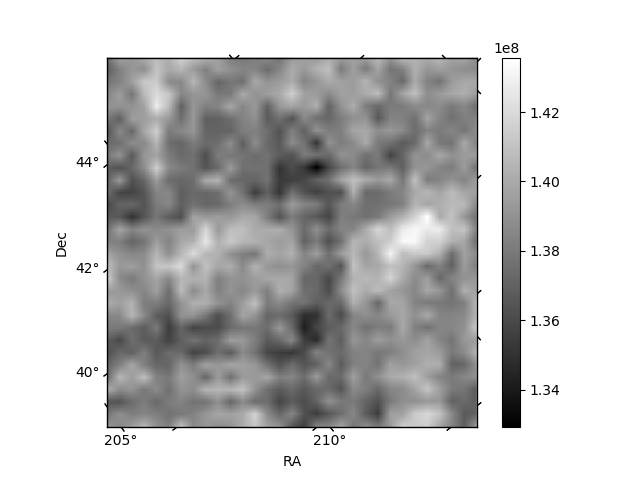
| _ROLL_ROT | 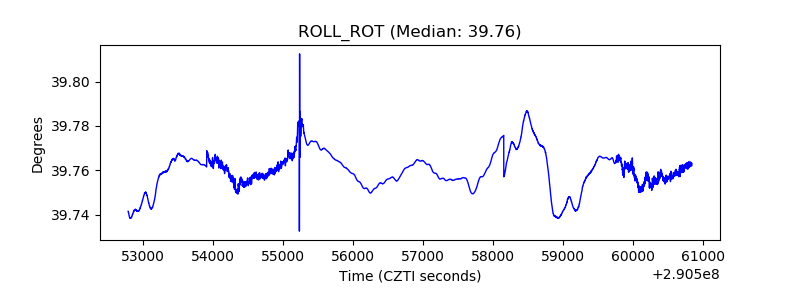 |
| _Roll_DEC | 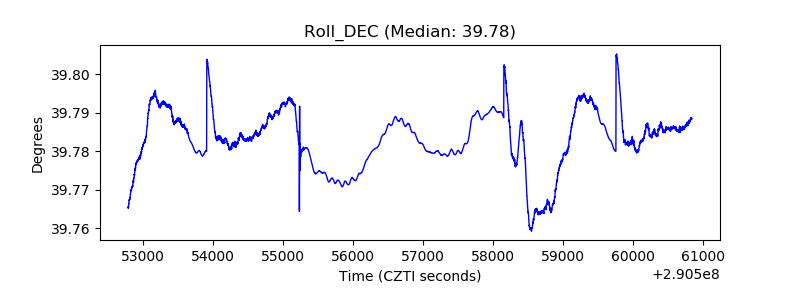 |
| _Roll_RA | 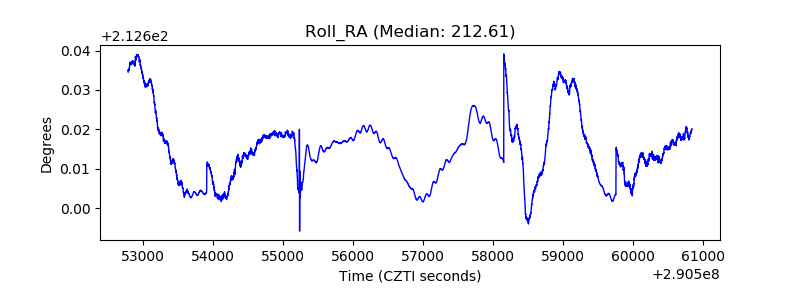 |
| Veto Counter | 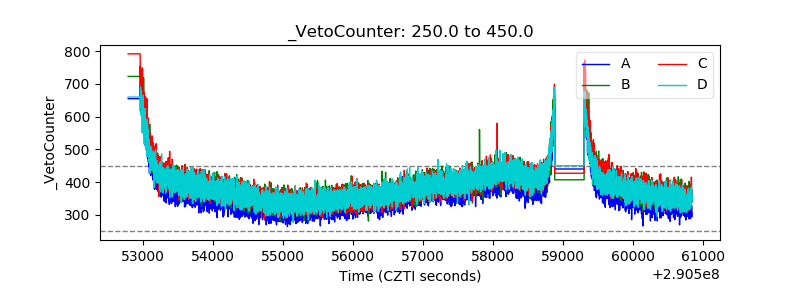 |