| Param | Original file | Final file |
|---|---|---|
| Filename | modeM0/AS1A05_156T01_9000002804_18752cztM0_level2.evt | modeM0/AS1A05_156T01_9000002804_18752cztM0_level2_quad_clean.evt |
| Size (bytes) | 805,121,280 | 150,154,560 |
| Size | 767.8 MB | 143.2 MB |
| Events in quadrant A | 5,579,426 | 935,633 |
| Events in quadrant B | 5,711,932 | 950,998 |
| Events in quadrant C | 5,852,202 | 923,536 |
| Events in quadrant D | 6,427,992 | 908,931 |
| Mode M0 | |||
|---|---|---|---|
| Quadrant | BADHDUFLAG | Total packets | Discarded packets |
| A | 0 | 24688 | 2 |
| B | 0 | 24951 | 2 |
| C | 0 | 25495 | 2 |
| D | 0 | 27740 | 2 |
| Mode M9 | |||
|---|---|---|---|
| Quadrant | BADHDUFLAG | Total packets | Discarded packets |
| A | 0 | 12 | 0 |
| B | 0 | 12 | 0 |
| C | 0 | 12 | 0 |
| D | 0 | 12 | 0 |
| Mode SS | |||
|---|---|---|---|
| Quadrant | BADHDUFLAG | Total packets | Discarded packets |
| A | 0 | 244 | 0 |
| B | 0 | 244 | 0 |
| C | 0 | 244 | 0 |
| D | 0 | 244 | 0 |
| Quadrant | Total seconds | Saturated seconds | Saturation percentage |
|---|---|---|---|
| A | 11985 | 87 | 0.725907% |
| B | 11985 | 109 | 0.909470% |
| C | 11985 | 156 | 1.301627% |
| D | 11985 | 206 | 1.718815% |
Noise dominated data is calculated using 1-second bins in cleaned event files. If a bin has >2000 counts, and if more than 50% of those come from <1% of pixels, then it is considered to be noise-dominated and hence unusable.
| Quadrant | # 1 sec bins | Bins with >0 counts | Bins with >2000 counts | High rate bins dominated by noise | Noise dominated (total time) | Noise dominated (detector-on time) | Marked lightcurve |
|---|---|---|---|---|---|---|---|
| A | 12946 | 11987 | 2 | 2 | 0.02% | 0.02% | 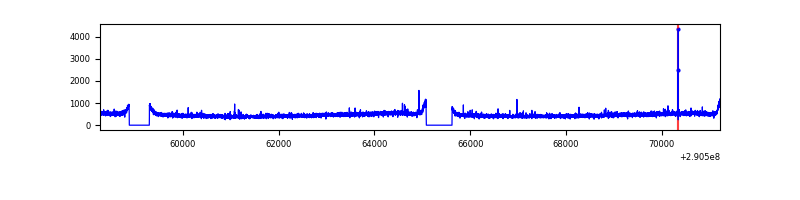 |
| B | 12946 | 11987 | 2 | 2 | 0.02% | 0.02% | 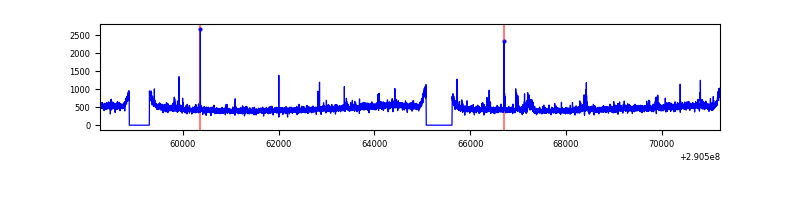 |
| C | 12946 | 11987 | 2 | 2 | 0.02% | 0.02% | 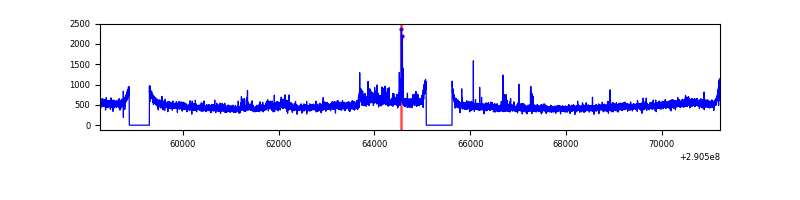 |
| D | 12946 | 11987 | 121 | 121 | 0.93% | 1.01% | 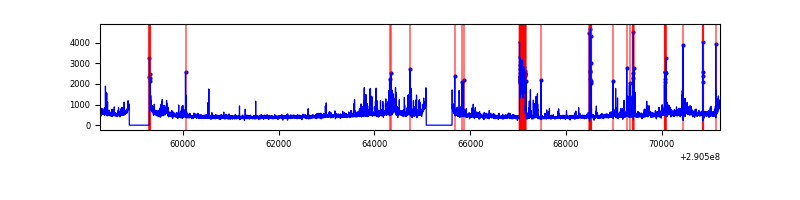 |
Top three noisy pixels from each quadrant. If the there are fewer than three noisy pixels in the level2.evt file, extra rows are filled as -1
| Pixel properties | Quadrant properties | ||||||
|---|---|---|---|---|---|---|---|
| Quadrant | DetID | PixID | Counts | Sigma | Mean | Median | Sigma |
| A | 15 | 192 | 64204 | 217.23 | 1429 | 1397 | 289.1 |
| A | 13 | 254 | 17894 | 57.06 | 1429 | 1397 | 289.1 |
| A | 0 | 226 | 12243 | 37.51 | 1429 | 1397 | 289.1 |
| B | 10 | 245 | 49053 | 174.75 | 1424 | 1387 | 272.8 |
| B | 0 | 230 | 37691 | 133.09 | 1424 | 1387 | 272.8 |
| B | 12 | 111 | 34363 | 120.89 | 1424 | 1387 | 272.8 |
| C | 14 | 238 | 213272 | 656.85 | 1373 | 1381 | 322.6 |
| C | 3 | 233 | 194541 | 598.79 | 1373 | 1381 | 322.6 |
| C | 0 | 239 | 72375 | 220.08 | 1373 | 1381 | 322.6 |
| D | 1 | 52 | 480910 | 1421.12 | 1387 | 1346 | 337.5 |
| D | 13 | 168 | 471523 | 1393.3 | 1387 | 1346 | 337.5 |
| D | 7 | 38 | 157698 | 463.33 | 1387 | 1346 | 337.5 |
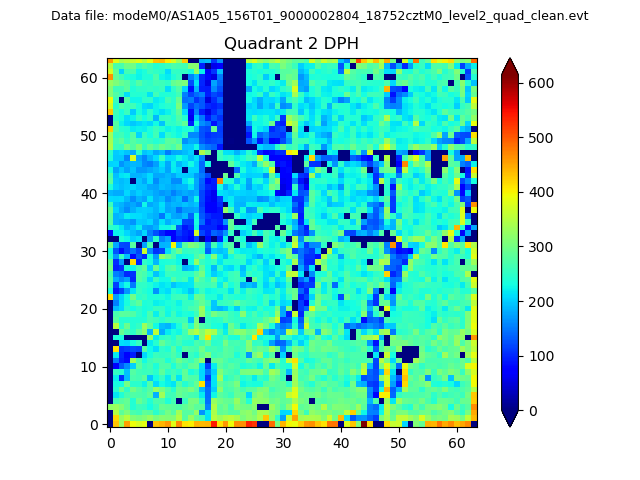
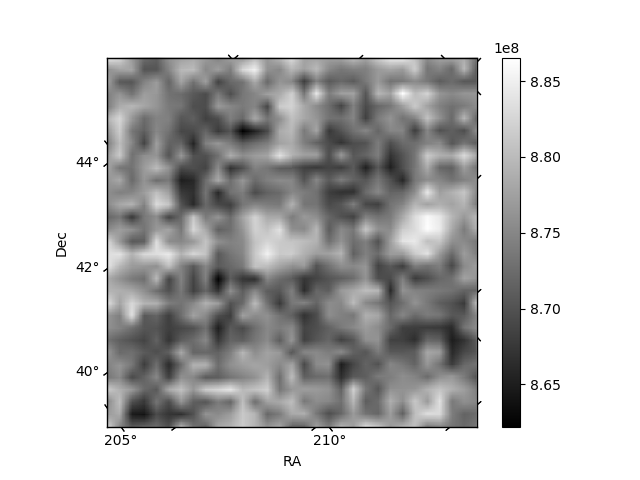
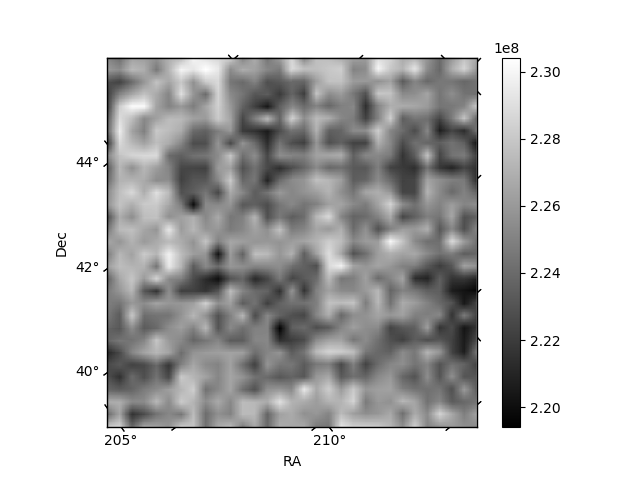
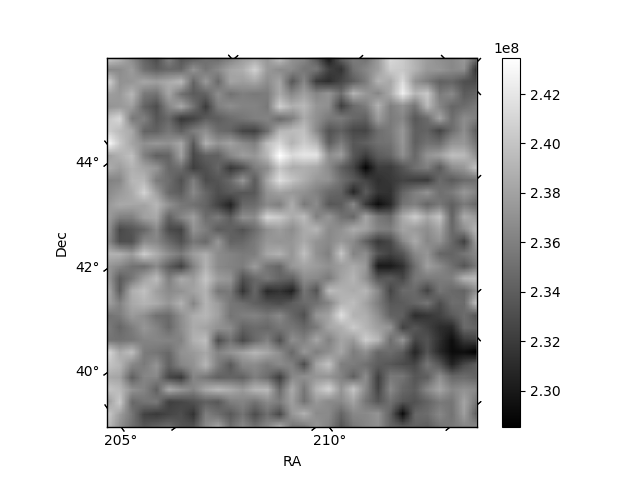
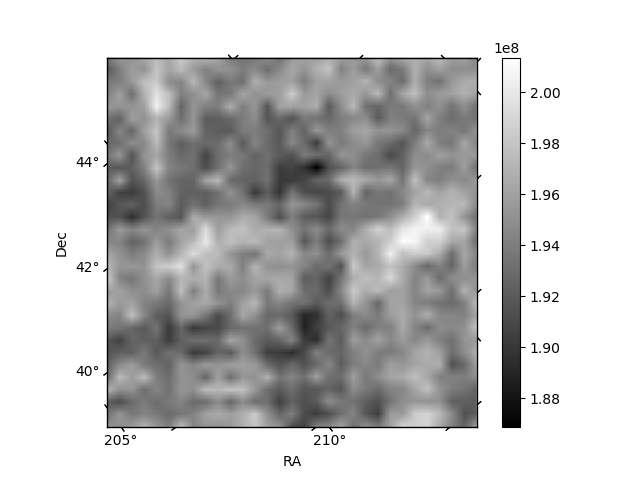
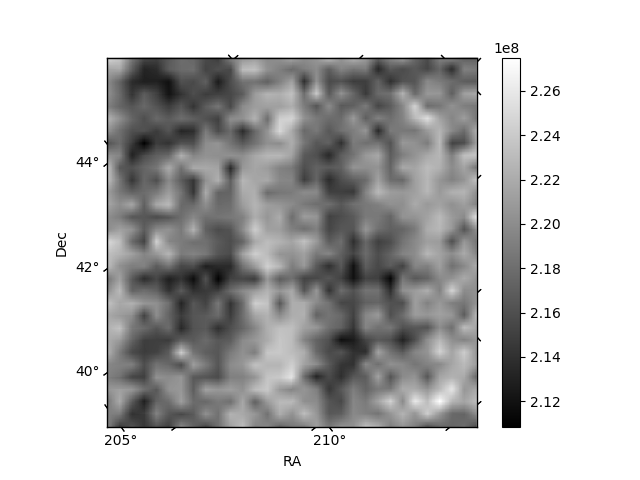
Histogram calculated using DETX and DETY for each event in the final _common_clean file
| Quadrant A | 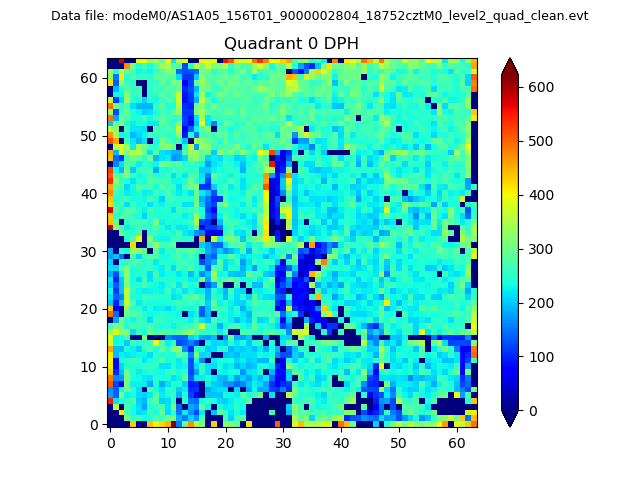 |
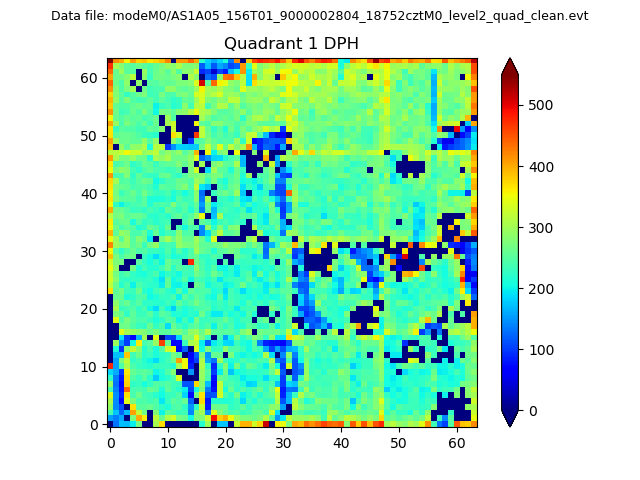 |
Quadrant B |
|---|---|---|---|
| Quadrant D | 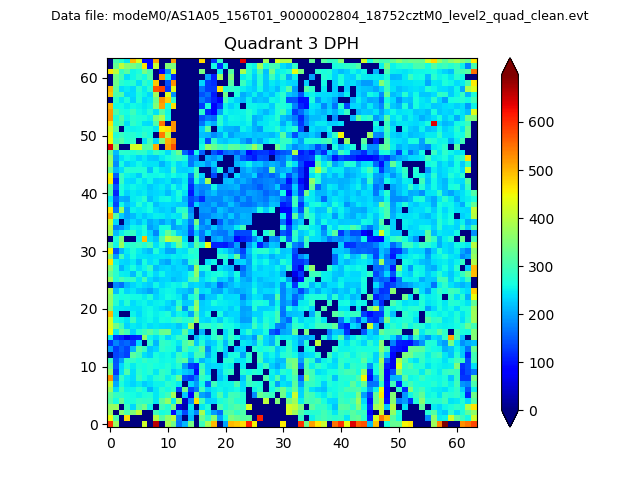 |
 |
Quadrant C |
| Plot type | Count rate plots | Images |
|---|---|---|
| Comparison with Poisson distribution Blue bars denote a histogram of data divided into 1 sec bins. Red curve is a Poisson curve with rate = median count rate of data. |
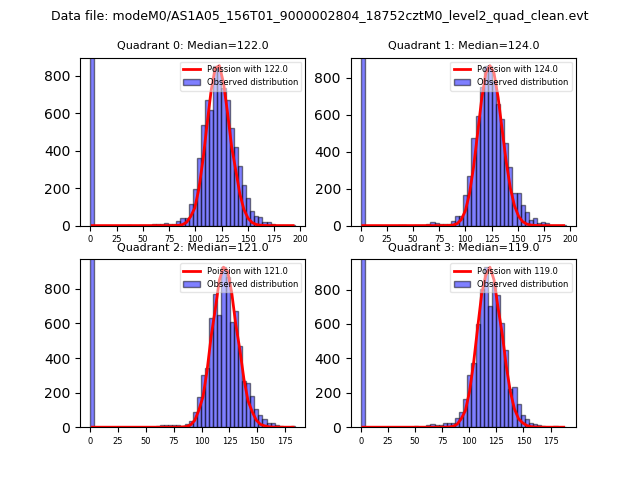 |
 |
| Quadrant-wise count rates Data is divided into 100 sec bins |
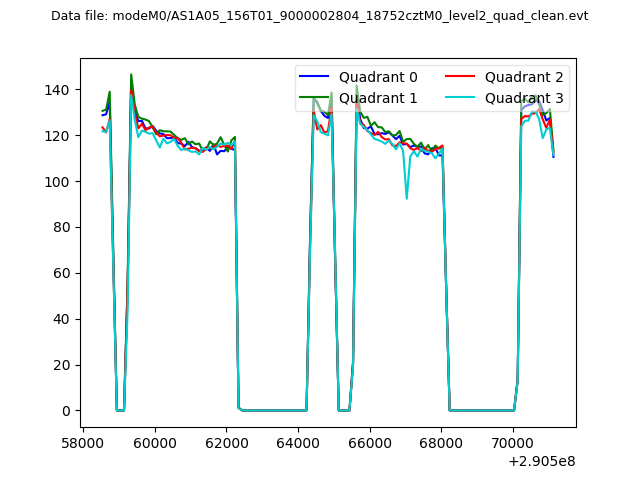 |
|
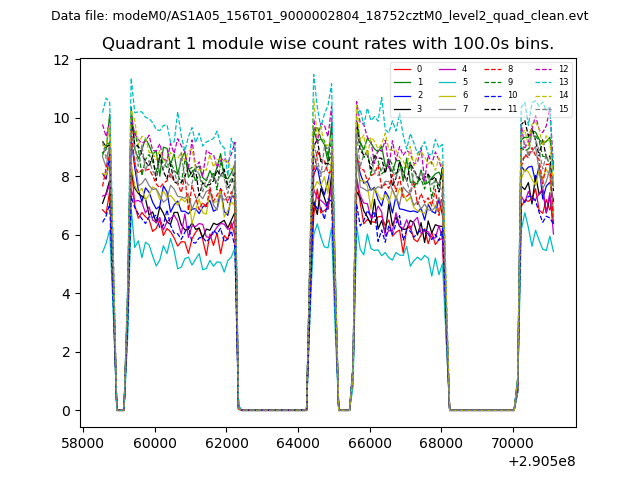
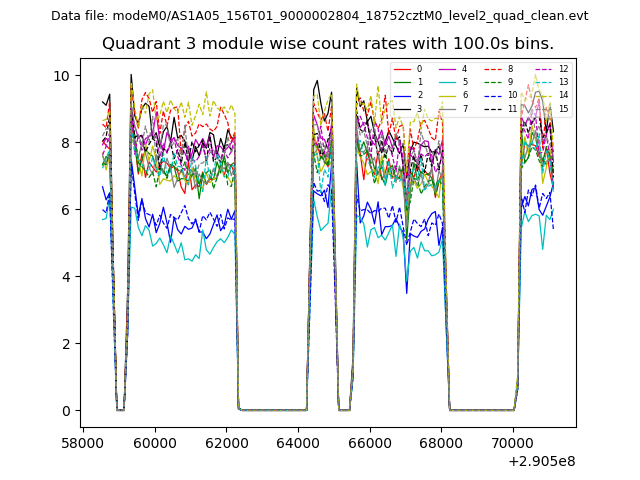
| Module-wise count rates for Quadrant A Data is divided into 100 sec bins |
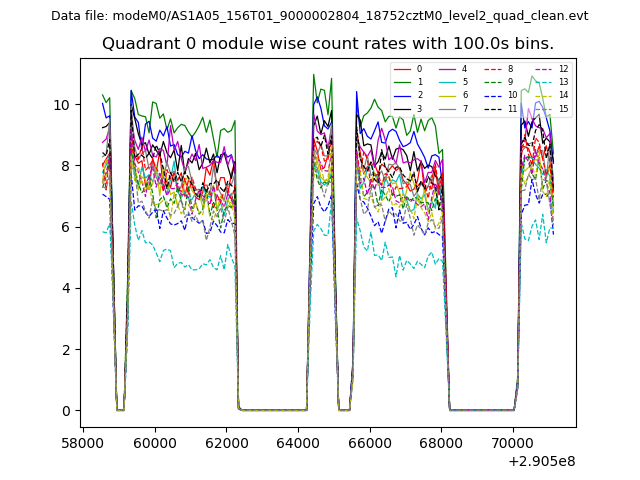 |
 |
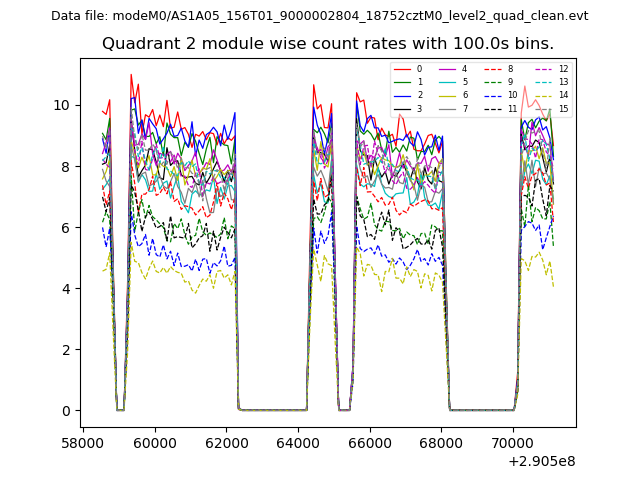
| Module-wise count rates for Quadrant B Data is divided into 100 sec bins |
 |
 |
| Module-wise count rates for Quadrant C Data is divided into 100 sec bins |
 |
 |
| Module-wise count rates for Quadrant D Data is divided into 100 sec bins |
 |
 |
| Parameter | Plot |
|---|---|
| CZT HV Monitor | 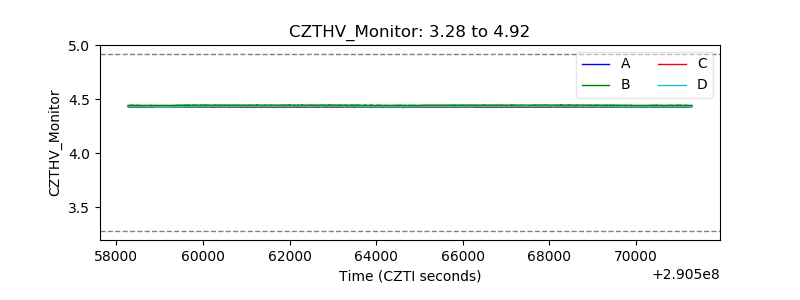 |
| D_VDD | 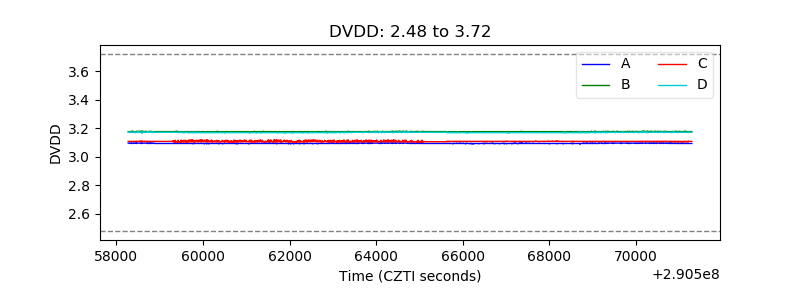 |
| Temperature 1 | 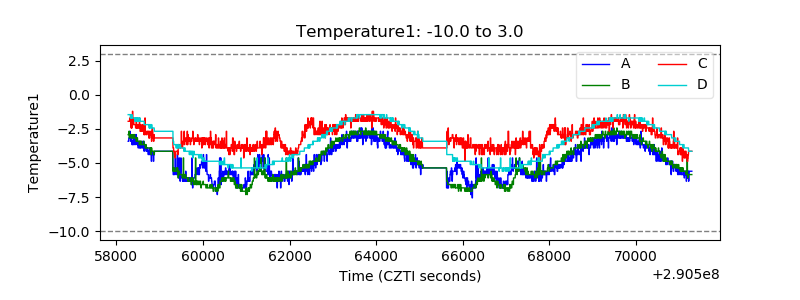 |
| Veto HV Monitor | 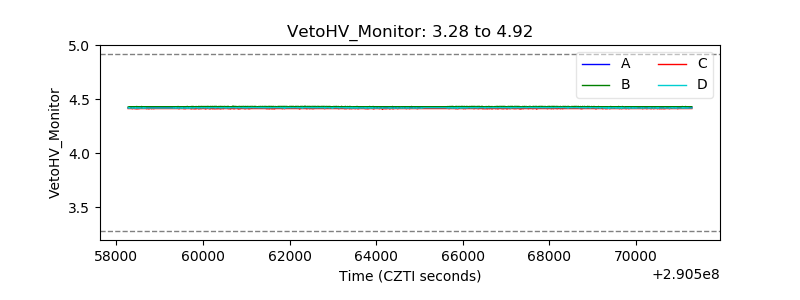 |
| Veto LLD | 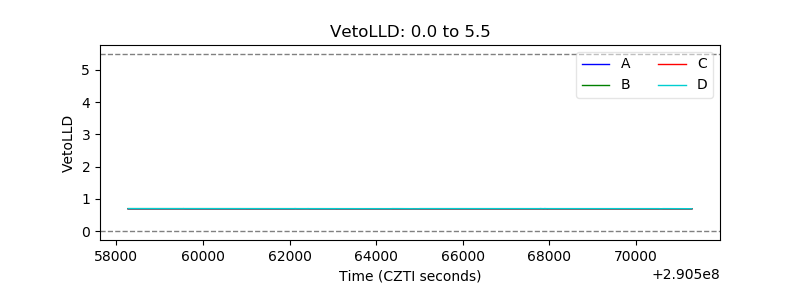 |
| Alpha Counter | 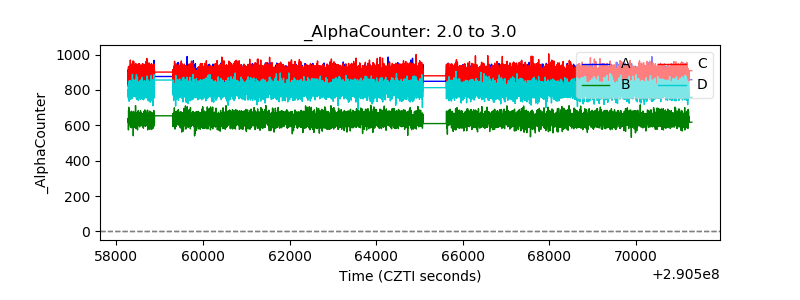 |
| _CPM_Rate | 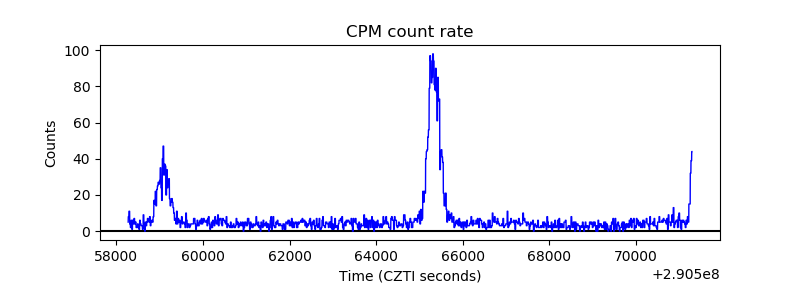 |
| CZT Counter |  |
| +2.5 Volts monitor |  |
| +5 Volts monitor |  |
| _ROLL_ROT | 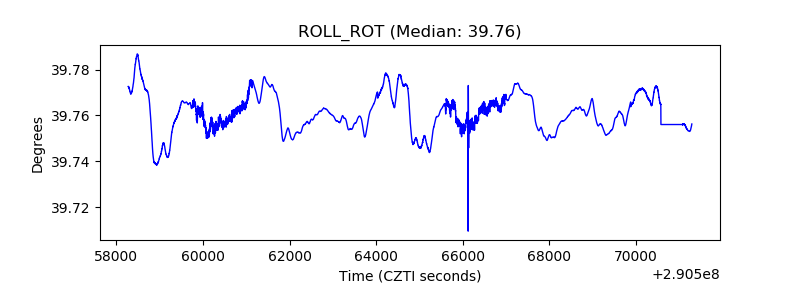 |
| _Roll_DEC | 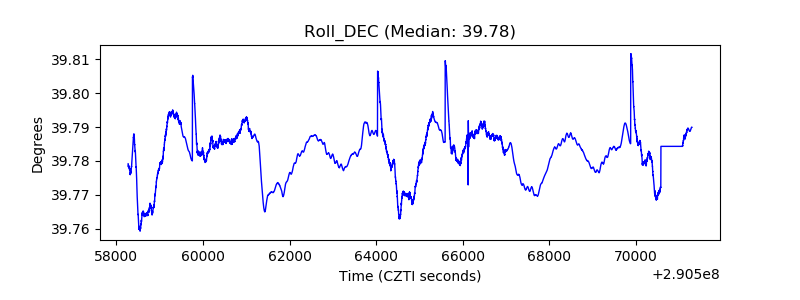 |
| _Roll_RA | 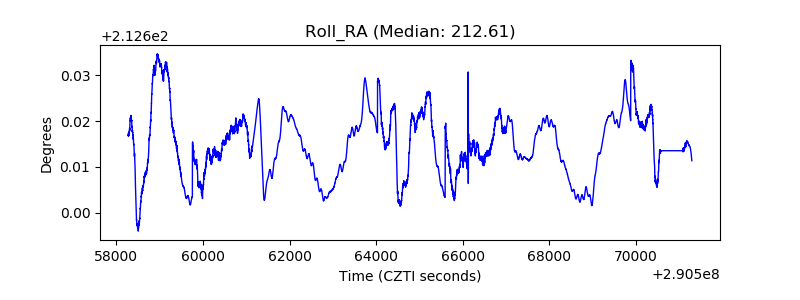 |
| Veto Counter | 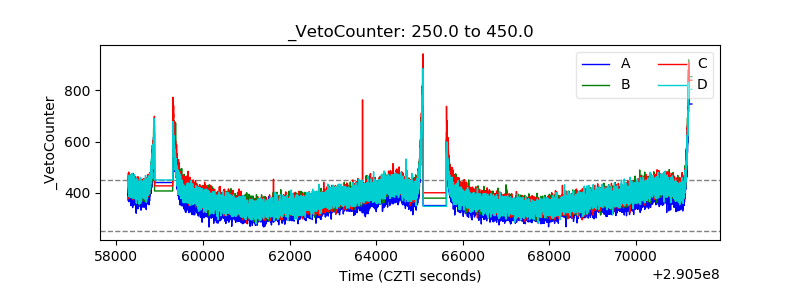 |