| Param | Original file | Final file |
|---|---|---|
| Filename | modeM0/AS1A05_156T01_9000002804_18753cztM0_level2.evt | modeM0/AS1A05_156T01_9000002804_18753cztM0_level2_quad_clean.evt |
| Size (bytes) | 500,405,760 | 111,047,040 |
| Size | 477.2 MB | 105.9 MB |
| Events in quadrant A | 3,628,578 | 714,921 |
| Events in quadrant B | 3,646,346 | 724,223 |
| Events in quadrant C | 3,635,640 | 701,360 |
| Events in quadrant D | 3,724,426 | 690,522 |
| Mode M0 | |||
|---|---|---|---|
| Quadrant | BADHDUFLAG | Total packets | Discarded packets |
| A | 0 | 15722 | 2 |
| B | 0 | 15793 | 2 |
| C | 0 | 15844 | 2 |
| D | 0 | 16540 | 2 |
| Mode M9 | |||
|---|---|---|---|
| Quadrant | BADHDUFLAG | Total packets | Discarded packets |
| A | 0 | 16 | 0 |
| B | 0 | 16 | 0 |
| C | 0 | 16 | 0 |
| D | 0 | 16 | 0 |
| Mode SS | |||
|---|---|---|---|
| Quadrant | BADHDUFLAG | Total packets | Discarded packets |
| A | 0 | 156 | 0 |
| B | 0 | 156 | 0 |
| C | 0 | 156 | 0 |
| D | 0 | 156 | 0 |
| Quadrant | Total seconds | Saturated seconds | Saturation percentage |
|---|---|---|---|
| A | 7654 | 66 | 0.862294% |
| B | 7654 | 97 | 1.267311% |
| C | 7654 | 106 | 1.384897% |
| D | 7654 | 74 | 0.966815% |
Noise dominated data is calculated using 1-second bins in cleaned event files. If a bin has >2000 counts, and if more than 50% of those come from <1% of pixels, then it is considered to be noise-dominated and hence unusable.
| Quadrant | # 1 sec bins | Bins with >0 counts | Bins with >2000 counts | High rate bins dominated by noise | Noise dominated (total time) | Noise dominated (detector-on time) | Marked lightcurve |
|---|---|---|---|---|---|---|---|
| A | 9184 | 7656 | 0 | 0 | 0.00% | 0.00% | 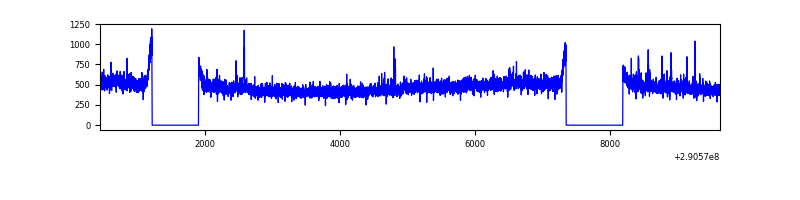 |
| B | 9184 | 7656 | 1 | 1 | 0.01% | 0.01% | 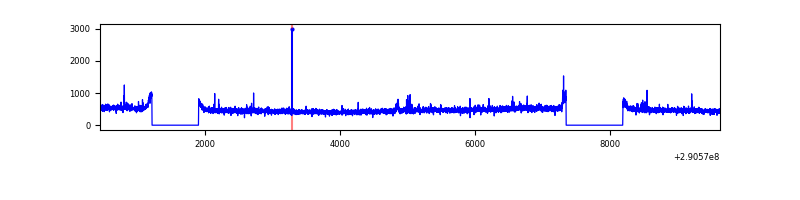 |
| C | 9184 | 7656 | 5 | 5 | 0.05% | 0.07% | 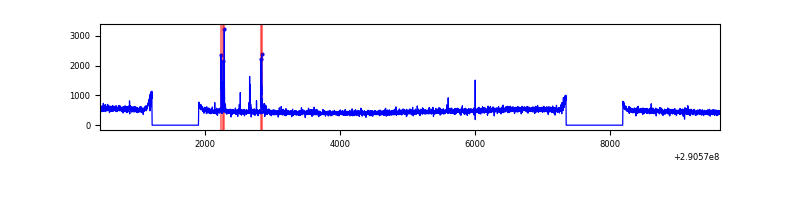 |
| D | 9184 | 7656 | 20 | 20 | 0.22% | 0.26% |  |
Top three noisy pixels from each quadrant. If the there are fewer than three noisy pixels in the level2.evt file, extra rows are filled as -1
| Pixel properties | Quadrant properties | ||||||
|---|---|---|---|---|---|---|---|
| Quadrant | DetID | PixID | Counts | Sigma | Mean | Median | Sigma |
| A | 15 | 192 | 53304 | 284.14 | 917 | 898 | 184.4 |
| A | 8 | 205 | 26850 | 140.71 | 917 | 898 | 184.4 |
| A | 13 | 254 | 11400 | 56.94 | 917 | 898 | 184.4 |
| B | 12 | 111 | 21689 | 117.99 | 915 | 893 | 176.3 |
| B | 11 | 111 | 19167 | 103.68 | 915 | 893 | 176.3 |
| B | 14 | 111 | 16277 | 87.28 | 915 | 893 | 176.3 |
| C | 14 | 238 | 136442 | 652.58 | 883 | 890 | 207.7 |
| C | 5 | 112 | 52944 | 250.6 | 883 | 890 | 207.7 |
| C | 13 | 61 | 6194 | 25.53 | 883 | 890 | 207.7 |
| D | 1 | 52 | 203458 | 932.67 | 890 | 863 | 217.2 |
| D | 13 | 168 | 69536 | 316.14 | 890 | 863 | 217.2 |
| D | 7 | 96 | 41448 | 186.84 | 890 | 863 | 217.2 |
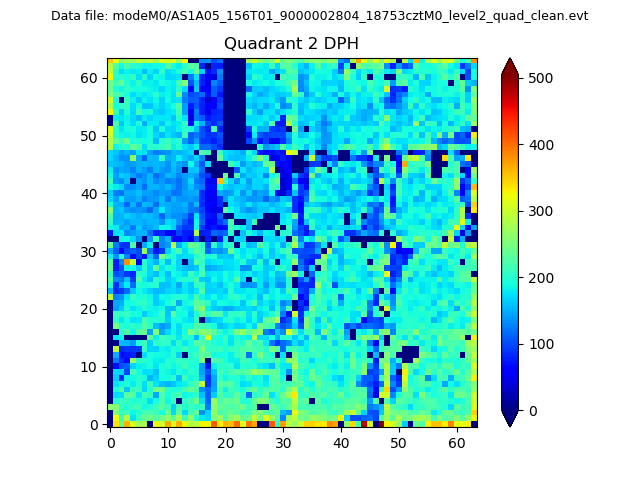
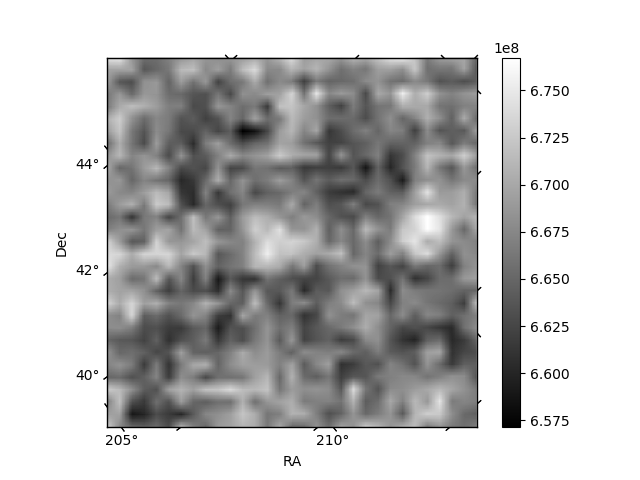
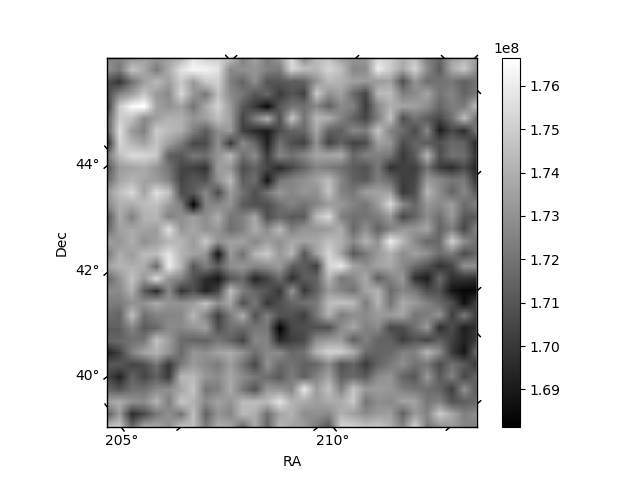
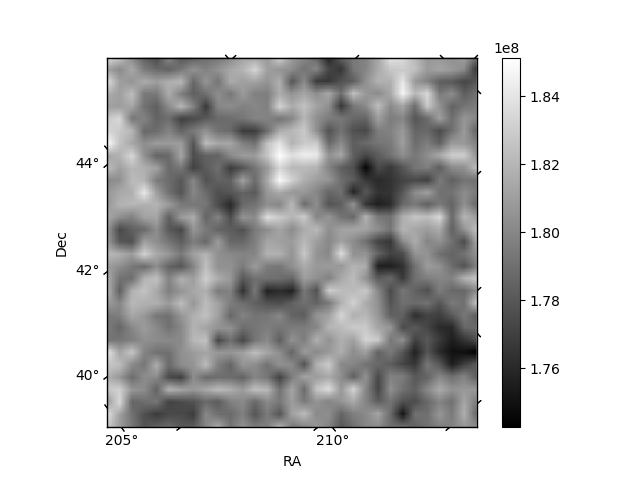
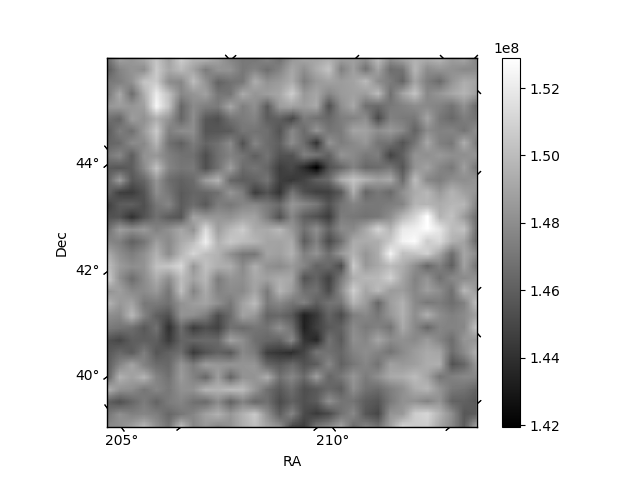
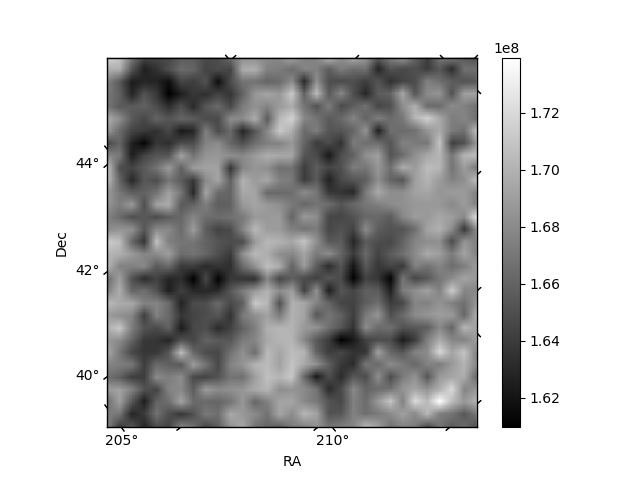
Histogram calculated using DETX and DETY for each event in the final _common_clean file
| Quadrant A | 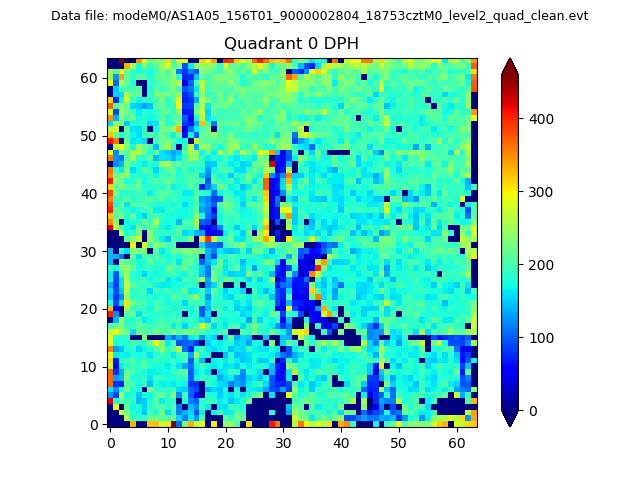 |
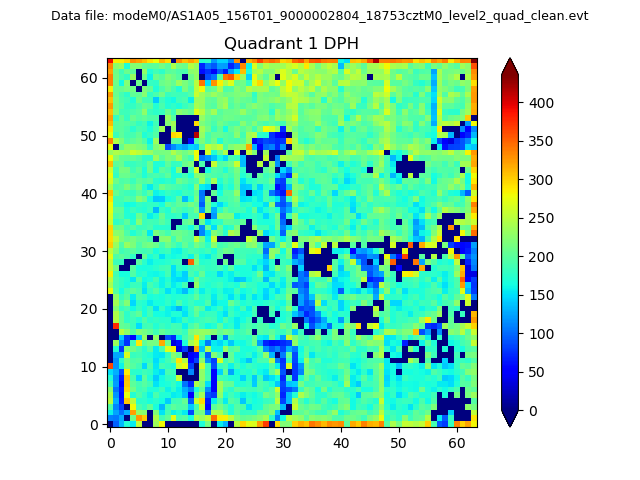 |
Quadrant B |
|---|---|---|---|
| Quadrant D | 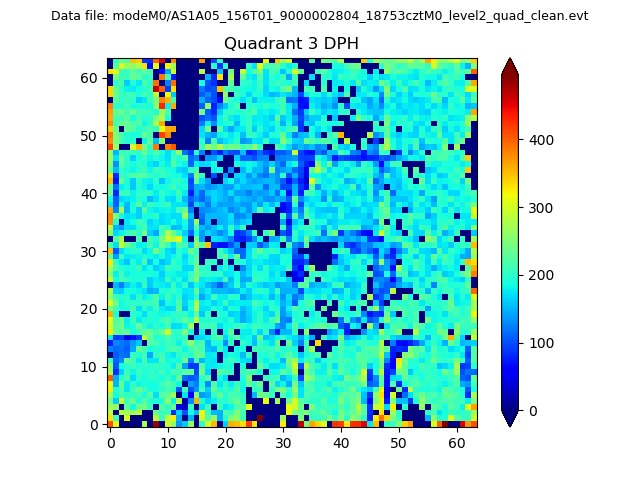 |
 |
Quadrant C |
| Plot type | Count rate plots | Images |
|---|---|---|
| Comparison with Poisson distribution Blue bars denote a histogram of data divided into 1 sec bins. Red curve is a Poisson curve with rate = median count rate of data. |
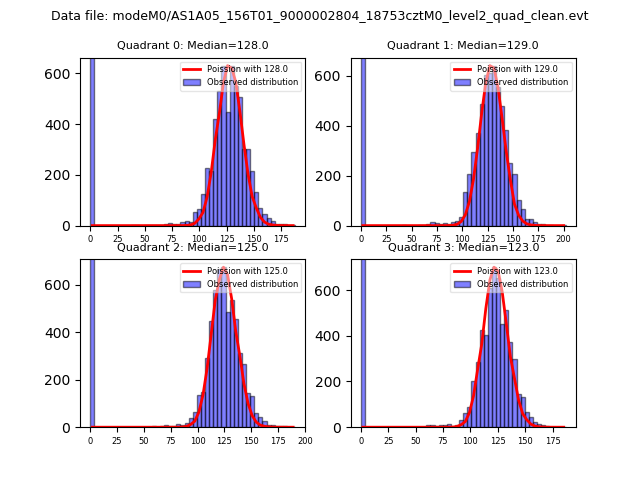 |
 |
| Quadrant-wise count rates Data is divided into 100 sec bins |
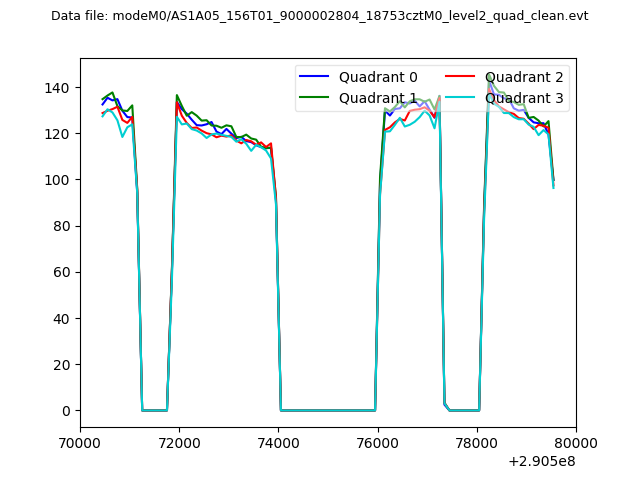 |
|
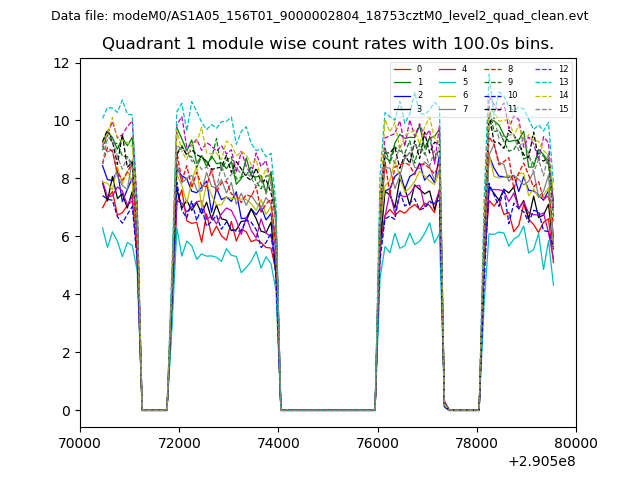
| Module-wise count rates for Quadrant A Data is divided into 100 sec bins |
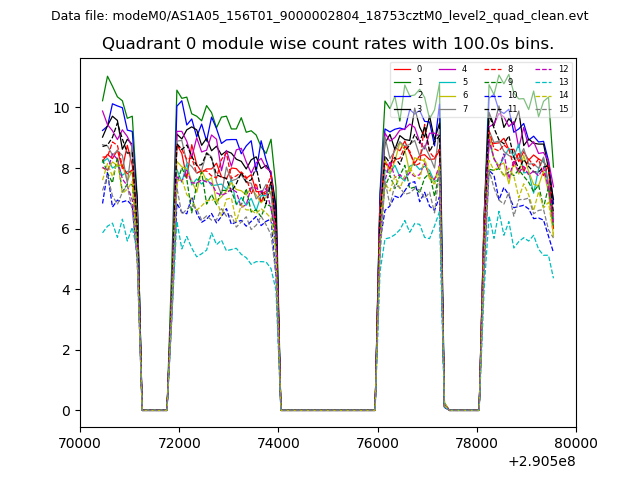 |
 |
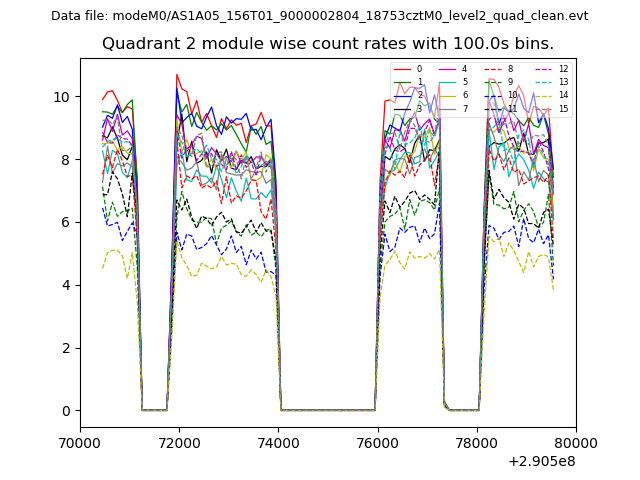
| Module-wise count rates for Quadrant B Data is divided into 100 sec bins |
 |
 |
| Module-wise count rates for Quadrant C Data is divided into 100 sec bins |
 |
 |
| Module-wise count rates for Quadrant D Data is divided into 100 sec bins |
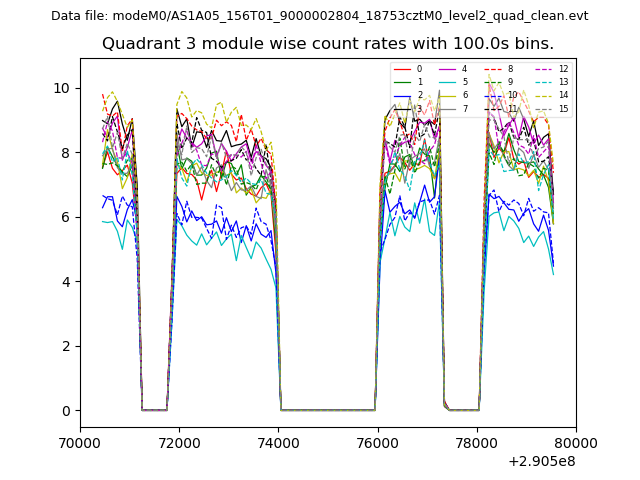 |
 |
| Parameter | Plot |
|---|---|
| CZT HV Monitor | 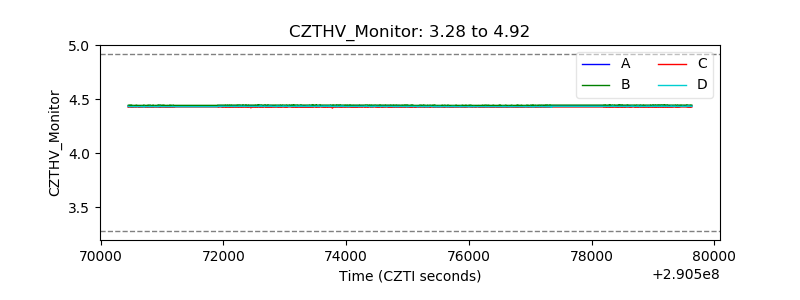 |
| D_VDD | 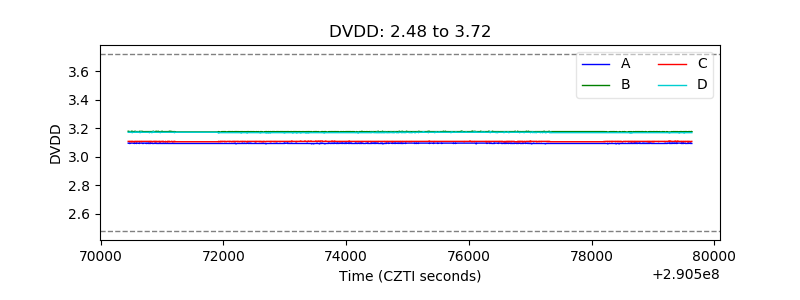 |
| Temperature 1 | 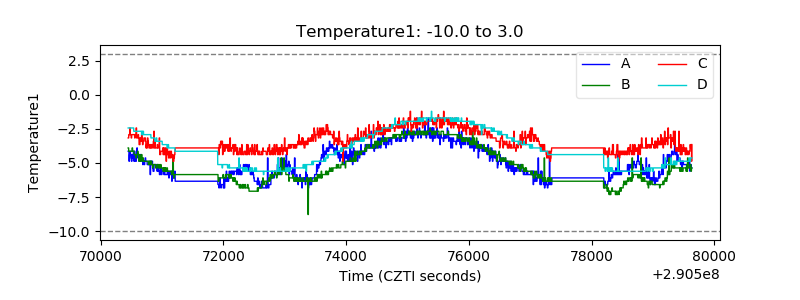 |
| Veto HV Monitor | 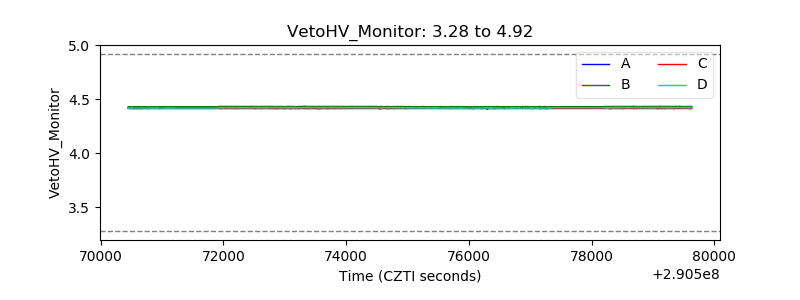 |
| Veto LLD | 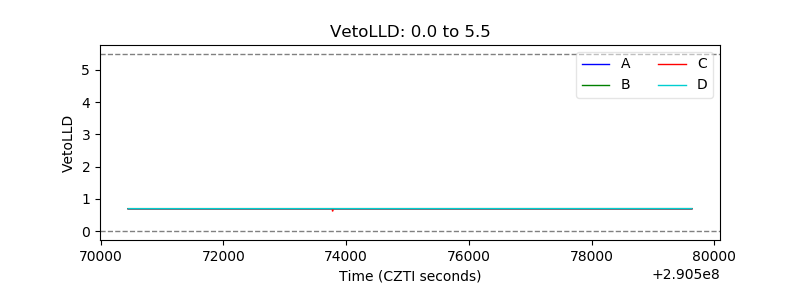 |
| Alpha Counter | 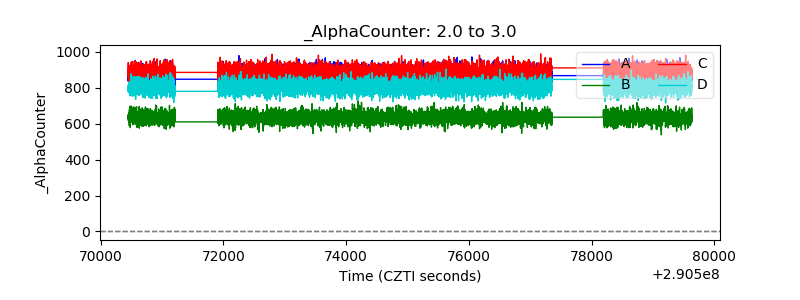 |
| _CPM_Rate |  |
| CZT Counter | 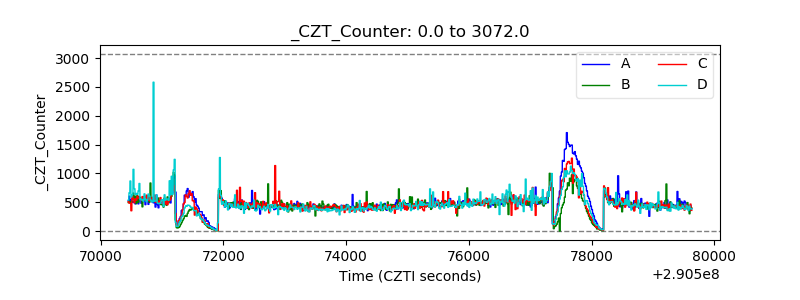 |
| +2.5 Volts monitor |  |
| +5 Volts monitor |  |
| _ROLL_ROT | 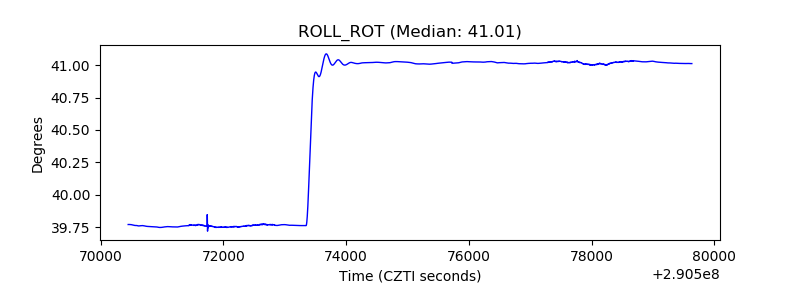 |
| _Roll_DEC | 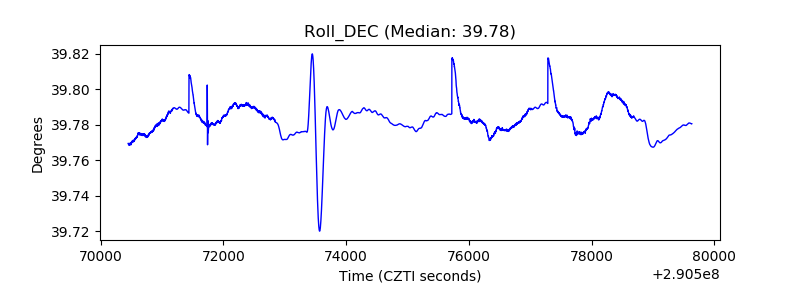 |
| _Roll_RA | 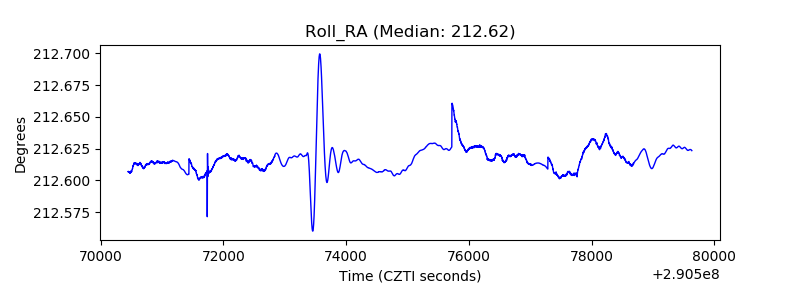 |
| Veto Counter | 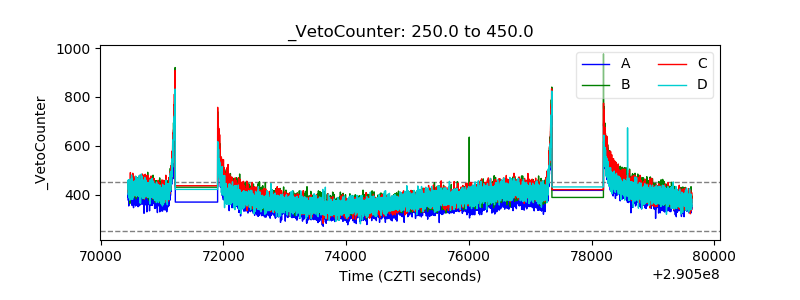 |