| Param | Original file | Final file |
|---|---|---|
| Filename | modeM0/AS1A05_156T01_9000002804_18754cztM0_level2.evt | modeM0/AS1A05_156T01_9000002804_18754cztM0_level2_quad_clean.evt |
| Size (bytes) | 430,090,560 | 93,726,720 |
| Size | 410.2 MB | 89.4 MB |
| Events in quadrant A | 3,144,768 | 599,293 |
| Events in quadrant B | 3,216,961 | 609,727 |
| Events in quadrant C | 3,096,803 | 585,277 |
| Events in quadrant D | 3,115,666 | 581,845 |
| Mode M0 | |||
|---|---|---|---|
| Quadrant | BADHDUFLAG | Total packets | Discarded packets |
| A | 0 | 13550 | 2 |
| B | 0 | 13747 | 2 |
| C | 0 | 13466 | 2 |
| D | 0 | 13753 | 2 |
| Mode M9 | |||
|---|---|---|---|
| Quadrant | BADHDUFLAG | Total packets | Discarded packets |
| A | 0 | 16 | 0 |
| B | 0 | 17 | 0 |
| C | 0 | 17 | 0 |
| D | 0 | 17 | 0 |
| Mode SS | |||
|---|---|---|---|
| Quadrant | BADHDUFLAG | Total packets | Discarded packets |
| A | 0 | 134 | 0 |
| B | 0 | 134 | 0 |
| C | 0 | 134 | 0 |
| D | 0 | 134 | 0 |
| Quadrant | Total seconds | Saturated seconds | Saturation percentage |
|---|---|---|---|
| A | 6633 | 44 | 0.663350% |
| B | 6633 | 56 | 0.844264% |
| C | 6633 | 58 | 0.874416% |
| D | 6633 | 34 | 0.512589% |
Noise dominated data is calculated using 1-second bins in cleaned event files. If a bin has >2000 counts, and if more than 50% of those come from <1% of pixels, then it is considered to be noise-dominated and hence unusable.
| Quadrant | # 1 sec bins | Bins with >0 counts | Bins with >2000 counts | High rate bins dominated by noise | Noise dominated (total time) | Noise dominated (detector-on time) | Marked lightcurve |
|---|---|---|---|---|---|---|---|
| A | 7633 | 6634 | 0 | 0 | 0.00% | 0.00% | 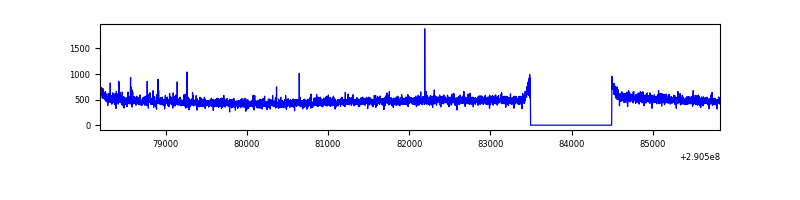 |
| B | 7633 | 6634 | 2 | 2 | 0.03% | 0.03% | 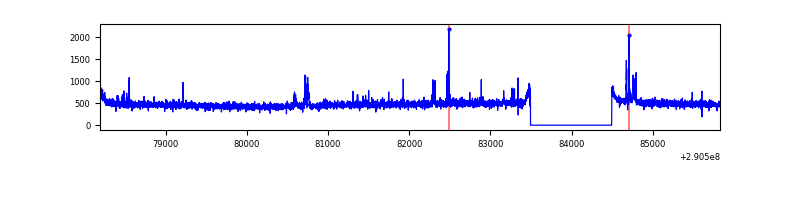 |
| C | 7633 | 6634 | 0 | 0 | 0.00% | 0.00% | 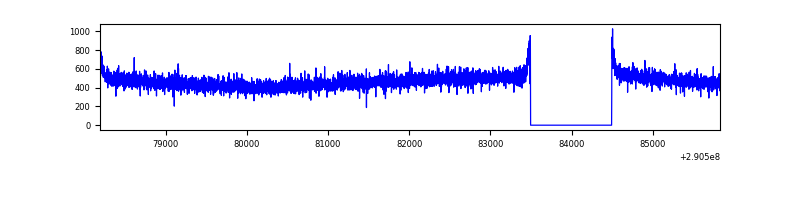 |
| D | 7633 | 6634 | 6 | 6 | 0.08% | 0.09% | 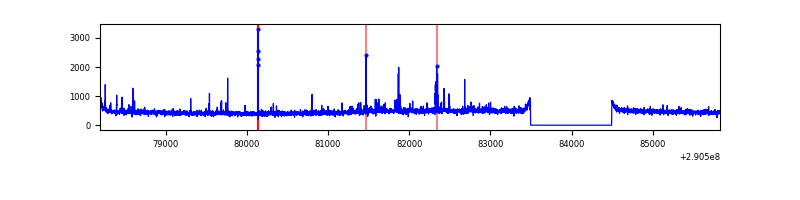 |
Top three noisy pixels from each quadrant. If the there are fewer than three noisy pixels in the level2.evt file, extra rows are filled as -1
| Pixel properties | Quadrant properties | ||||||
|---|---|---|---|---|---|---|---|
| Quadrant | DetID | PixID | Counts | Sigma | Mean | Median | Sigma |
| A | 15 | 192 | 35014 | 211.52 | 804 | 787 | 161.8 |
| A | 13 | 254 | 9204 | 52.02 | 804 | 787 | 161.8 |
| A | 11 | 29 | 8816 | 49.62 | 804 | 787 | 161.8 |
| B | 3 | 64 | 27016 | 171.98 | 799 | 780 | 152.6 |
| B | 4 | 216 | 21930 | 138.64 | 799 | 780 | 152.6 |
| B | 12 | 111 | 18438 | 115.75 | 799 | 780 | 152.6 |
| C | 14 | 238 | 118702 | 662.54 | 763 | 766 | 178.0 |
| C | 13 | 61 | 5482 | 26.49 | 763 | 766 | 178.0 |
| C | 7 | 220 | 2304 | 8.64 | 763 | 766 | 178.0 |
| D | 1 | 52 | 83541 | 436.79 | 777 | 753 | 189.5 |
| D | 13 | 168 | 73529 | 383.97 | 777 | 753 | 189.5 |
| D | 2 | 234 | 25834 | 132.33 | 777 | 753 | 189.5 |
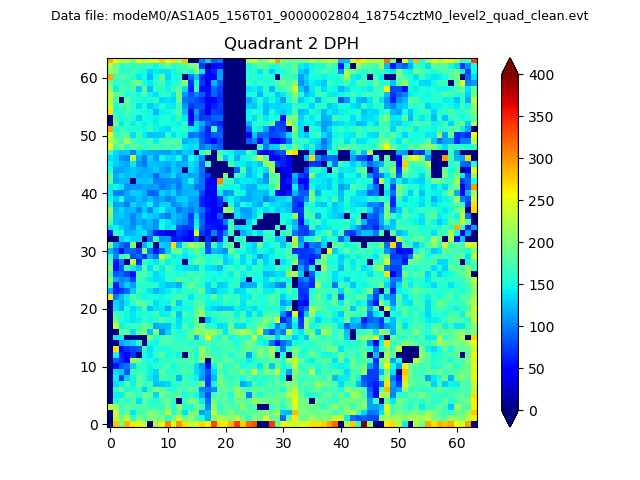
Histogram calculated using DETX and DETY for each event in the final _common_clean file
| Quadrant A | 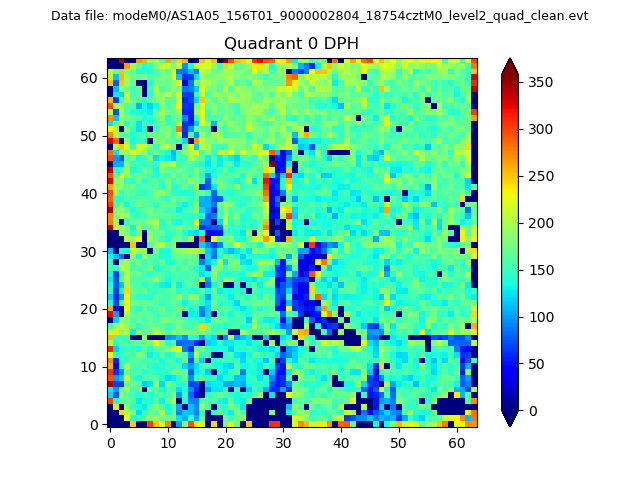 |
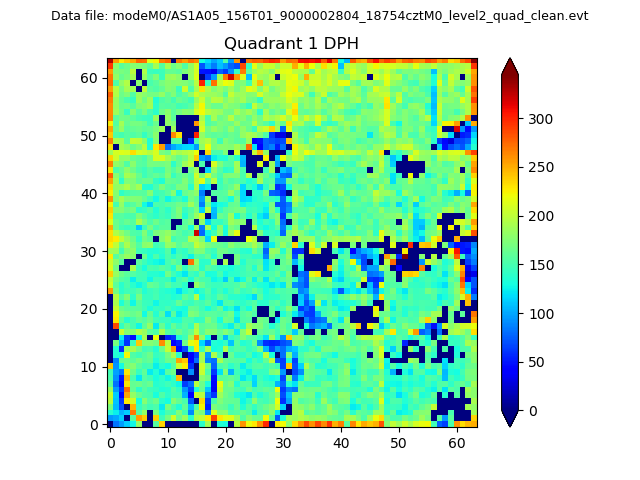 |
Quadrant B |
|---|---|---|---|
| Quadrant D | 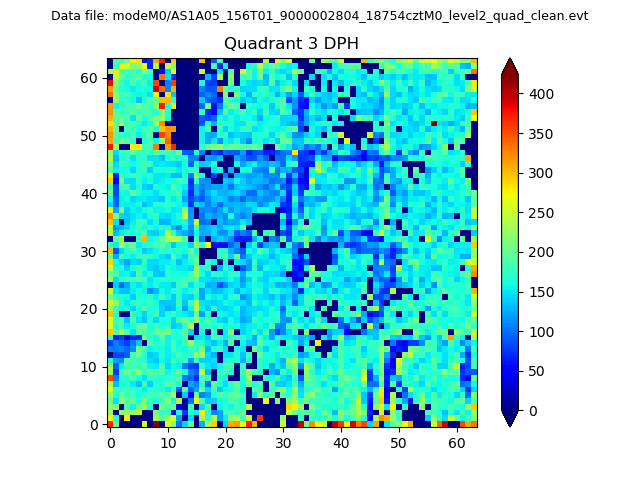 |
 |
Quadrant C |
| Plot type | Count rate plots | Images |
|---|---|---|
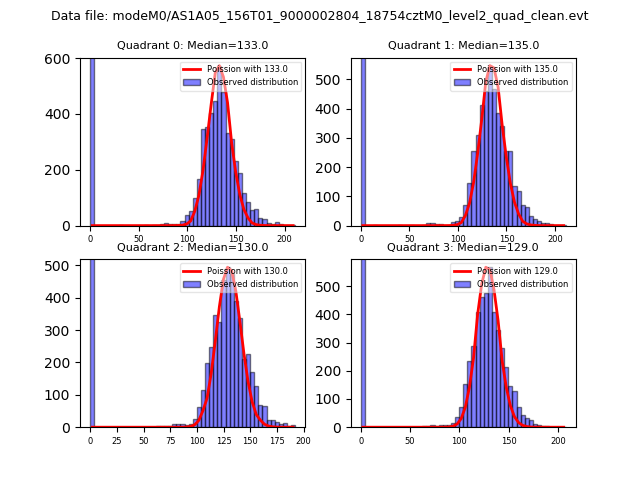
| Comparison with Poisson distribution Blue bars denote a histogram of data divided into 1 sec bins. Red curve is a Poisson curve with rate = median count rate of data. |
 |
 |
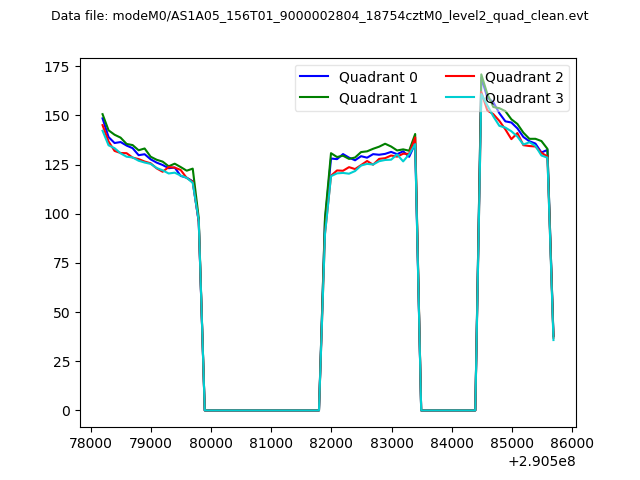
| Quadrant-wise count rates Data is divided into 100 sec bins |
 |
|
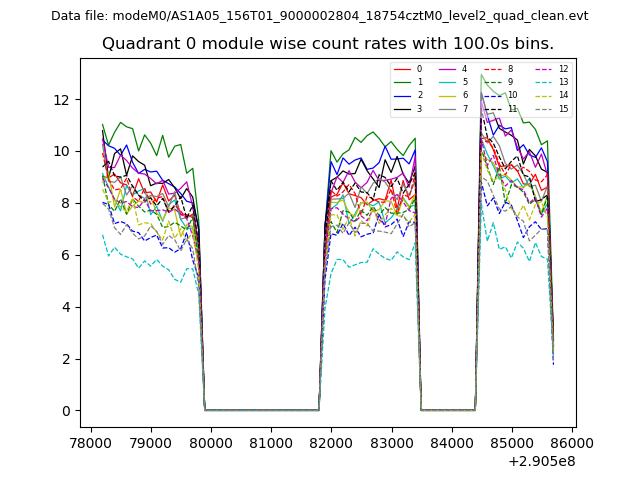
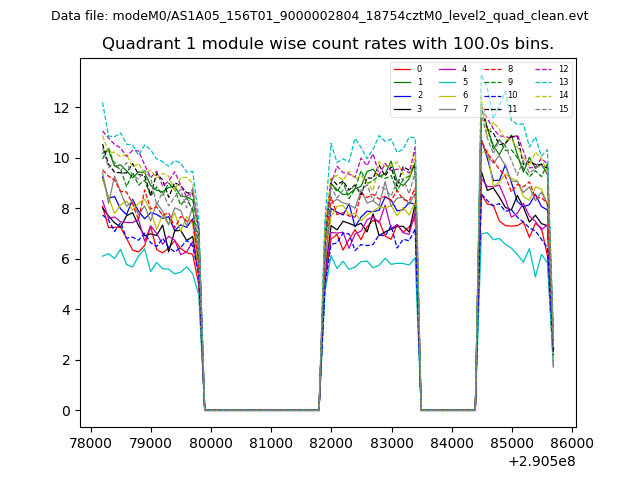
| Module-wise count rates for Quadrant A Data is divided into 100 sec bins |
 |
 |
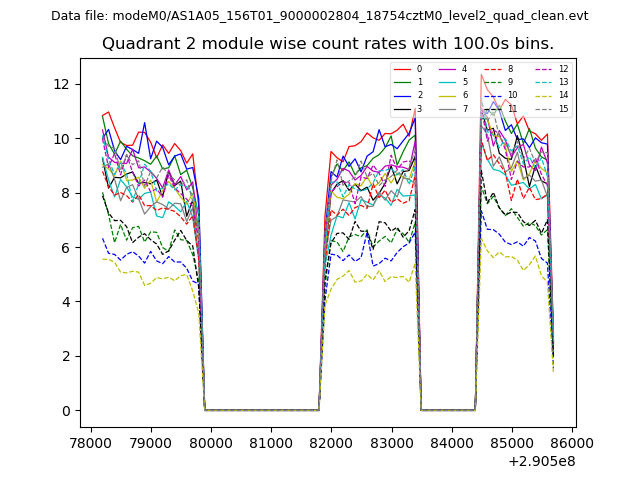
| Module-wise count rates for Quadrant B Data is divided into 100 sec bins |
 |
 |
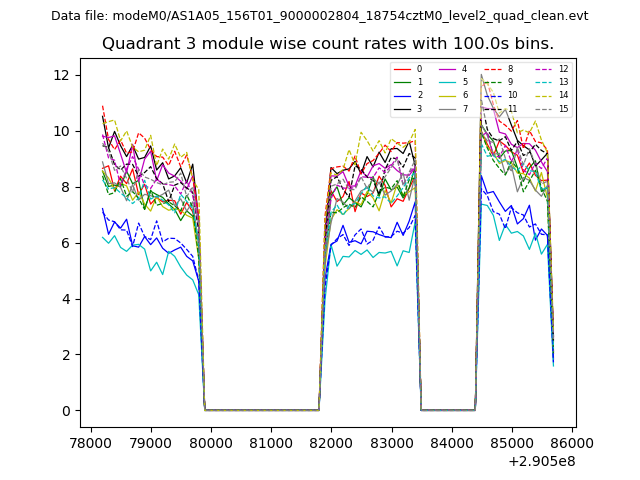
| Module-wise count rates for Quadrant C Data is divided into 100 sec bins |
 |
 |
| Module-wise count rates for Quadrant D Data is divided into 100 sec bins |
 |
 |
| Parameter | Plot |
|---|---|
| CZT HV Monitor | 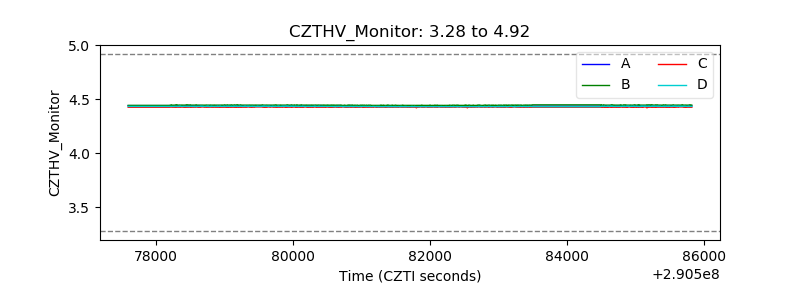 |
| D_VDD | 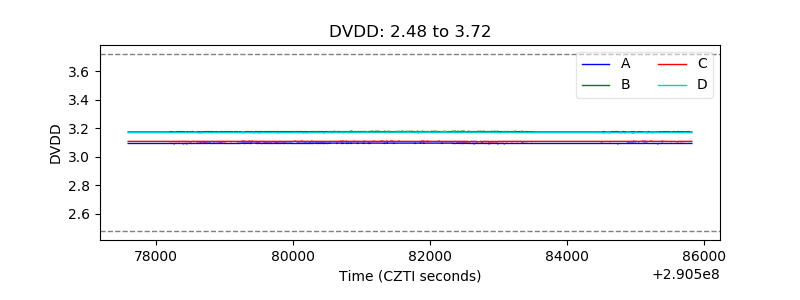 |
| Temperature 1 | 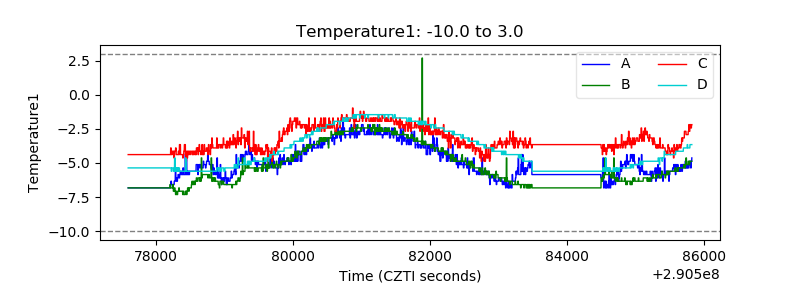 |
| Veto HV Monitor | 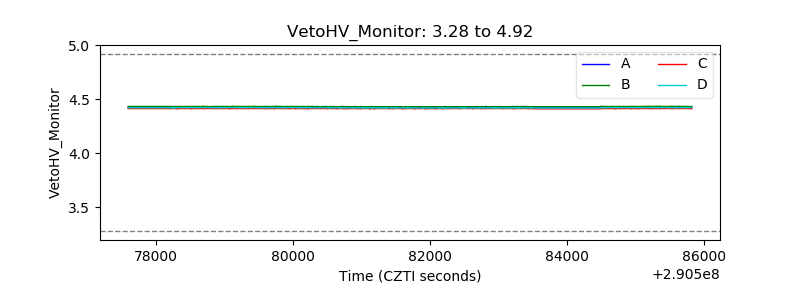 |
| Veto LLD | 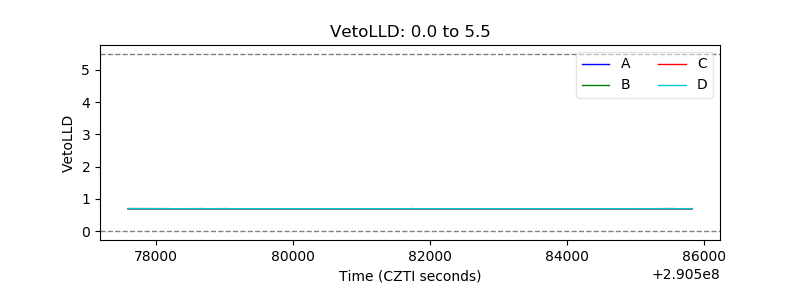 |
| Alpha Counter | 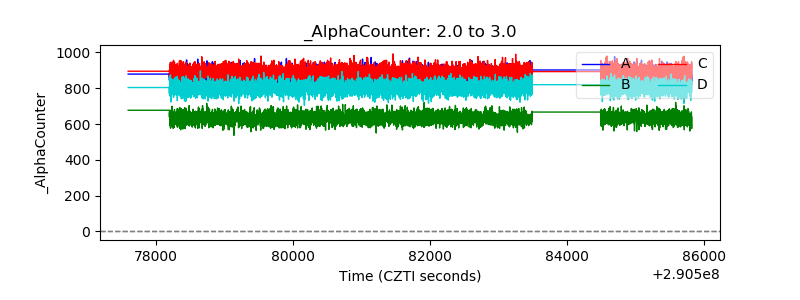 |
| _CPM_Rate | 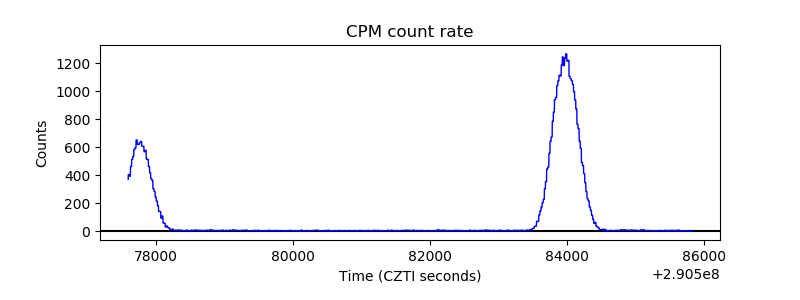 |
| CZT Counter |  |
| +2.5 Volts monitor |  |
| +5 Volts monitor |  |
| _ROLL_ROT | 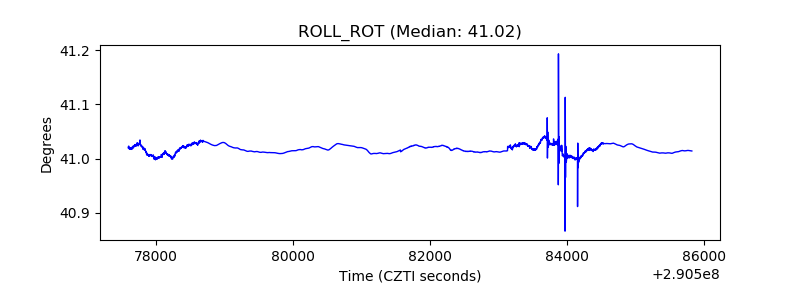 |
| _Roll_DEC | 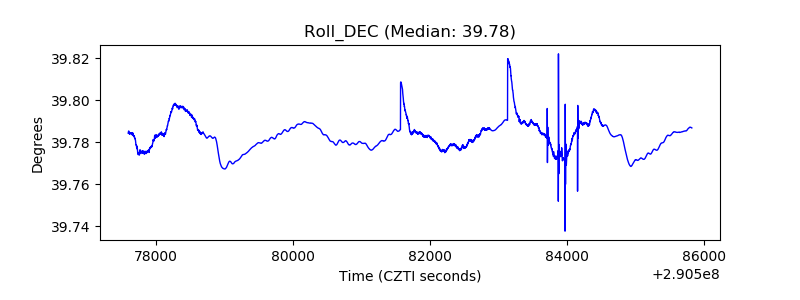 |
| _Roll_RA |  |
| Veto Counter | 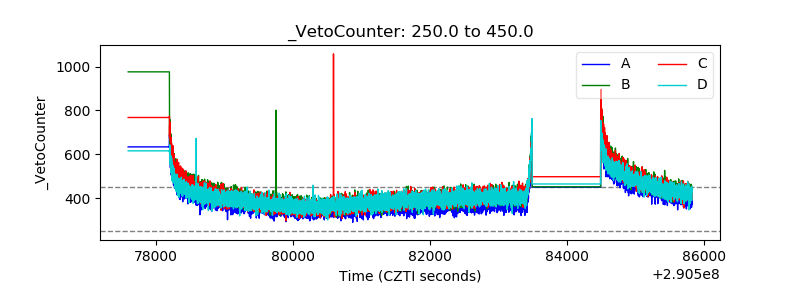 |