| Param | Original file | Final file |
|---|---|---|
| Filename | modeM0/AS1A05_156T01_9000002804_18756cztM0_level2.evt | modeM0/AS1A05_156T01_9000002804_18756cztM0_level2_quad_clean.evt |
| Size (bytes) | 452,459,520 | 88,611,840 |
| Size | 431.5 MB | 84.5 MB |
| Events in quadrant A | 3,290,463 | 562,854 |
| Events in quadrant B | 3,488,088 | 569,722 |
| Events in quadrant C | 3,248,309 | 543,439 |
| Events in quadrant D | 3,221,639 | 541,446 |
| Mode M0 | |||
|---|---|---|---|
| Quadrant | BADHDUFLAG | Total packets | Discarded packets |
| A | 0 | 13873 | 2 |
| B | 0 | 14408 | 2 |
| C | 0 | 13761 | 2 |
| D | 0 | 13878 | 3 |
| Mode M9 | |||
|---|---|---|---|
| Quadrant | BADHDUFLAG | Total packets | Discarded packets |
| A | 0 | 13 | 0 |
| B | 0 | 14 | 0 |
| C | 0 | 14 | 0 |
| D | 0 | 14 | 0 |
| Mode SS | |||
|---|---|---|---|
| Quadrant | BADHDUFLAG | Total packets | Discarded packets |
| A | 0 | 136 | 0 |
| B | 0 | 136 | 0 |
| C | 0 | 136 | 0 |
| D | 0 | 136 | 0 |
| Quadrant | Total seconds | Saturated seconds | Saturation percentage |
|---|---|---|---|
| A | 6682 | 51 | 0.763245% |
| B | 6682 | 60 | 0.897935% |
| C | 6682 | 68 | 1.017659% |
| D | 6681 | 33 | 0.493938% |
Noise dominated data is calculated using 1-second bins in cleaned event files. If a bin has >2000 counts, and if more than 50% of those come from <1% of pixels, then it is considered to be noise-dominated and hence unusable.
| Quadrant | # 1 sec bins | Bins with >0 counts | Bins with >2000 counts | High rate bins dominated by noise | Noise dominated (total time) | Noise dominated (detector-on time) | Marked lightcurve |
|---|---|---|---|---|---|---|---|
| A | 7812 | 6683 | 0 | 0 | 0.00% | 0.00% | 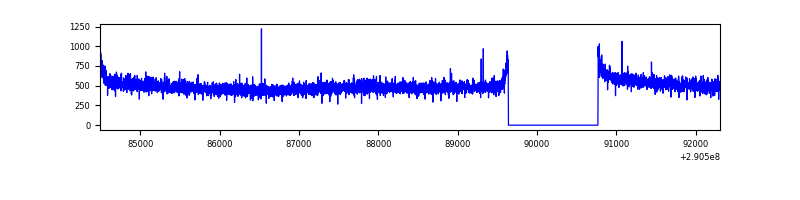 |
| B | 7812 | 6683 | 4 | 4 | 0.05% | 0.06% | 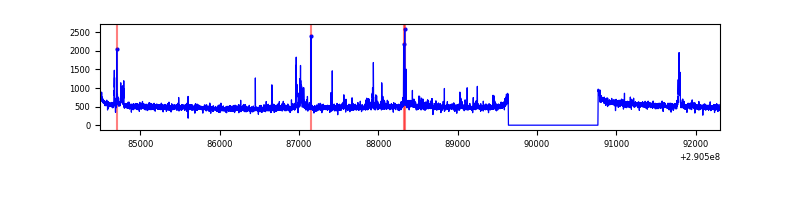 |
| C | 7812 | 6683 | 0 | 0 | 0.00% | 0.00% | 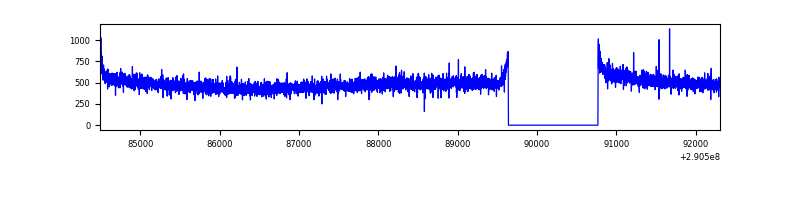 |
| D | 7811 | 6682 | 9 | 9 | 0.12% | 0.13% | 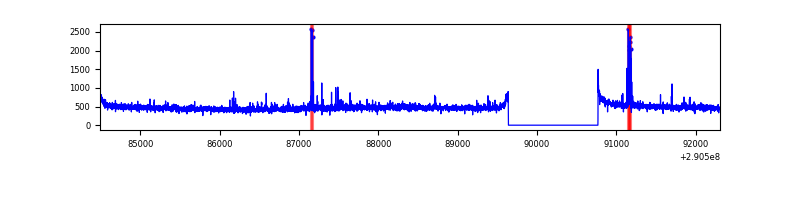 |
Top three noisy pixels from each quadrant. If the there are fewer than three noisy pixels in the level2.evt file, extra rows are filled as -1
| Pixel properties | Quadrant properties | ||||||
|---|---|---|---|---|---|---|---|
| Quadrant | DetID | PixID | Counts | Sigma | Mean | Median | Sigma |
| A | 13 | 254 | 10562 | 57.84 | 848 | 831 | 168.2 |
| A | 11 | 29 | 7416 | 39.14 | 848 | 831 | 168.2 |
| A | 0 | 226 | 7326 | 38.61 | 848 | 831 | 168.2 |
| B | 10 | 245 | 106247 | 664.88 | 840 | 819 | 158.6 |
| B | 3 | 64 | 50016 | 310.26 | 840 | 819 | 158.6 |
| B | 12 | 111 | 19150 | 115.6 | 840 | 819 | 158.6 |
| C | 14 | 238 | 126077 | 673.94 | 800 | 804 | 185.9 |
| C | 13 | 61 | 5710 | 26.39 | 800 | 804 | 185.9 |
| C | 3 | 233 | 3668 | 15.41 | 800 | 804 | 185.9 |
| D | 1 | 52 | 68932 | 344.58 | 819 | 795 | 197.7 |
| D | 7 | 96 | 37490 | 185.57 | 819 | 795 | 197.7 |
| D | 2 | 234 | 25685 | 125.87 | 819 | 795 | 197.7 |
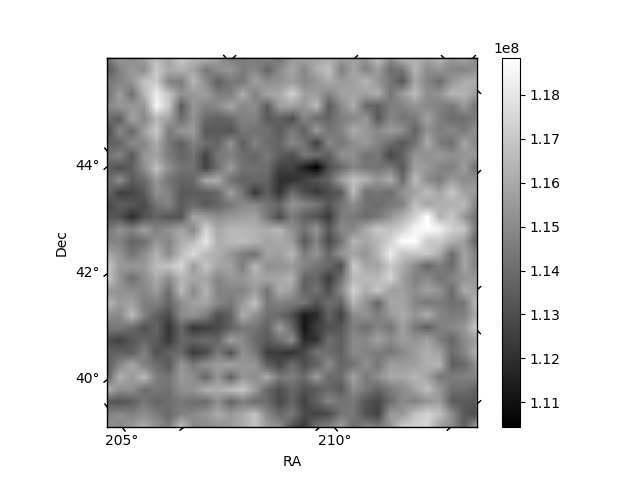
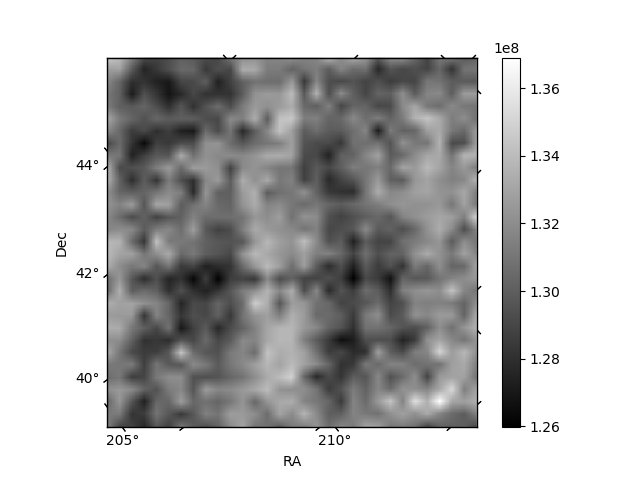
Histogram calculated using DETX and DETY for each event in the final _common_clean file
| Quadrant A |  |
 |
Quadrant B |
|---|---|---|---|
| Quadrant D |  |
 |
Quadrant C |
| Plot type | Count rate plots | Images |
|---|---|---|
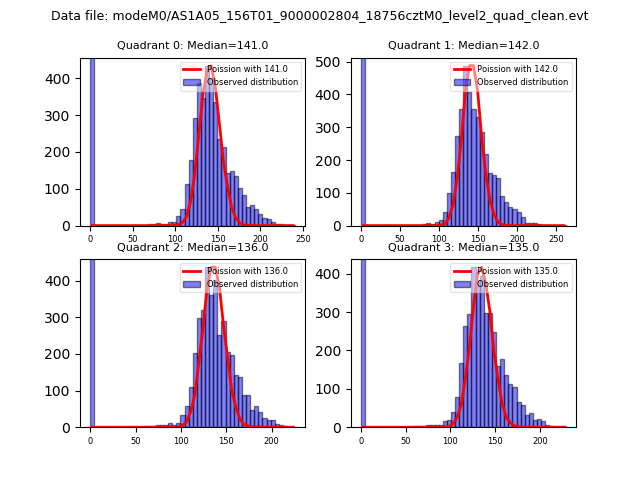
| Comparison with Poisson distribution Blue bars denote a histogram of data divided into 1 sec bins. Red curve is a Poisson curve with rate = median count rate of data. |
 |
 |
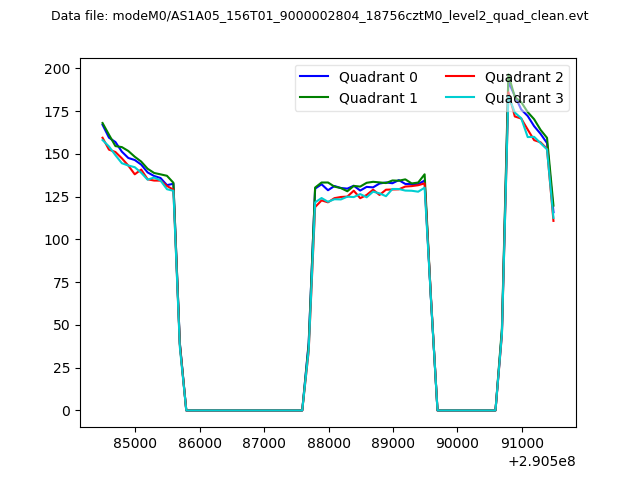
| Quadrant-wise count rates Data is divided into 100 sec bins |
 |
|
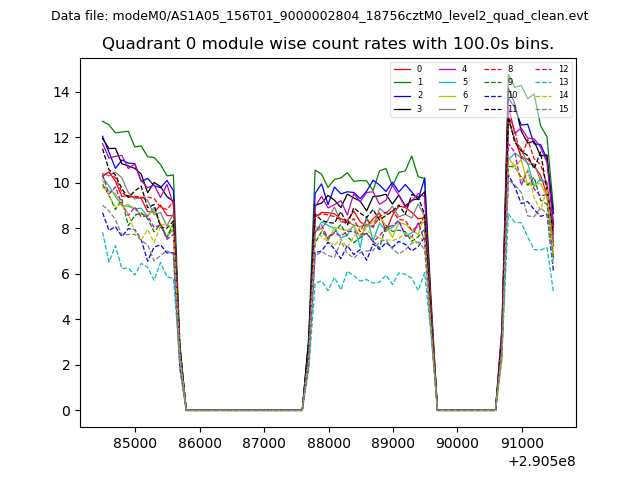
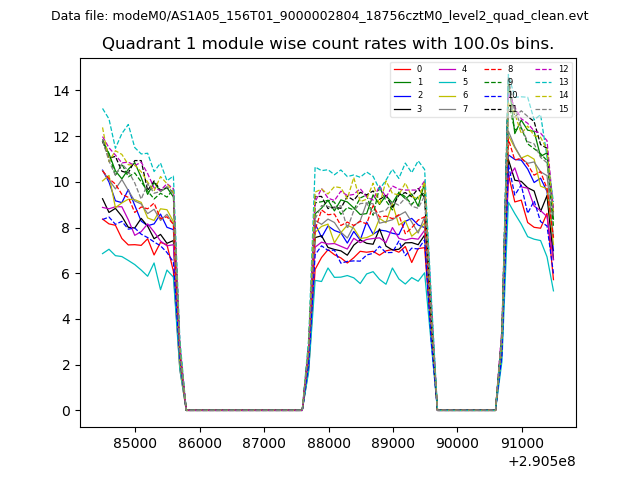
| Module-wise count rates for Quadrant A Data is divided into 100 sec bins |
 |
 |
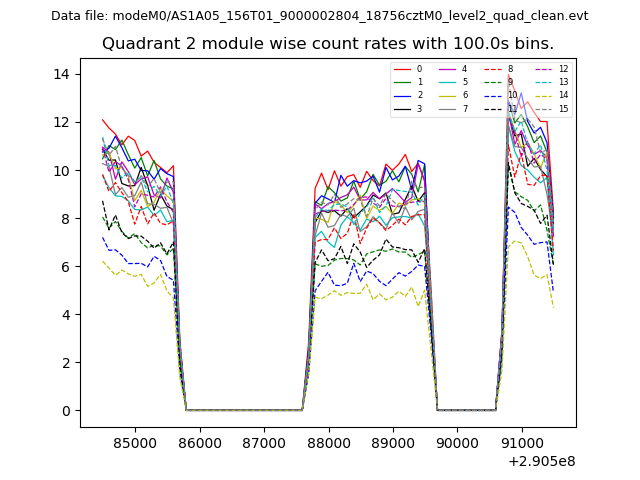
| Module-wise count rates for Quadrant B Data is divided into 100 sec bins |
 |
 |
| Module-wise count rates for Quadrant C Data is divided into 100 sec bins |
 |
 |
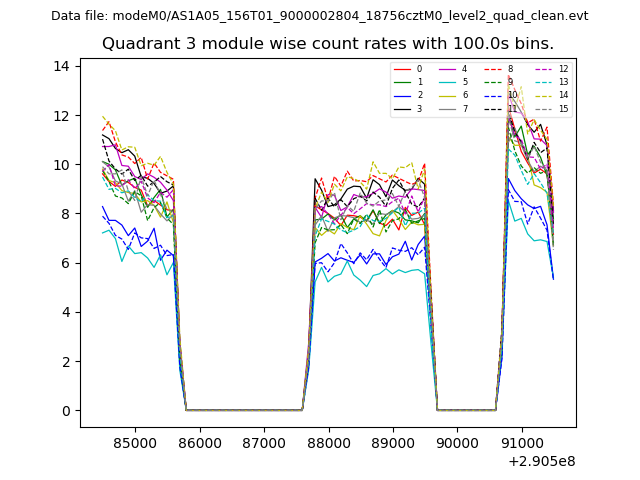
| Module-wise count rates for Quadrant D Data is divided into 100 sec bins |
 |
 |
| Parameter | Plot |
|---|---|
| CZT HV Monitor |  |
| D_VDD | 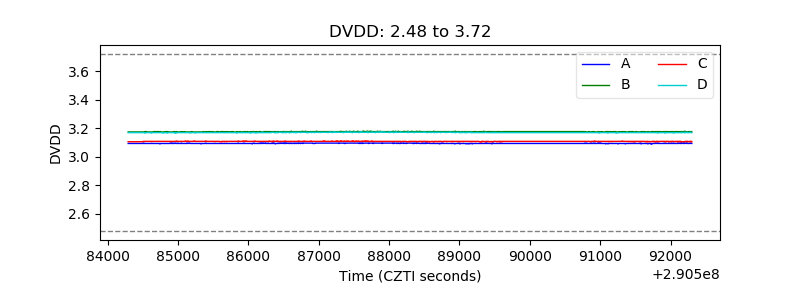 |
| Temperature 1 | 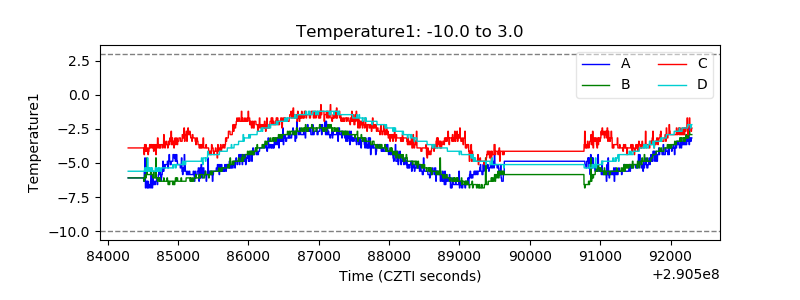 |
| Veto HV Monitor | 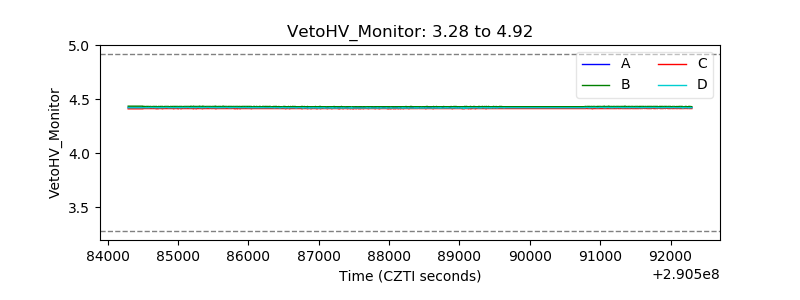 |
| Veto LLD | 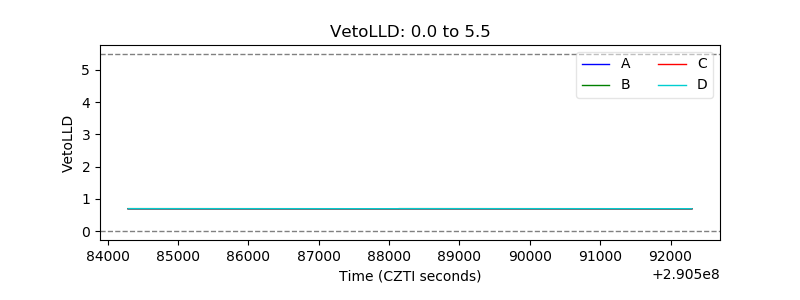 |
| Alpha Counter | 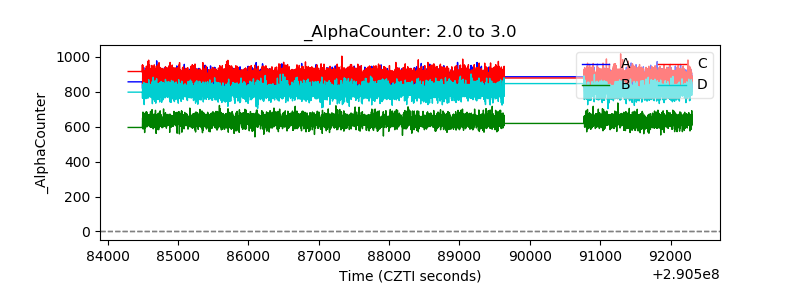 |
| _CPM_Rate | 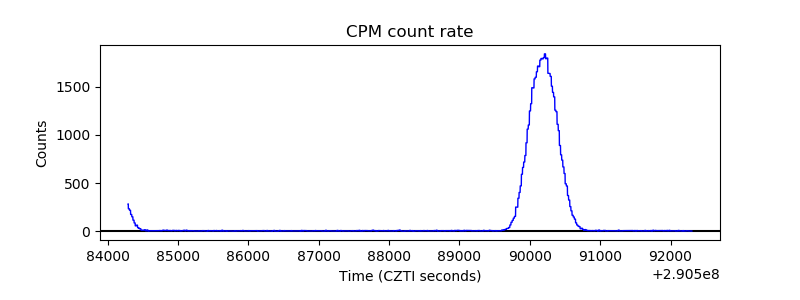 |
| CZT Counter | 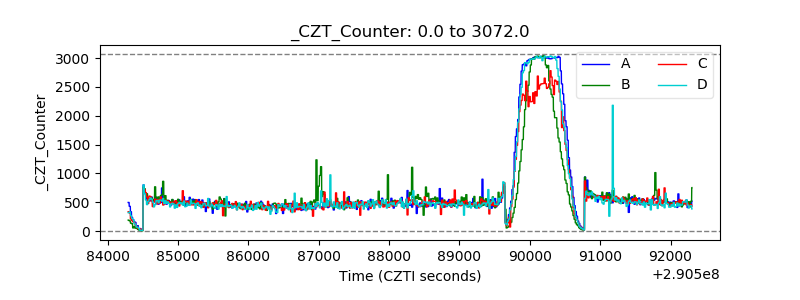 |
| +2.5 Volts monitor | 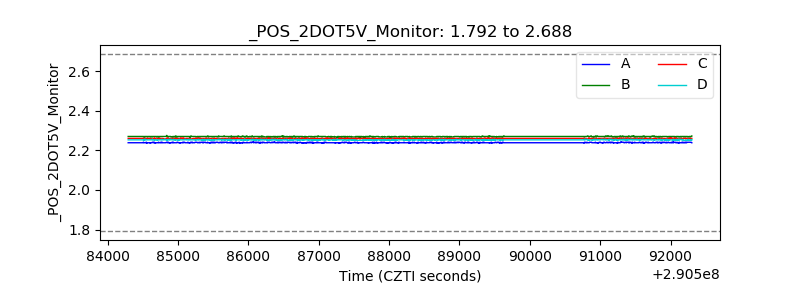 |
| +5 Volts monitor |  |
| _ROLL_ROT | 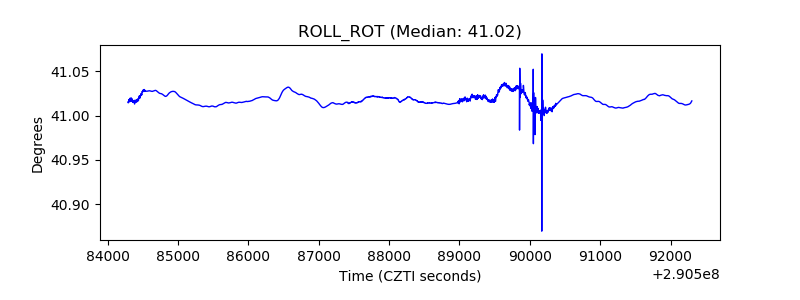 |
| _Roll_DEC | 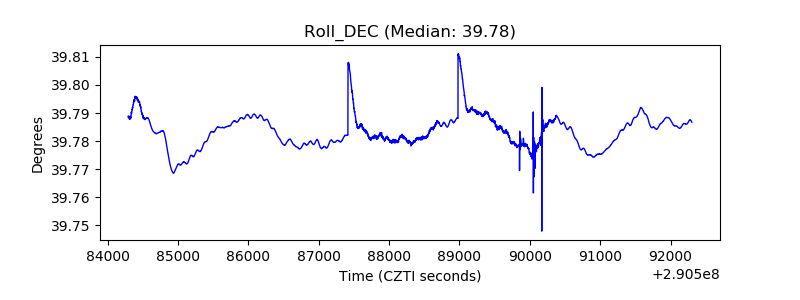 |
| _Roll_RA | 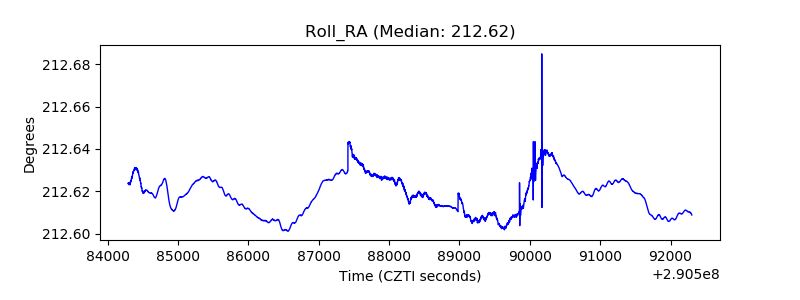 |
| Veto Counter | 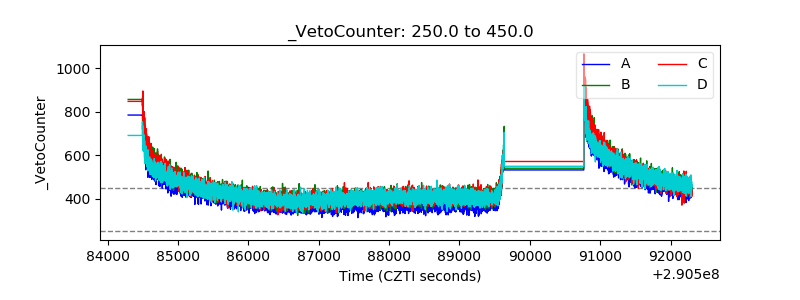 |