| Param | Original file | Final file |
|---|---|---|
| Filename | modeM0/AS1A05_156T01_9000002804_18757cztM0_level2.evt | modeM0/AS1A05_156T01_9000002804_18757cztM0_level2_quad_clean.evt |
| Size (bytes) | 468,532,800 | 81,331,200 |
| Size | 446.8 MB | 77.6 MB |
| Events in quadrant A | 3,343,648 | 512,567 |
| Events in quadrant B | 3,499,904 | 517,132 |
| Events in quadrant C | 3,333,427 | 494,047 |
| Events in quadrant D | 3,573,955 | 488,467 |
| Mode M0 | |||
|---|---|---|---|
| Quadrant | BADHDUFLAG | Total packets | Discarded packets |
| A | 0 | 13922 | 2 |
| B | 0 | 14298 | 2 |
| C | 0 | 13750 | 2 |
| D | 0 | 14618 | 2 |
| Mode M9 | |||
|---|---|---|---|
| Quadrant | BADHDUFLAG | Total packets | Discarded packets |
| A | 0 | 12 | 0 |
| B | 0 | 12 | 0 |
| C | 0 | 12 | 0 |
| D | 0 | 12 | 0 |
| Mode SS | |||
|---|---|---|---|
| Quadrant | BADHDUFLAG | Total packets | Discarded packets |
| A | 0 | 132 | 0 |
| B | 0 | 132 | 0 |
| C | 0 | 132 | 0 |
| D | 0 | 132 | 0 |
| Quadrant | Total seconds | Saturated seconds | Saturation percentage |
|---|---|---|---|
| A | 6455 | 72 | 1.115414% |
| B | 6456 | 112 | 1.734820% |
| C | 6456 | 101 | 1.564436% |
| D | 6456 | 76 | 1.177200% |
Noise dominated data is calculated using 1-second bins in cleaned event files. If a bin has >2000 counts, and if more than 50% of those come from <1% of pixels, then it is considered to be noise-dominated and hence unusable.
| Quadrant | # 1 sec bins | Bins with >0 counts | Bins with >2000 counts | High rate bins dominated by noise | Noise dominated (total time) | Noise dominated (detector-on time) | Marked lightcurve |
|---|---|---|---|---|---|---|---|
| A | 7665 | 6456 | 0 | 0 | 0.00% | 0.00% | 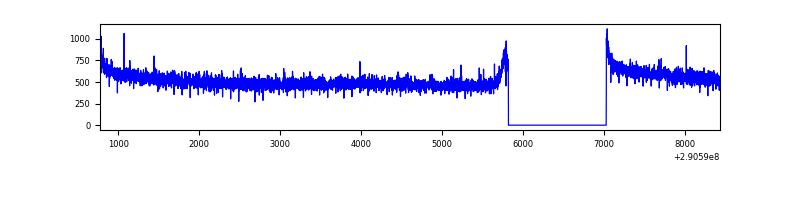 |
| B | 7666 | 6457 | 19 | 19 | 0.25% | 0.29% | 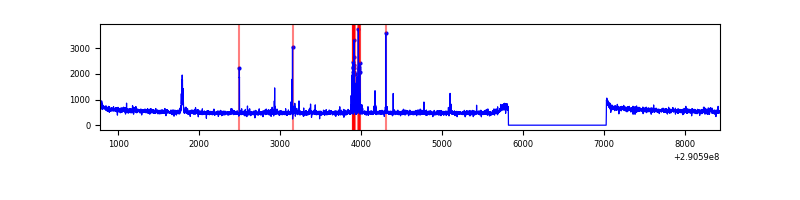 |
| C | 7666 | 6457 | 0 | 0 | 0.00% | 0.00% | 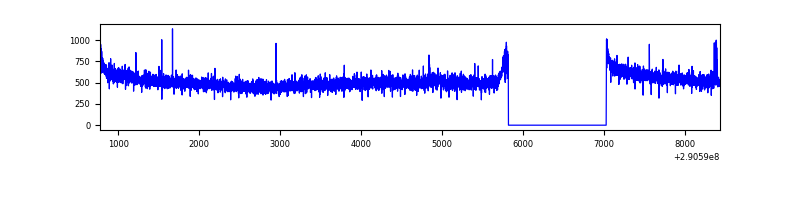 |
| D | 7666 | 6457 | 27 | 27 | 0.35% | 0.42% | 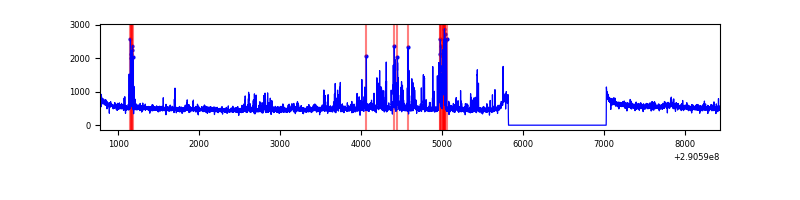 |
Top three noisy pixels from each quadrant. If the there are fewer than three noisy pixels in the level2.evt file, extra rows are filled as -1
| Pixel properties | Quadrant properties | ||||||
|---|---|---|---|---|---|---|---|
| Quadrant | DetID | PixID | Counts | Sigma | Mean | Median | Sigma |
| A | 13 | 254 | 9267 | 48.89 | 866 | 849 | 172.2 |
| A | 0 | 226 | 7586 | 39.12 | 866 | 849 | 172.2 |
| A | 12 | 194 | 6279 | 31.53 | 866 | 849 | 172.2 |
| B | 0 | 197 | 85300 | 521.87 | 854 | 833 | 161.9 |
| B | 3 | 64 | 30767 | 184.94 | 854 | 833 | 161.9 |
| B | 12 | 111 | 18826 | 111.17 | 854 | 833 | 161.9 |
| C | 14 | 238 | 131009 | 693.51 | 816 | 824 | 187.7 |
| C | 9 | 54 | 11183 | 55.18 | 816 | 824 | 187.7 |
| C | 3 | 233 | 10506 | 51.57 | 816 | 824 | 187.7 |
| D | 1 | 52 | 301448 | 1484.23 | 838 | 815 | 202.6 |
| D | 13 | 168 | 49904 | 242.35 | 838 | 815 | 202.6 |
| D | 7 | 96 | 34497 | 166.29 | 838 | 815 | 202.6 |
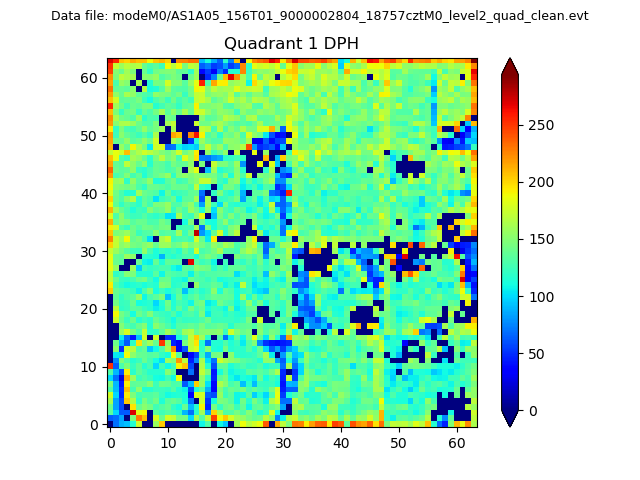
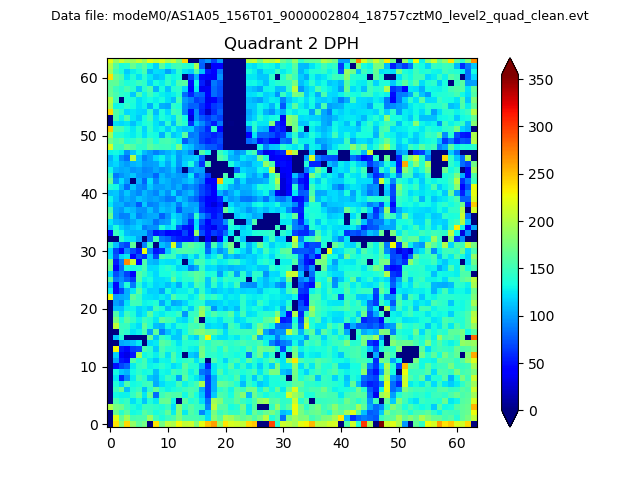
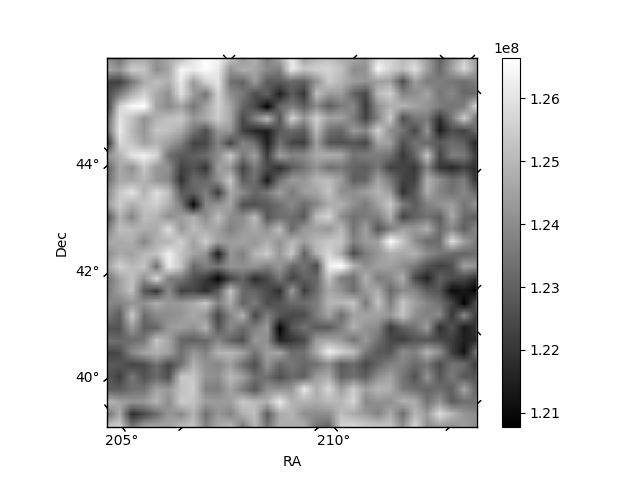
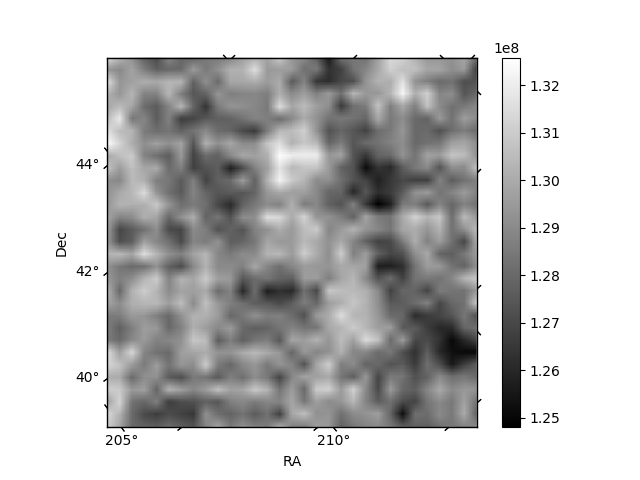
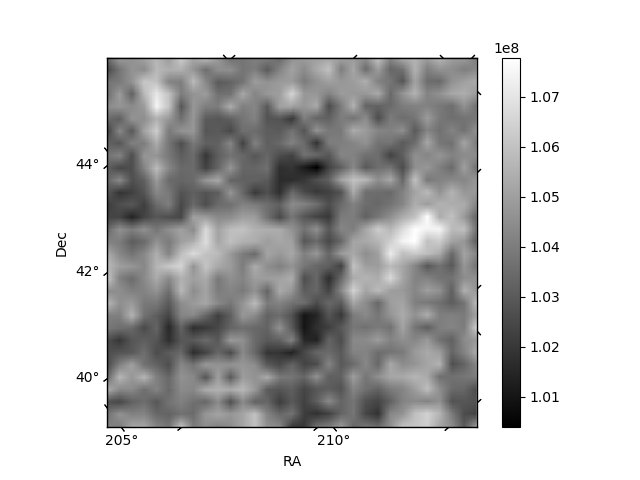
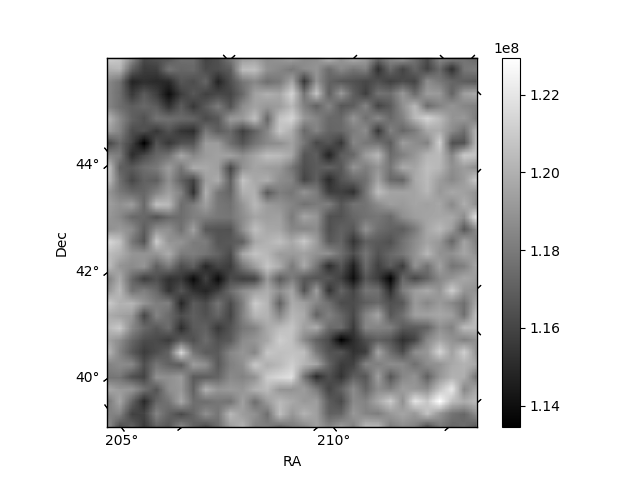
Histogram calculated using DETX and DETY for each event in the final _common_clean file
| Quadrant A |  |
 |
Quadrant B |
|---|---|---|---|
| Quadrant D |  |
 |
Quadrant C |
| Plot type | Count rate plots | Images |
|---|---|---|
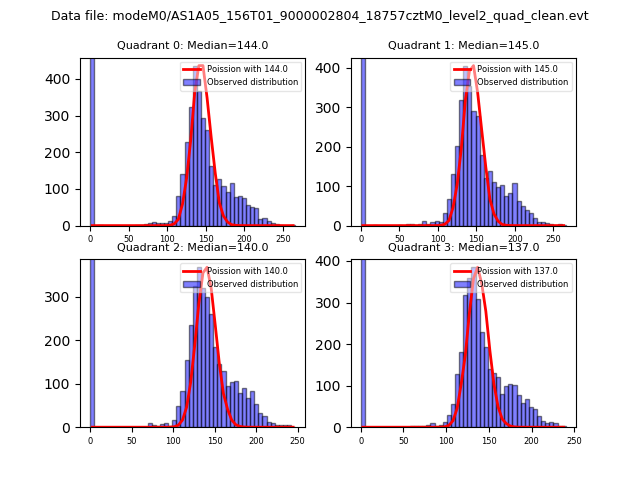
| Comparison with Poisson distribution Blue bars denote a histogram of data divided into 1 sec bins. Red curve is a Poisson curve with rate = median count rate of data. |
 |
 |
| Quadrant-wise count rates Data is divided into 100 sec bins |
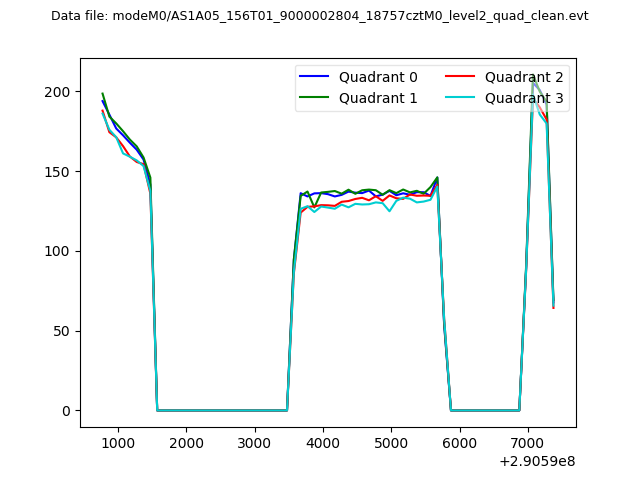 |
|
| Module-wise count rates for Quadrant A Data is divided into 100 sec bins |
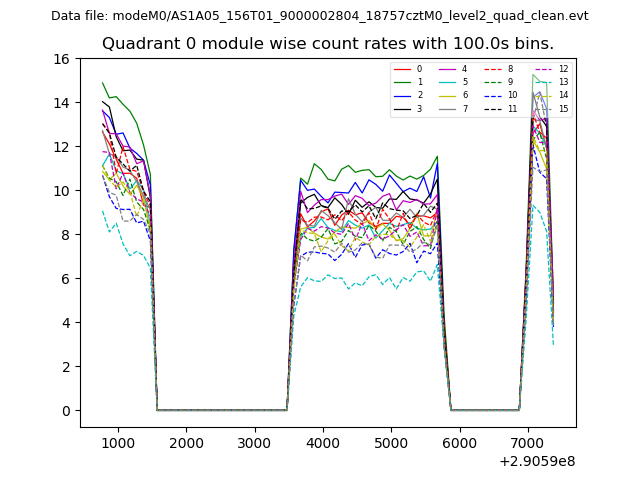 |
 |
| Module-wise count rates for Quadrant B Data is divided into 100 sec bins |
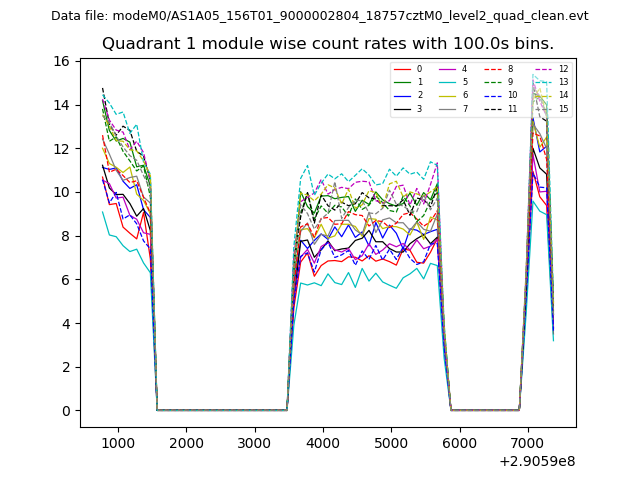 |
 |
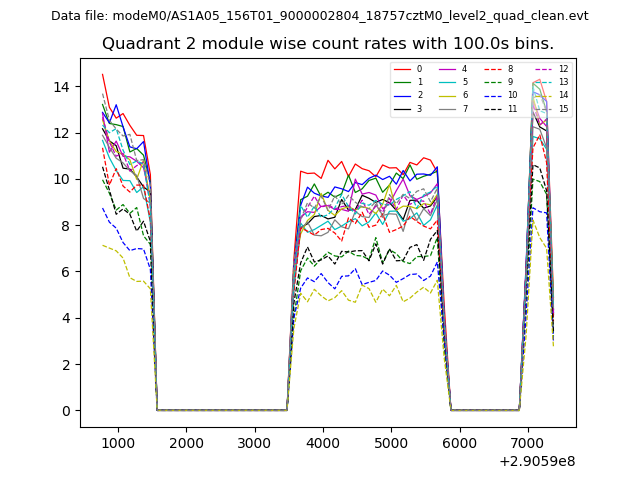
| Module-wise count rates for Quadrant C Data is divided into 100 sec bins |
 |
 |
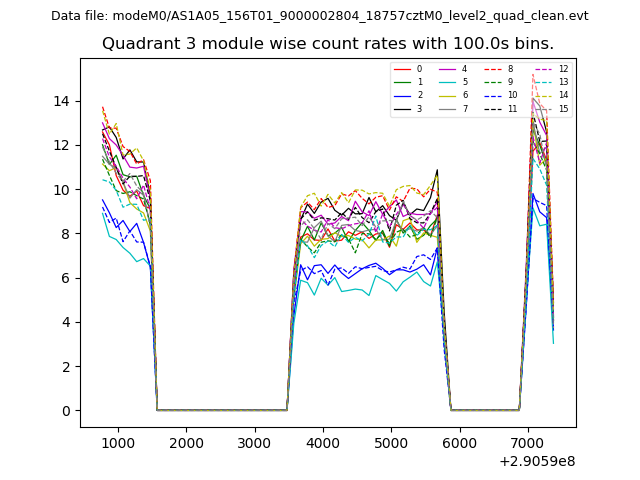
| Module-wise count rates for Quadrant D Data is divided into 100 sec bins |
 |
 |
| Parameter | Plot |
|---|---|
| CZT HV Monitor | 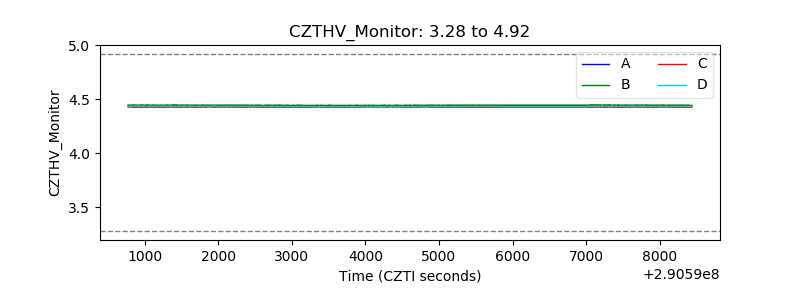 |
| D_VDD | 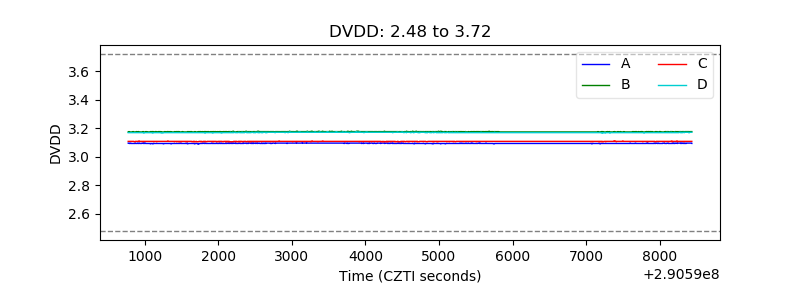 |
| Temperature 1 | 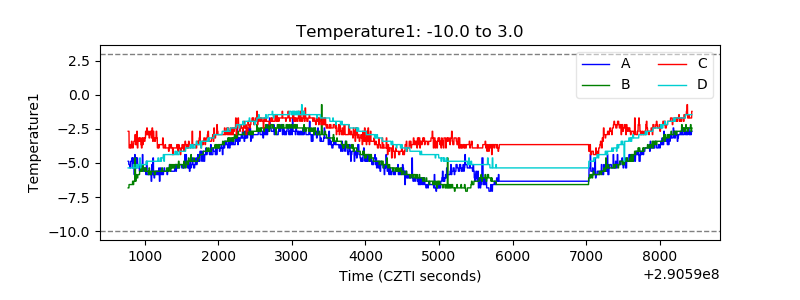 |
| Veto HV Monitor |  |
| Veto LLD | 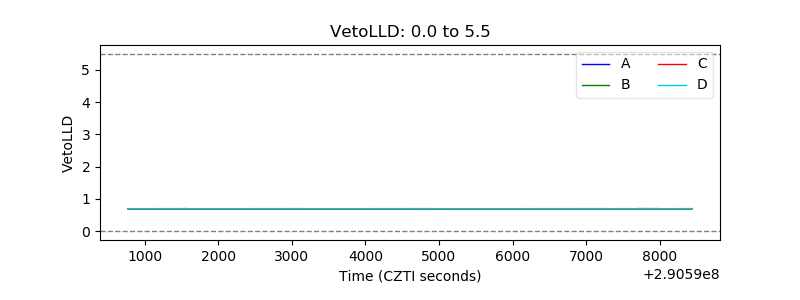 |
| Alpha Counter | 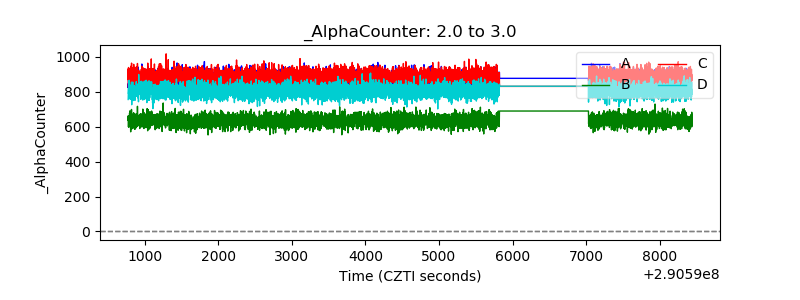 |
| _CPM_Rate | 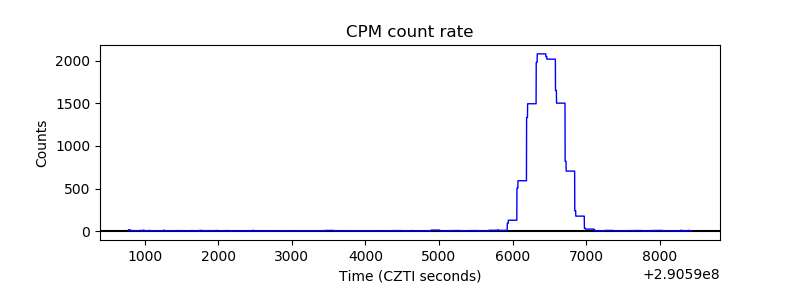 |
| CZT Counter |  |
| +2.5 Volts monitor | 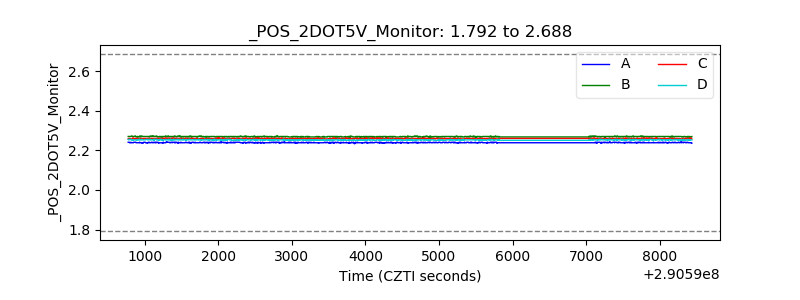 |
| +5 Volts monitor |  |
| _ROLL_ROT | 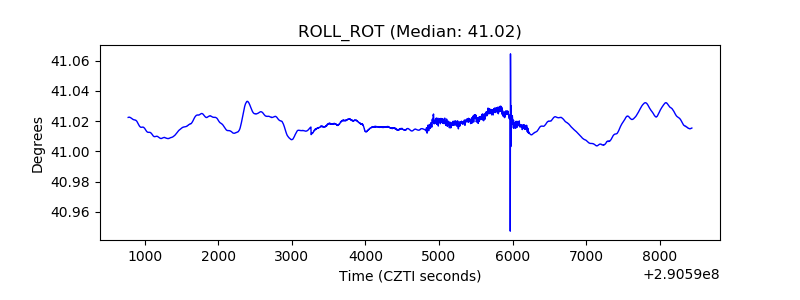 |
| _Roll_DEC | 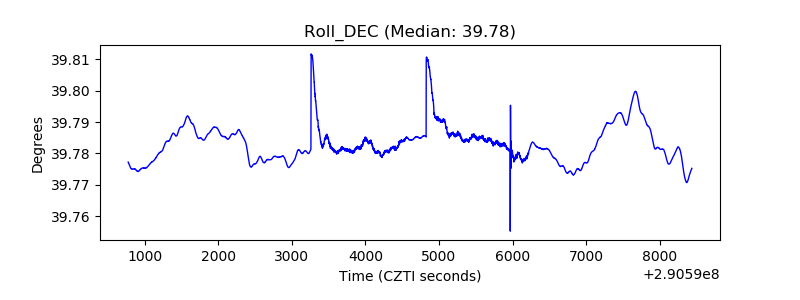 |
| _Roll_RA |  |
| Veto Counter | 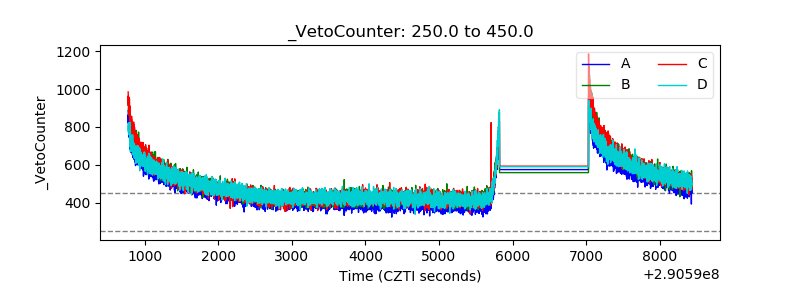 |