| Param | Original file | Final file |
|---|---|---|
| Filename | modeM0/AS1A05_156T01_9000002804_18758cztM0_level2.evt | modeM0/AS1A05_156T01_9000002804_18758cztM0_level2_quad_clean.evt |
| Size (bytes) | 475,680,960 | 67,544,640 |
| Size | 453.6 MB | 64.4 MB |
| Events in quadrant A | 3,360,205 | 408,865 |
| Events in quadrant B | 3,447,866 | 412,562 |
| Events in quadrant C | 3,530,117 | 395,021 |
| Events in quadrant D | 3,642,670 | 391,256 |
| Mode M0 | |||
|---|---|---|---|
| Quadrant | BADHDUFLAG | Total packets | Discarded packets |
| A | 0 | 13828 | 1 |
| B | 0 | 14147 | 1 |
| C | 0 | 14350 | 1 |
| D | 0 | 14835 | 2 |
| Mode M9 | |||
|---|---|---|---|
| Quadrant | BADHDUFLAG | Total packets | Discarded packets |
| A | 0 | 12 | 0 |
| B | 0 | 12 | 0 |
| C | 0 | 12 | 0 |
| D | 0 | 12 | 0 |
| Mode SS | |||
|---|---|---|---|
| Quadrant | BADHDUFLAG | Total packets | Discarded packets |
| A | 0 | 128 | 0 |
| B | 0 | 128 | 0 |
| C | 0 | 128 | 0 |
| D | 0 | 128 | 0 |
| Quadrant | Total seconds | Saturated seconds | Saturation percentage |
|---|---|---|---|
| A | 6262 | 78 | 1.245608% |
| B | 6263 | 98 | 1.564745% |
| C | 6263 | 106 | 1.692480% |
| D | 6262 | 71 | 1.133823% |
Noise dominated data is calculated using 1-second bins in cleaned event files. If a bin has >2000 counts, and if more than 50% of those come from <1% of pixels, then it is considered to be noise-dominated and hence unusable.
| Quadrant | # 1 sec bins | Bins with >0 counts | Bins with >2000 counts | High rate bins dominated by noise | Noise dominated (total time) | Noise dominated (detector-on time) | Marked lightcurve |
|---|---|---|---|---|---|---|---|
| A | 7537 | 6263 | 0 | 0 | 0.00% | 0.00% | 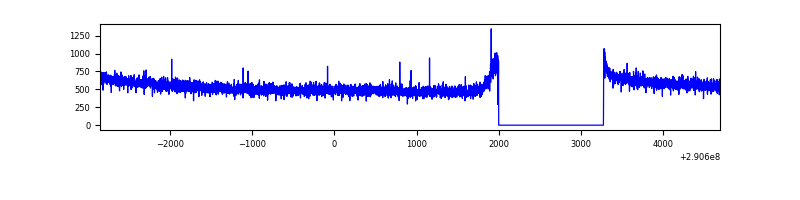 |
| B | 7538 | 6264 | 3 | 3 | 0.04% | 0.05% | 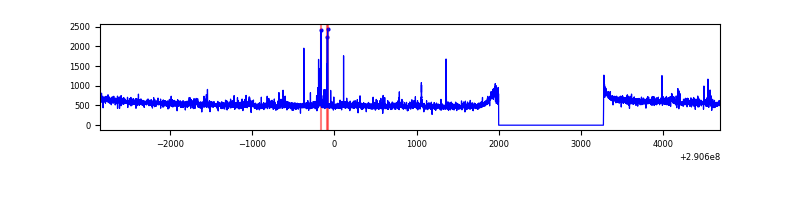 |
| C | 7538 | 6263 | 0 | 0 | 0.00% | 0.00% | 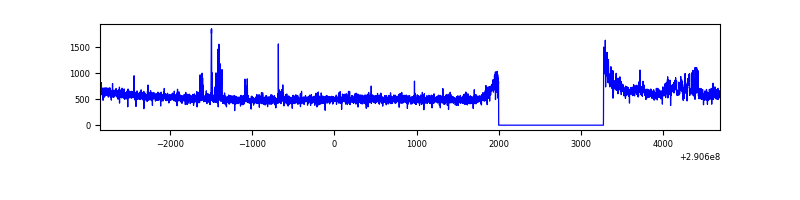 |
| D | 7537 | 6263 | 11 | 11 | 0.15% | 0.18% | 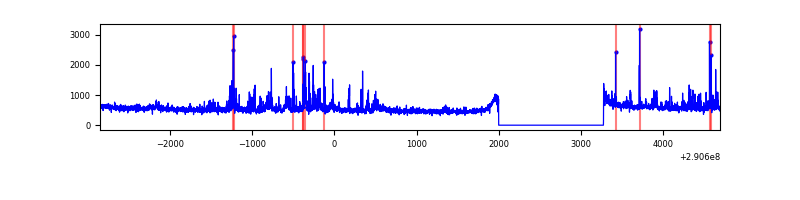 |
Top three noisy pixels from each quadrant. If the there are fewer than three noisy pixels in the level2.evt file, extra rows are filled as -1
| Pixel properties | Quadrant properties | ||||||
|---|---|---|---|---|---|---|---|
| Quadrant | DetID | PixID | Counts | Sigma | Mean | Median | Sigma |
| A | 11 | 29 | 15325 | 84.14 | 868 | 854 | 172.0 |
| A | 13 | 254 | 8984 | 47.27 | 868 | 854 | 172.0 |
| A | 0 | 226 | 7602 | 39.24 | 868 | 854 | 172.0 |
| B | 0 | 197 | 37445 | 231.05 | 853 | 835 | 158.4 |
| B | 4 | 171 | 19781 | 119.57 | 853 | 835 | 158.4 |
| B | 12 | 111 | 18140 | 109.22 | 853 | 835 | 158.4 |
| C | 9 | 54 | 195839 | 1043.93 | 818 | 824 | 186.8 |
| C | 14 | 238 | 133190 | 708.57 | 818 | 824 | 186.8 |
| C | 0 | 207 | 10724 | 53.0 | 818 | 824 | 186.8 |
| D | 1 | 52 | 349606 | 1727.85 | 840 | 816 | 201.9 |
| D | 7 | 96 | 48346 | 235.45 | 840 | 816 | 201.9 |
| D | 7 | 38 | 35527 | 171.95 | 840 | 816 | 201.9 |
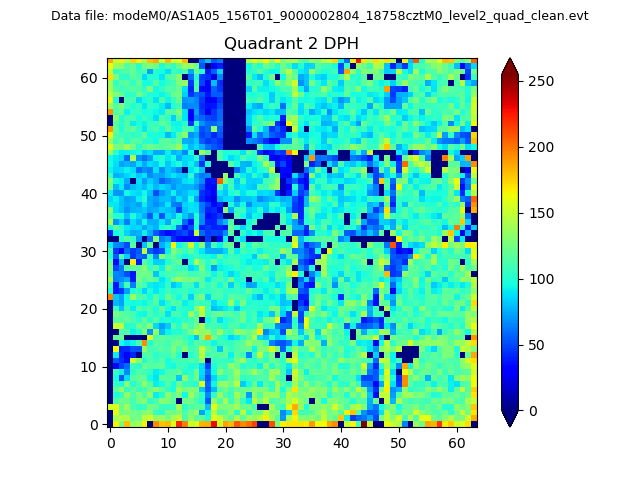
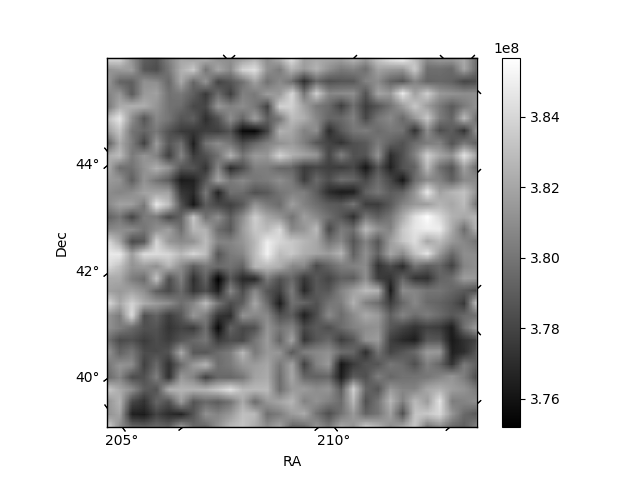
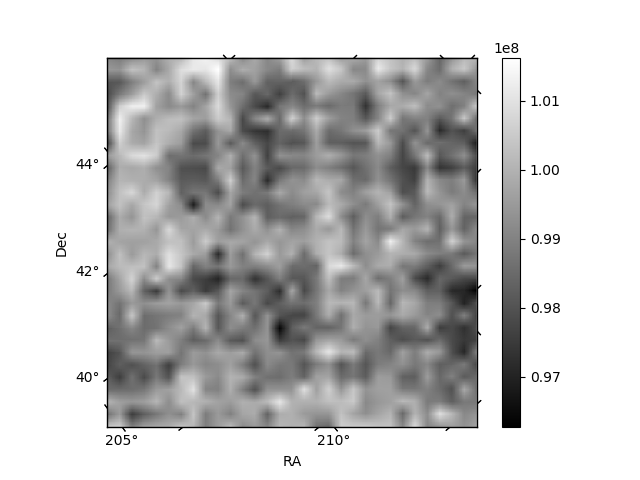
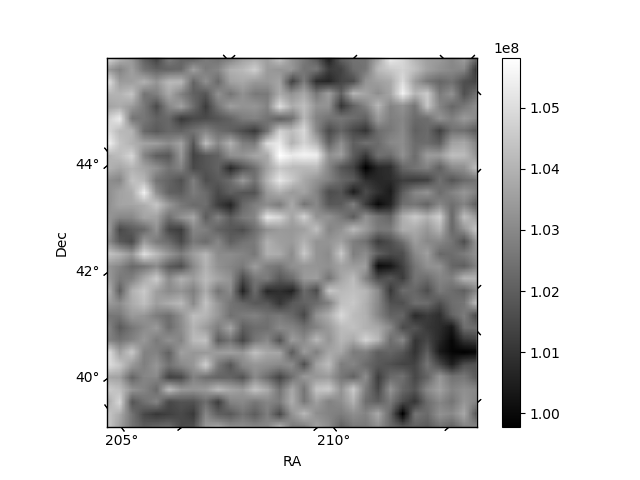
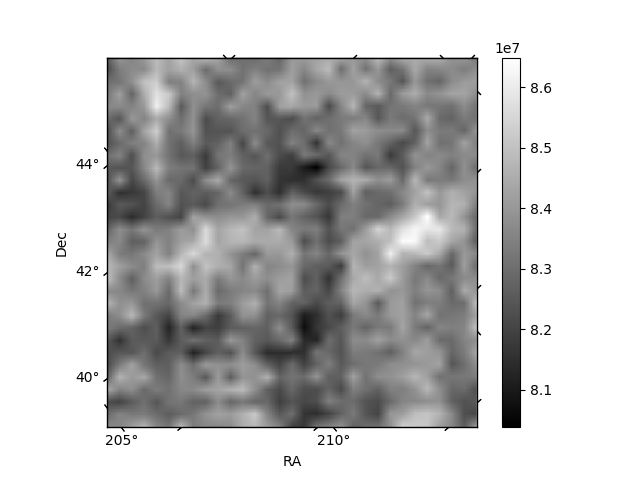
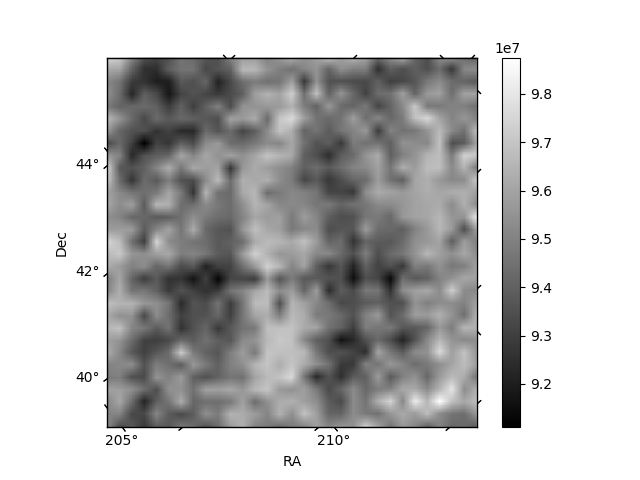
Histogram calculated using DETX and DETY for each event in the final _common_clean file
| Quadrant A | 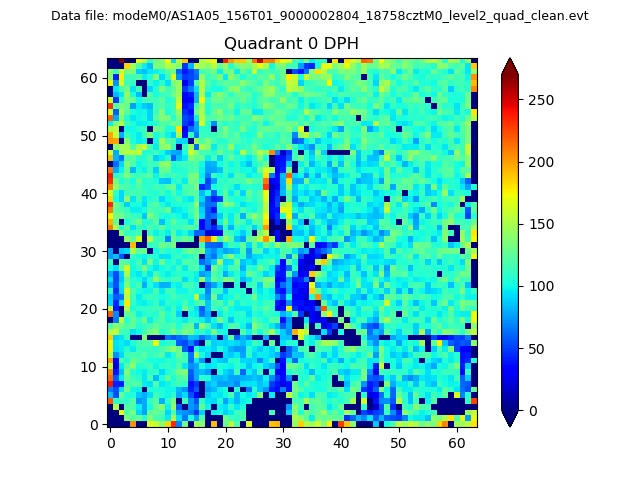 |
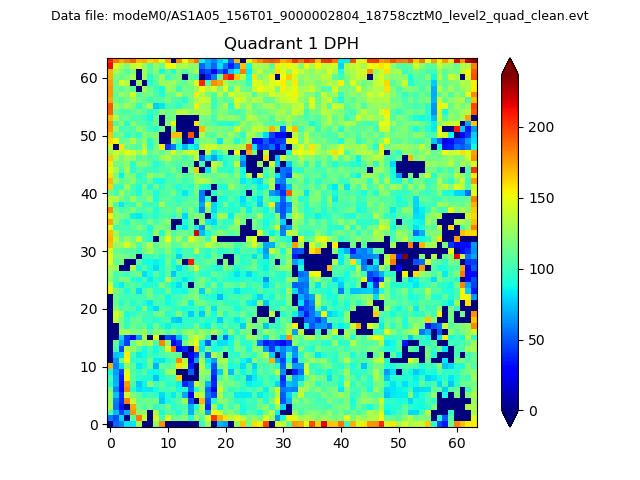 |
Quadrant B |
|---|---|---|---|
| Quadrant D | 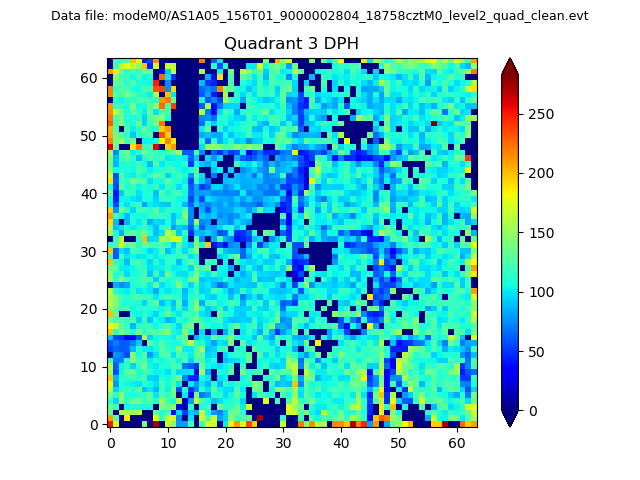 |
 |
Quadrant C |
| Plot type | Count rate plots | Images |
|---|---|---|
| Comparison with Poisson distribution Blue bars denote a histogram of data divided into 1 sec bins. Red curve is a Poisson curve with rate = median count rate of data. |
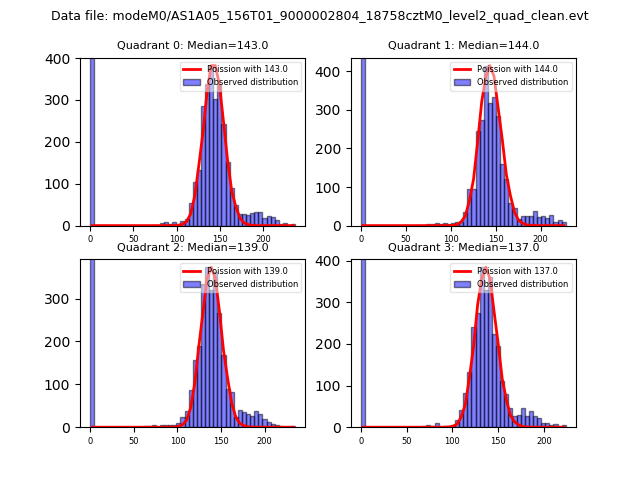 |
 |
| Quadrant-wise count rates Data is divided into 100 sec bins |
 |
|
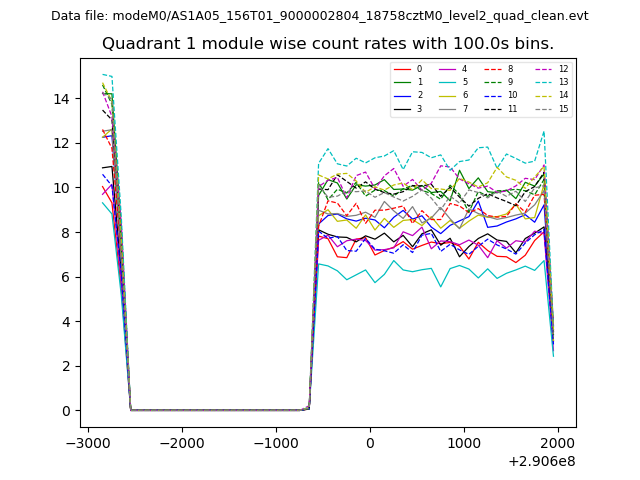
| Module-wise count rates for Quadrant A Data is divided into 100 sec bins |
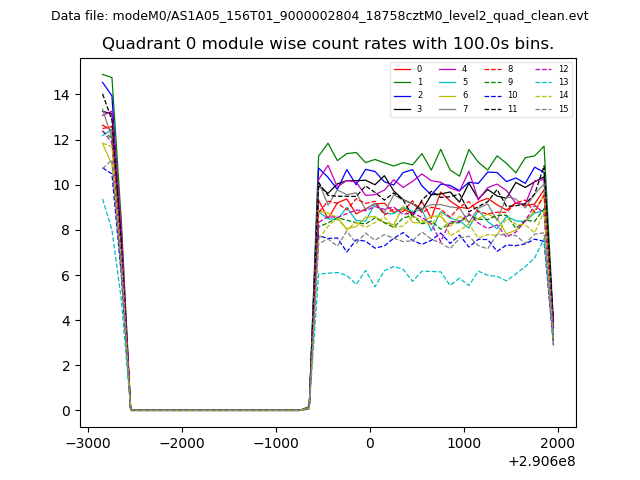 |
 |
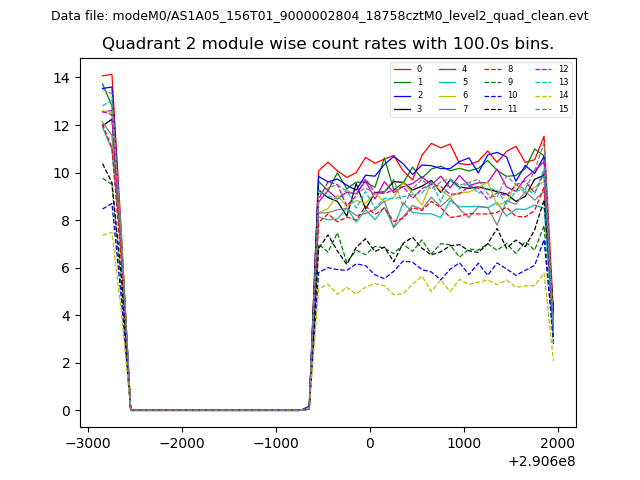
| Module-wise count rates for Quadrant B Data is divided into 100 sec bins |
 |
 |
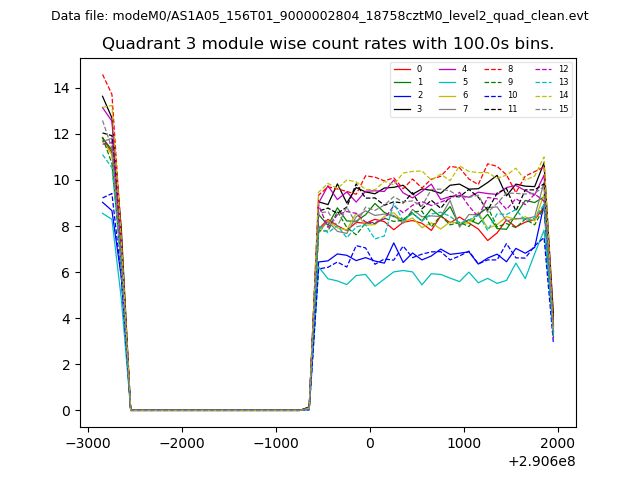
| Module-wise count rates for Quadrant C Data is divided into 100 sec bins |
 |
 |
| Module-wise count rates for Quadrant D Data is divided into 100 sec bins |
 |
 |
| Parameter | Plot |
|---|---|
| CZT HV Monitor | 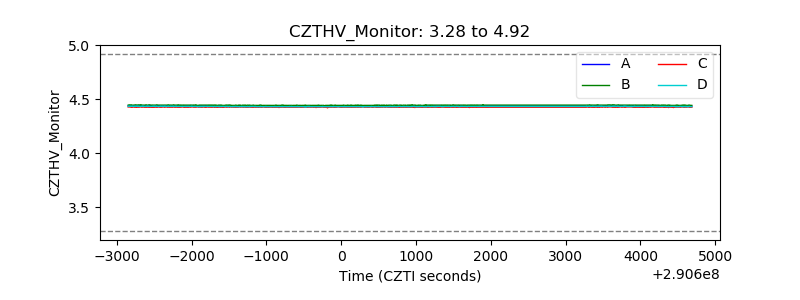 |
| D_VDD | 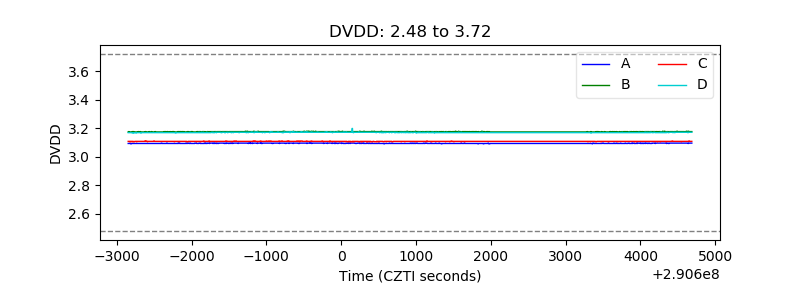 |
| Temperature 1 | 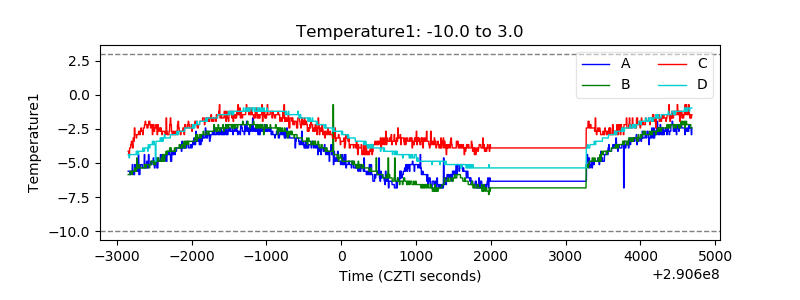 |
| Veto HV Monitor |  |
| Veto LLD |  |
| Alpha Counter | 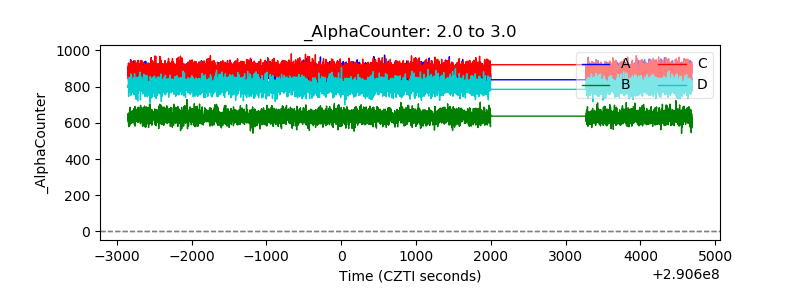 |
| _CPM_Rate | 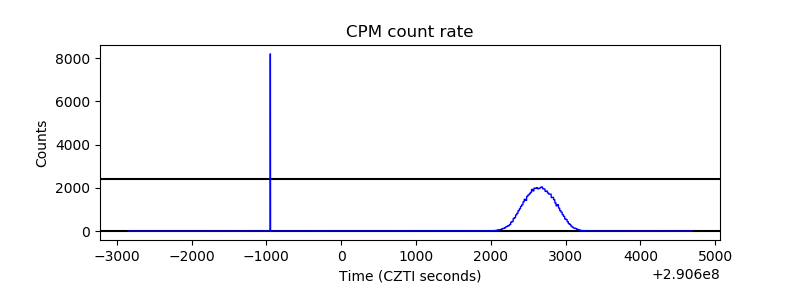 |
| CZT Counter | 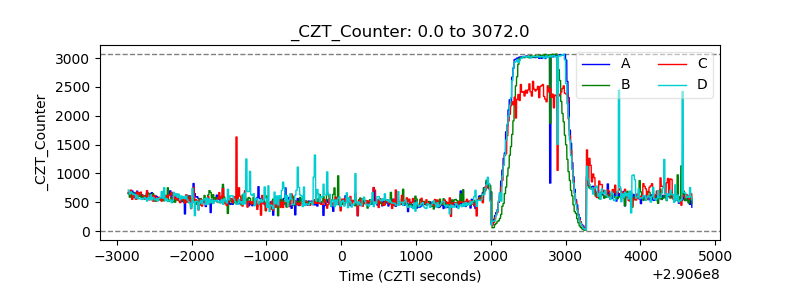 |
| +2.5 Volts monitor | 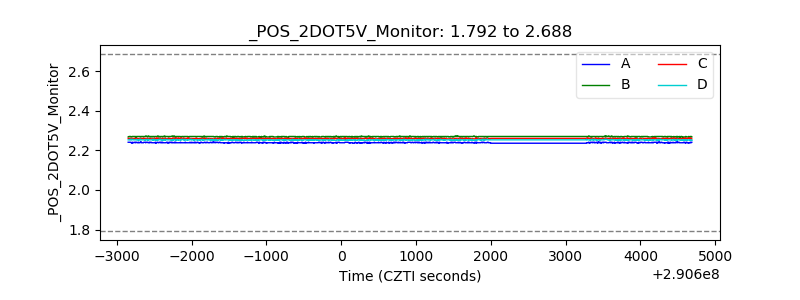 |
| +5 Volts monitor |  |
| _ROLL_ROT | 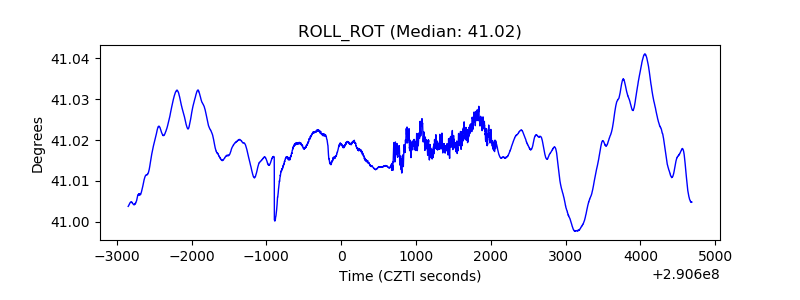 |
| _Roll_DEC | 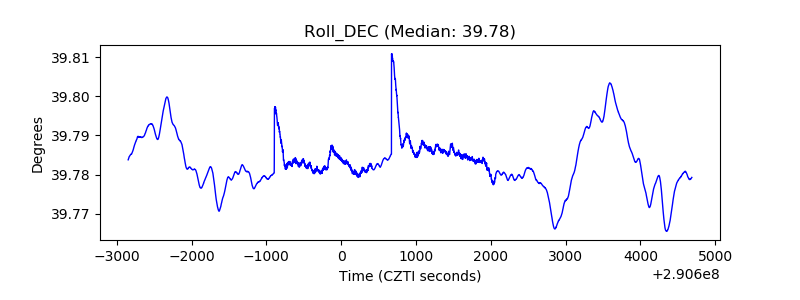 |
| _Roll_RA |  |
| Veto Counter | 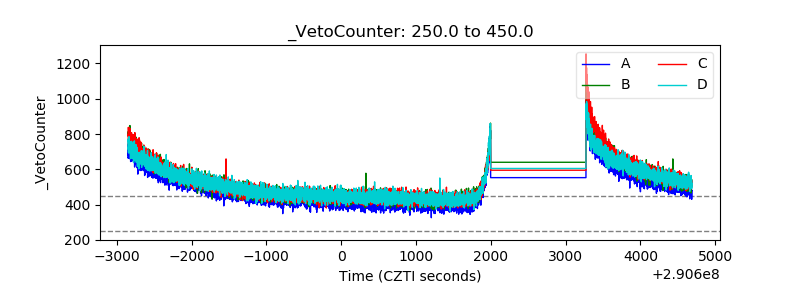 |