| Param | Original file | Final file |
|---|---|---|
| Filename | modeM0/AS1A05_156T01_9000002804_18759cztM0_level2.evt | modeM0/AS1A05_156T01_9000002804_18759cztM0_level2_quad_clean.evt |
| Size (bytes) | 313,652,160 | 42,128,640 |
| Size | 299.1 MB | 40.2 MB |
| Events in quadrant A | 2,012,367 | 258,846 |
| Events in quadrant B | 2,549,918 | 254,003 |
| Events in quadrant C | 2,257,360 | 246,424 |
| Events in quadrant D | 2,418,545 | 245,608 |
| Mode M0 | |||
|---|---|---|---|
| Quadrant | BADHDUFLAG | Total packets | Discarded packets |
| A | 0 | 8325 | 1 |
| B | 0 | 10057 | 1 |
| C | 0 | 9076 | 1 |
| D | 0 | 9675 | 1 |
| Mode M9 | |||
|---|---|---|---|
| Quadrant | BADHDUFLAG | Total packets | Discarded packets |
| A | 0 | 3 | 0 |
| B | 0 | 4 | 0 |
| C | 0 | 4 | 0 |
| D | 0 | 4 | 0 |
| Mode SS | |||
|---|---|---|---|
| Quadrant | BADHDUFLAG | Total packets | Discarded packets |
| A | 0 | 78 | 0 |
| B | 0 | 78 | 0 |
| C | 0 | 78 | 0 |
| D | 0 | 78 | 0 |
| Quadrant | Total seconds | Saturated seconds | Saturation percentage |
|---|---|---|---|
| A | 3821 | 14 | 0.366396% |
| B | 3821 | 98 | 2.564774% |
| C | 3821 | 46 | 1.203873% |
| D | 3821 | 34 | 0.889819% |
Noise dominated data is calculated using 1-second bins in cleaned event files. If a bin has >2000 counts, and if more than 50% of those come from <1% of pixels, then it is considered to be noise-dominated and hence unusable.
| Quadrant | # 1 sec bins | Bins with >0 counts | Bins with >2000 counts | High rate bins dominated by noise | Noise dominated (total time) | Noise dominated (detector-on time) | Marked lightcurve |
|---|---|---|---|---|---|---|---|
| A | 3821 | 3821 | 0 | 0 | 0.00% | 0.00% | 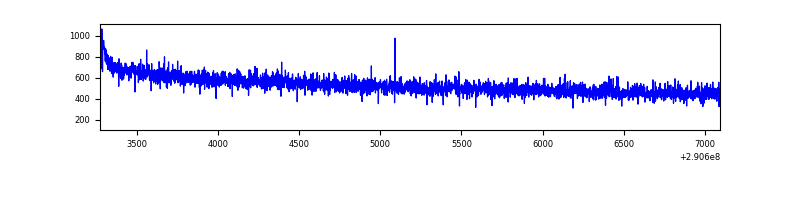 |
| B | 3821 | 3821 | 60 | 60 | 1.57% | 1.57% | 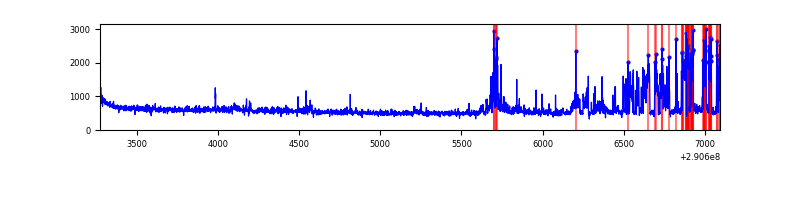 |
| C | 3821 | 3821 | 0 | 0 | 0.00% | 0.00% | 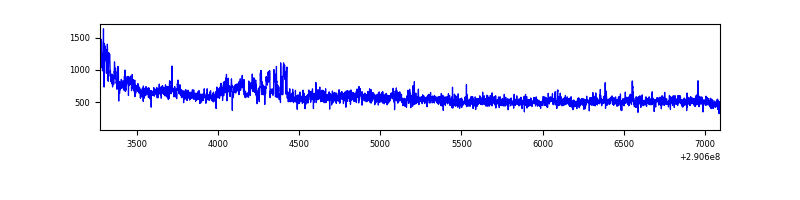 |
| D | 3821 | 3821 | 29 | 29 | 0.76% | 0.76% |  |
Top three noisy pixels from each quadrant. If the there are fewer than three noisy pixels in the level2.evt file, extra rows are filled as -1
| Pixel properties | Quadrant properties | ||||||
|---|---|---|---|---|---|---|---|
| Quadrant | DetID | PixID | Counts | Sigma | Mean | Median | Sigma |
| A | 13 | 254 | 5682 | 49.96 | 521 | 513 | 103.5 |
| A | 0 | 226 | 4655 | 40.03 | 521 | 513 | 103.5 |
| A | 12 | 194 | 3769 | 31.47 | 521 | 513 | 103.5 |
| B | 10 | 245 | 467068 | 4853.72 | 513 | 503 | 96.1 |
| B | 0 | 197 | 48930 | 503.79 | 513 | 503 | 96.1 |
| B | 12 | 111 | 10591 | 104.95 | 513 | 503 | 96.1 |
| C | 9 | 54 | 242920 | 2120.14 | 495 | 500 | 114.3 |
| C | 14 | 238 | 80705 | 701.45 | 495 | 500 | 114.3 |
| C | 13 | 61 | 3580 | 26.94 | 495 | 500 | 114.3 |
| D | 1 | 52 | 249448 | 2030.17 | 506 | 492 | 122.6 |
| D | 13 | 168 | 122264 | 993.02 | 506 | 492 | 122.6 |
| D | 7 | 38 | 80879 | 655.54 | 506 | 492 | 122.6 |
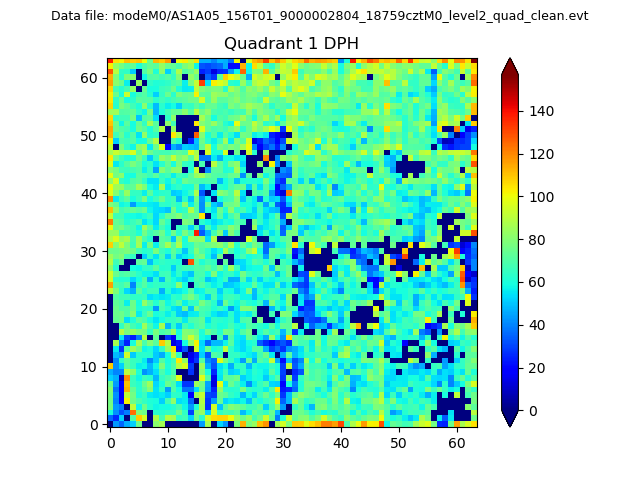
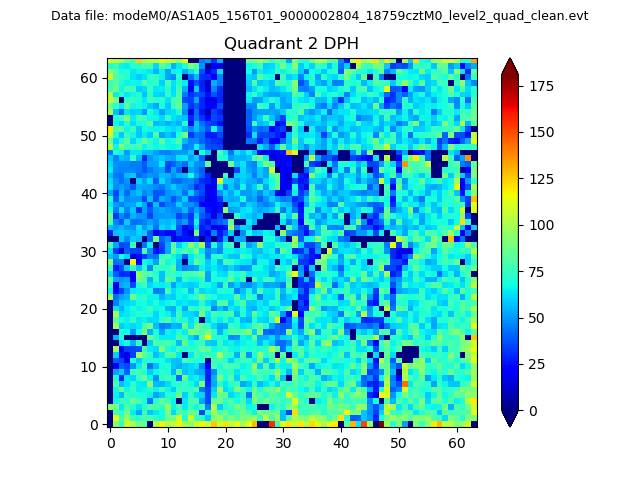
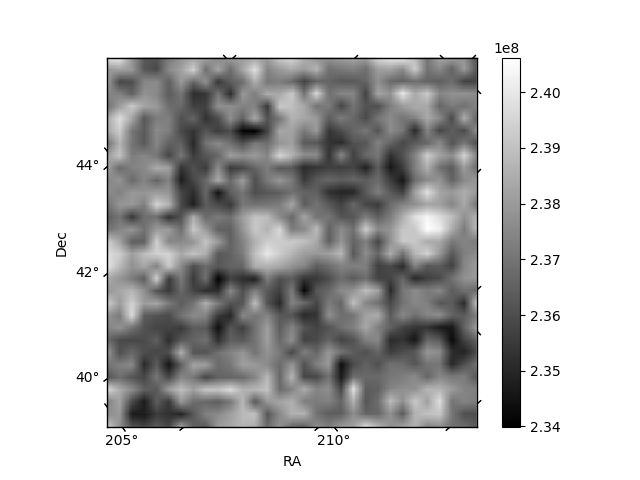
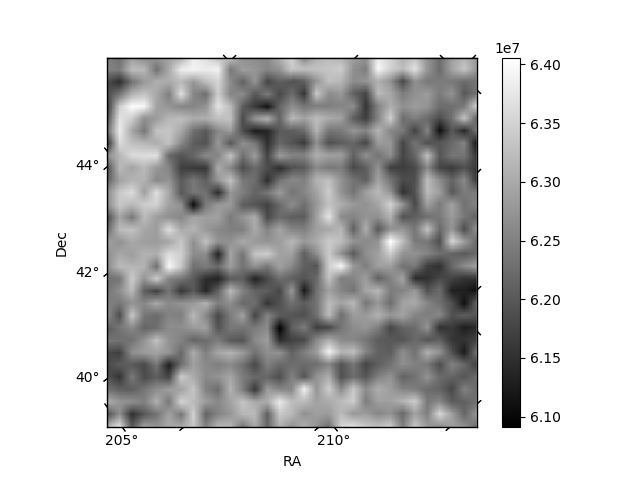
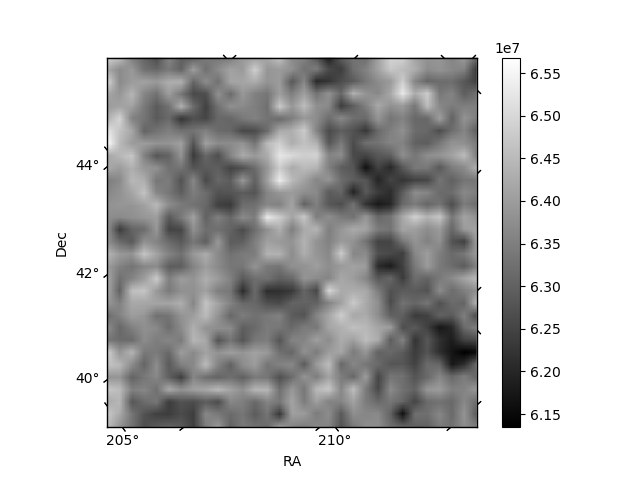
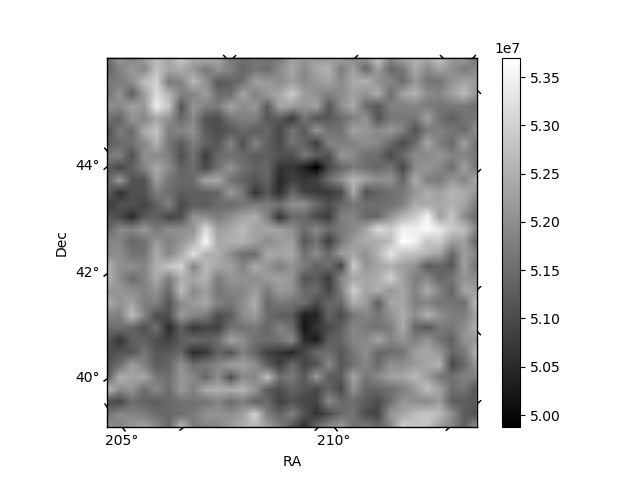
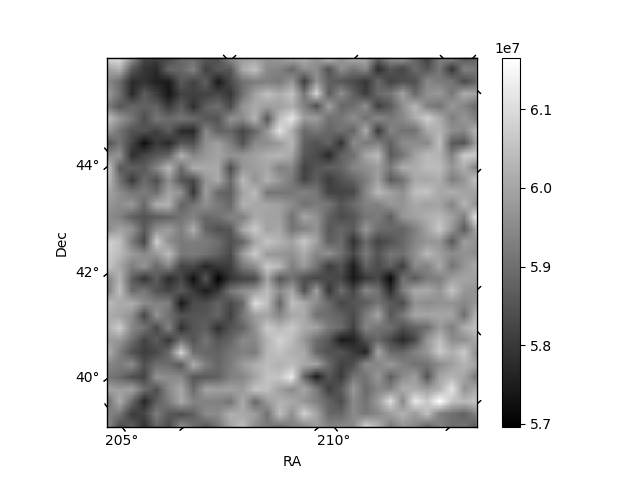
Histogram calculated using DETX and DETY for each event in the final _common_clean file
| Quadrant A | 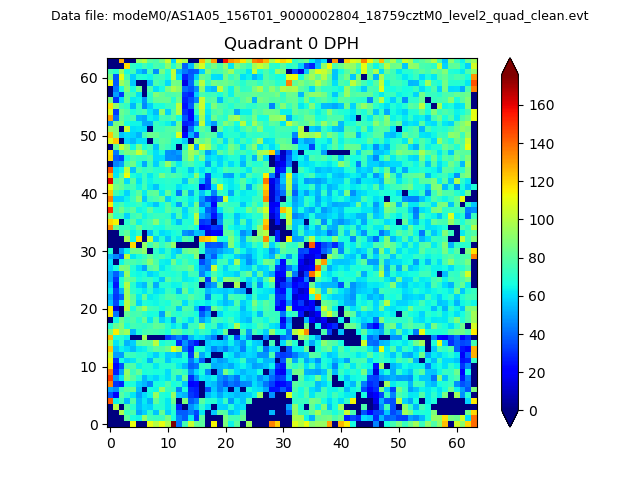 |
 |
Quadrant B |
|---|---|---|---|
| Quadrant D | 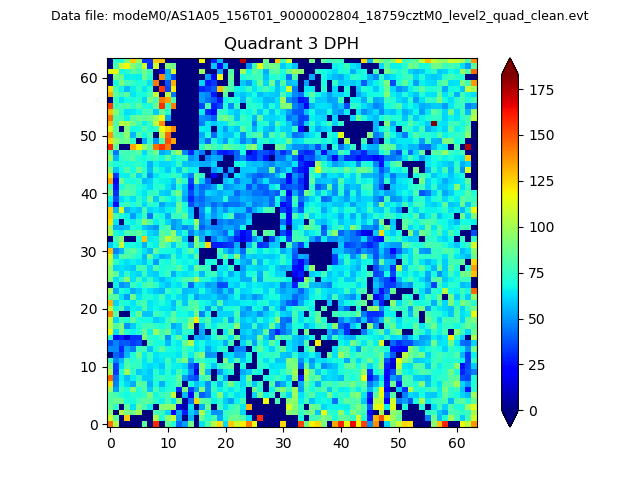 |
 |
Quadrant C |
| Plot type | Count rate plots | Images |
|---|---|---|
| Comparison with Poisson distribution Blue bars denote a histogram of data divided into 1 sec bins. Red curve is a Poisson curve with rate = median count rate of data. |
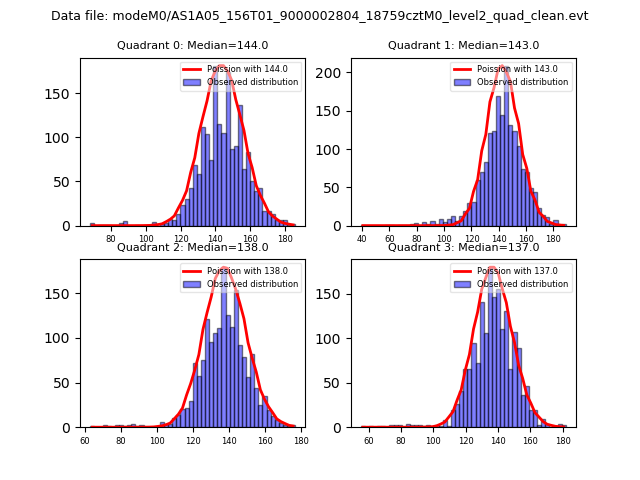 |
 |
| Quadrant-wise count rates Data is divided into 100 sec bins |
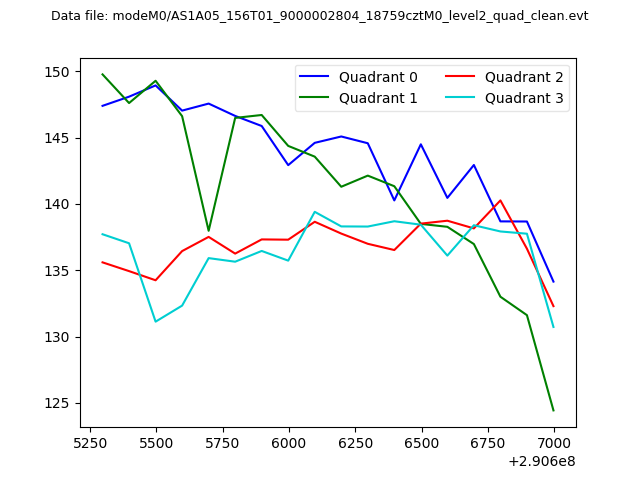 |
|
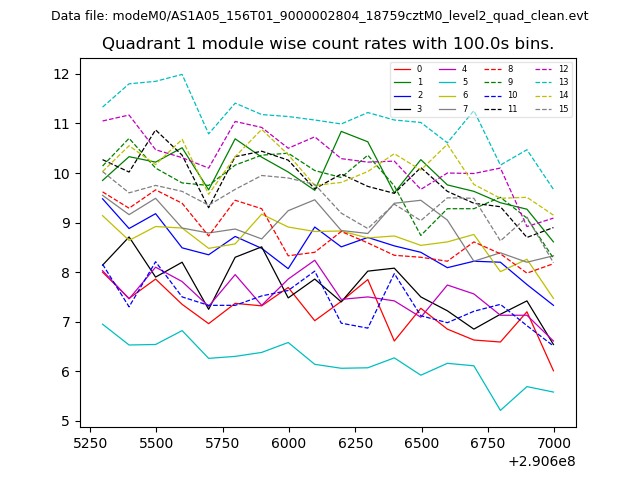
| Module-wise count rates for Quadrant A Data is divided into 100 sec bins |
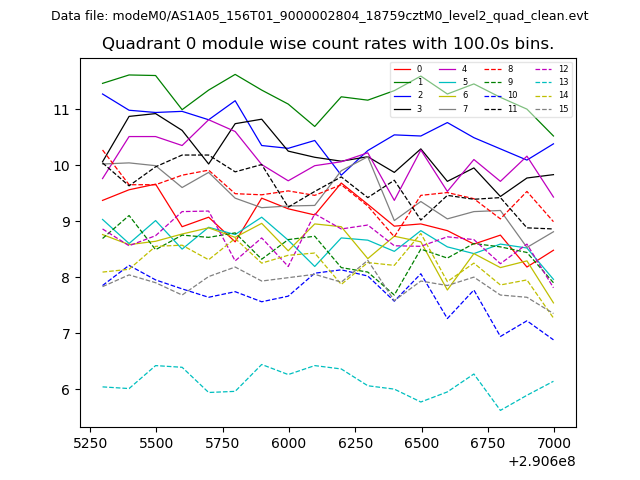 |
 |
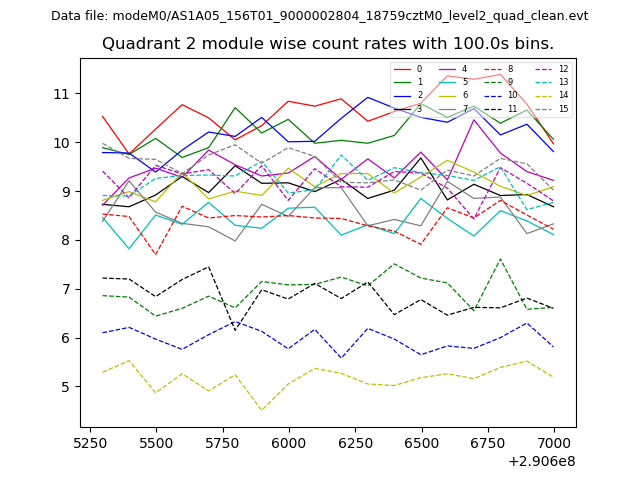
| Module-wise count rates for Quadrant B Data is divided into 100 sec bins |
 |
 |
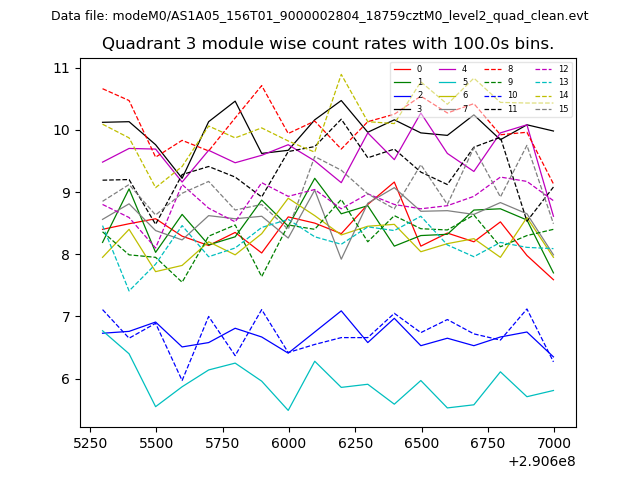
| Module-wise count rates for Quadrant C Data is divided into 100 sec bins |
 |
 |
| Module-wise count rates for Quadrant D Data is divided into 100 sec bins |
 |
 |
| Parameter | Plot |
|---|---|
| CZT HV Monitor | 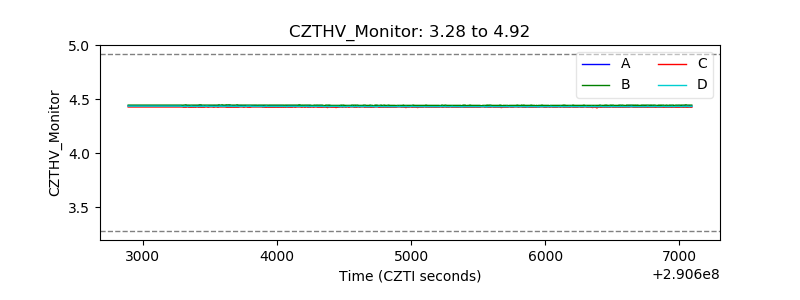 |
| D_VDD | 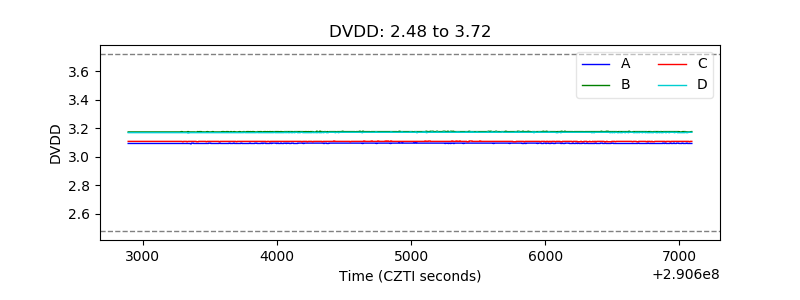 |
| Temperature 1 | 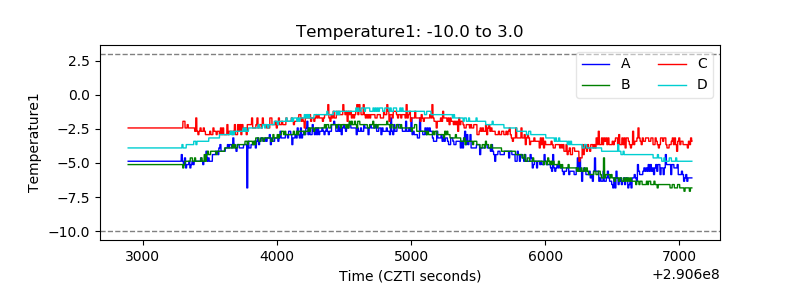 |
| Veto HV Monitor | 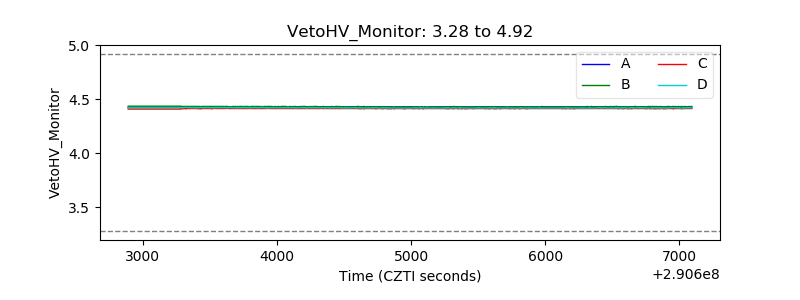 |
| Veto LLD | 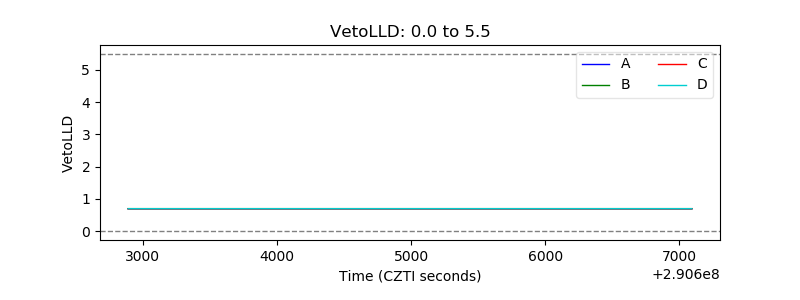 |
| Alpha Counter | 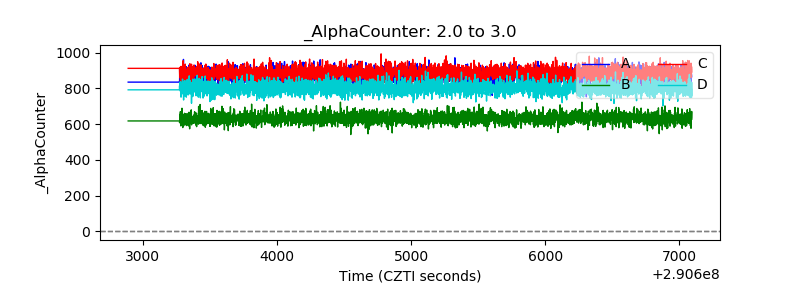 |
| _CPM_Rate | 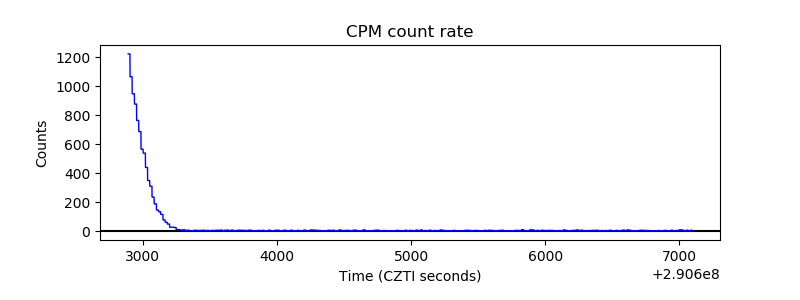 |
| CZT Counter | 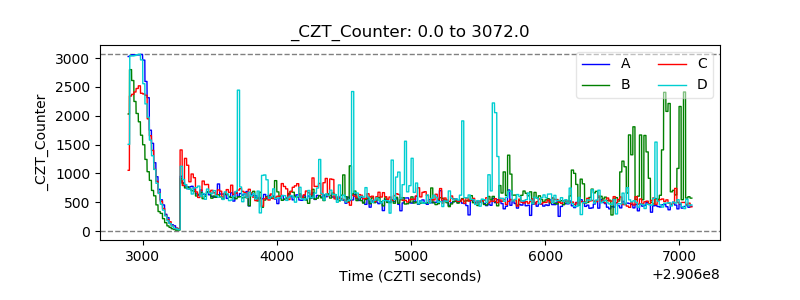 |
| +2.5 Volts monitor | 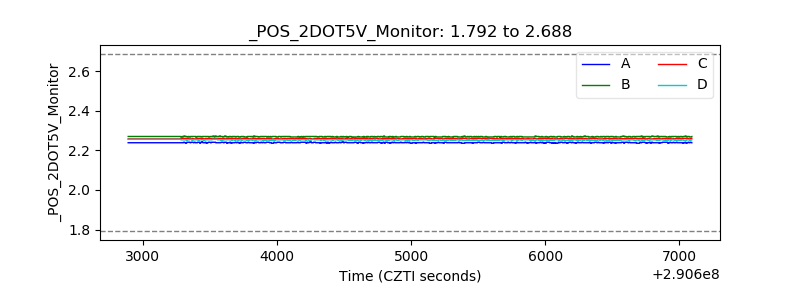 |
| +5 Volts monitor | 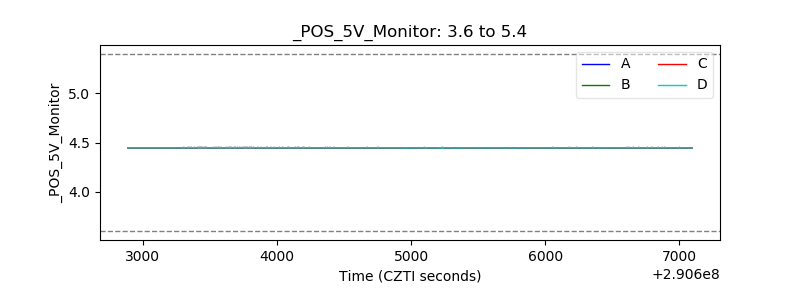 |
| _ROLL_ROT |  |
| _Roll_DEC | 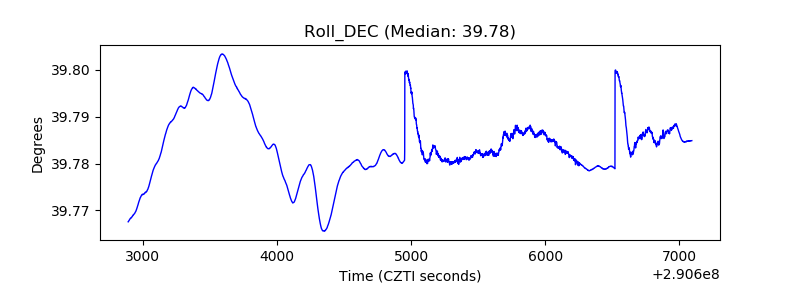 |
| _Roll_RA | 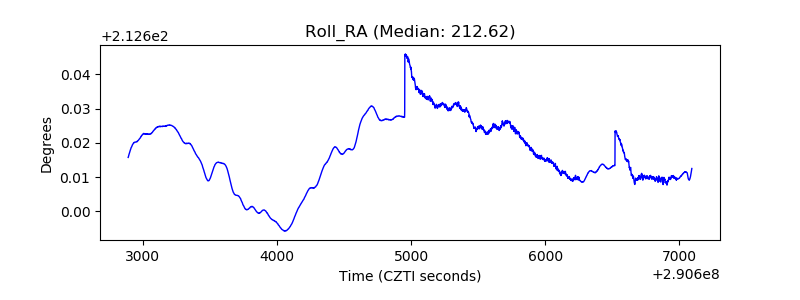 |
| Veto Counter | 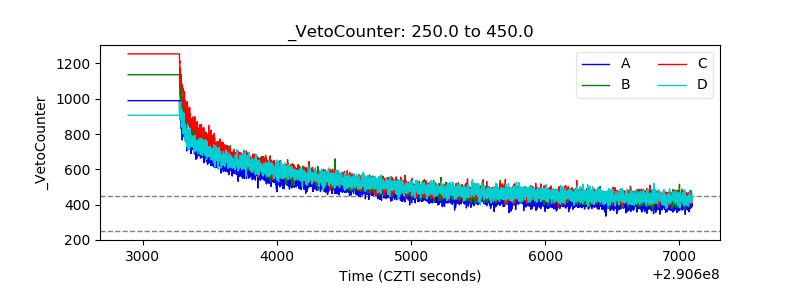 |