| Param | Original file | Final file |
|---|---|---|
| Filename | modeM0/AS1A05_115T03_9000002806cztM0_level2.fits | modeM0/AS1A05_115T03_9000002806cztM0_level2_quad_clean.evt |
| Size (bytes) | 592,329,600 | 577,978,560 |
| Size | 564.9 MB | 551.2 MB |
| Events in quadrant A | 3,614,330 | 3,448,737 |
| Events in quadrant B | 3,491,162 | 3,482,226 |
| Events in quadrant C | 3,543,892 | 3,336,997 |
| Events in quadrant D | 3,128,812 | 3,075,967 |
| Mode SS | |||
|---|---|---|---|
| Quadrant | BADHDUFLAG | Total packets | Discarded packets |
| A | 0 | 1234 | 0 |
| B | 0 | 1234 | 0 |
| C | 0 | 1234 | 0 |
| D | 0 | 1234 | 0 |
| Mode M0 | |||
|---|---|---|---|
| Quadrant | BADHDUFLAG | Total packets | Discarded packets |
| A | 0 | 130731 | 0 |
| B | 0 | 126756 | 0 |
| C | 0 | 128164 | 0 |
| D | 0 | 135280 | 0 |
| Mode M9 | |||
|---|---|---|---|
| Quadrant | BADHDUFLAG | Total packets | Discarded packets |
| A | 0 | 86 | 0 |
| B | 0 | 86 | 0 |
| C | 0 | 86 | 0 |
| D | 0 | 86 | 0 |
| Quadrant | Total seconds | Saturated seconds | Saturation percentage |
|---|---|---|---|
| A | 60658 | 920 | 1.516700% |
| B | 60658 | 879 | 1.449108% |
| C | 60658 | 1045 | 1.722774% |
| D | 60658 | 1072 | 1.767285% |
Noise dominated data is calculated using 1-second bins in cleaned event files. If a bin has >2000 counts, and if more than 50% of those come from <1% of pixels, then it is considered to be noise-dominated and hence unusable.
| Quadrant | # 1 sec bins | Bins with >0 counts | Bins with >2000 counts | High rate bins dominated by noise | Noise dominated (total time) | Noise dominated (detector-on time) | Marked lightcurve |
|---|---|---|---|---|---|---|---|
| A | 69208 | 60654 | 0 | 0 | 0.00% | 0.00% |  |
| B | 69208 | 60658 | 0 | 0 | 0.00% | 0.00% |  |
| C | 69208 | 60658 | 0 | 0 | 0.00% | 0.00% |  |
| D | 69208 | 60654 | 0 | 0 | 0.00% | 0.00% |  |
Top three noisy pixels from each quadrant. If the there are fewer than three noisy pixels in the level2.evt file, extra rows are filled as -1
| Pixel properties | Quadrant properties | ||||||
|---|---|---|---|---|---|---|---|
| Quadrant | DetID | PixID | Counts | Sigma | Mean | Median | Sigma |
| A | 0 | 29 | 3485 | 11.04 | 941 | 881 | 235.9 |
| A | 7 | 110 | 2904 | 8.57 | 941 | 881 | 235.9 |
| A | 9 | 19 | 2663 | 7.55 | 941 | 881 | 235.9 |
| B | 2 | 9 | 2938 | 11.22 | 920 | 874 | 183.9 |
| B | 2 | 8 | 2466 | 8.66 | 920 | 874 | 183.9 |
| B | 5 | 128 | 2316 | 7.84 | 920 | 874 | 183.9 |
| C | 3 | 126 | 2470 | 6.6 | 936 | 870 | 242.4 |
| C | 12 | 241 | 2429 | 6.43 | 936 | 870 | 242.4 |
| C | 12 | 249 | 2414 | 6.37 | 936 | 870 | 242.4 |
| D | 10 | 190 | 2337 | 6.41 | 892 | 815 | 237.5 |
| D | 3 | 14 | 2210 | 5.87 | 892 | 815 | 237.5 |
| D | 15 | 46 | 2167 | 5.69 | 892 | 815 | 237.5 |
Histogram calculated using DETX and DETY for each event in the final _common_clean file
| Quadrant A | 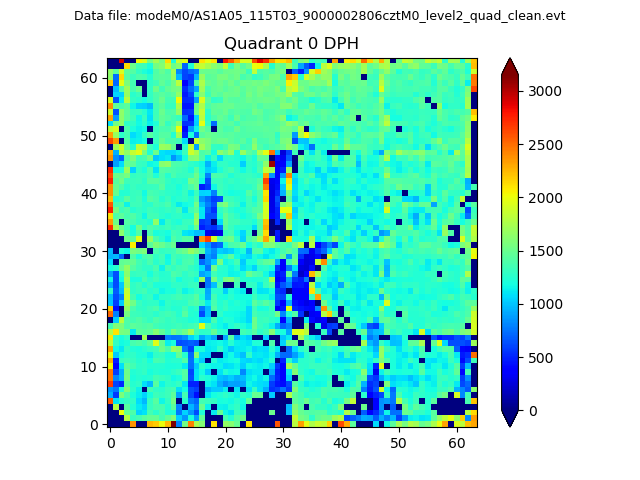 |
 |
Quadrant B |
|---|---|---|---|
| Quadrant D |  |
 |
Quadrant C |
| Plot type | Count rate plots | Images |
|---|---|---|
| Comparison with Poisson distribution Blue bars denote a histogram of data divided into 1 sec bins. Red curve is a Poisson curve with rate = median count rate of data. |
 |
 |
| Quadrant-wise count rates Data is divided into 100 sec bins |
 |
|
| Module-wise count rates for Quadrant A Data is divided into 100 sec bins |
 |
 |
| Module-wise count rates for Quadrant B Data is divided into 100 sec bins |
 |
 |
| Module-wise count rates for Quadrant C Data is divided into 100 sec bins |
 |
 |
| Module-wise count rates for Quadrant D Data is divided into 100 sec bins |
 |
 |
| Parameter | Plot |
|---|---|
| CZT HV Monitor |  |
| D_VDD |  |
| Temperature 1 |  |
| Veto HV Monitor |  |
| Veto LLD |  |
| Alpha Counter |  |
| _CPM_Rate |  |
| CZT Counter |  |
| +2.5 Volts monitor |  |
| +5 Volts monitor |  |
| _ROLL_ROT |  |
| _Roll_DEC |  |
| _Roll_RA |  |
| Veto Counter |  |