| Param | Original file | Final file |
|---|---|---|
| Filename | modeM0/AS1A05_115T03_9000002806_18759cztM0_level2.evt | modeM0/AS1A05_115T03_9000002806_18759cztM0_level2_quad_clean.evt |
| Size (bytes) | 171,066,240 | 18,705,600 |
| Size | 163.1 MB | 17.8 MB |
| Events in quadrant A | 1,286,585 | 102,770 |
| Events in quadrant B | 1,264,567 | 104,555 |
| Events in quadrant C | 1,243,498 | 102,421 |
| Events in quadrant D | 1,240,020 | 102,609 |
| Mode SS | |||
|---|---|---|---|
| Quadrant | BADHDUFLAG | Total packets | Discarded packets |
| A | 0 | 44 | 0 |
| B | 0 | 44 | 0 |
| C | 0 | 44 | 0 |
| D | 0 | 44 | 0 |
| Mode M0 | |||
|---|---|---|---|
| Quadrant | BADHDUFLAG | Total packets | Discarded packets |
| A | 0 | 5222 | 1 |
| B | 0 | 5091 | 1 |
| C | 0 | 4982 | 1 |
| D | 0 | 4952 | 1 |
| Mode M9 | |||
|---|---|---|---|
| Quadrant | BADHDUFLAG | Total packets | Discarded packets |
| A | 0 | 13 | 0 |
| B | 0 | 13 | 0 |
| C | 0 | 13 | 0 |
| D | 0 | 13 | 0 |
| Quadrant | Total seconds | Saturated seconds | Saturation percentage |
|---|---|---|---|
| A | 2117 | 105 | 4.959849% |
| B | 2117 | 118 | 5.573925% |
| C | 2117 | 126 | 5.951819% |
| D | 2117 | 91 | 4.298536% |
Noise dominated data is calculated using 1-second bins in cleaned event files. If a bin has >2000 counts, and if more than 50% of those come from <1% of pixels, then it is considered to be noise-dominated and hence unusable.
| Quadrant | # 1 sec bins | Bins with >0 counts | Bins with >2000 counts | High rate bins dominated by noise | Noise dominated (total time) | Noise dominated (detector-on time) | Marked lightcurve |
|---|---|---|---|---|---|---|---|
| A | 3382 | 2118 | 0 | 0 | 0.00% | 0.00% | 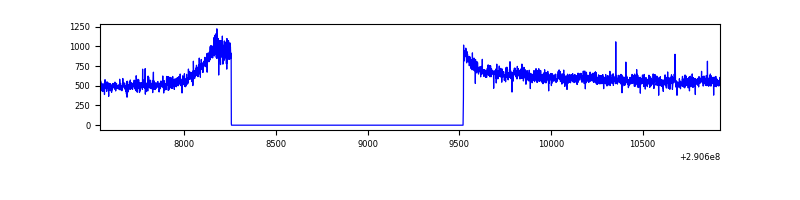 |
| B | 3382 | 2118 | 0 | 0 | 0.00% | 0.00% | 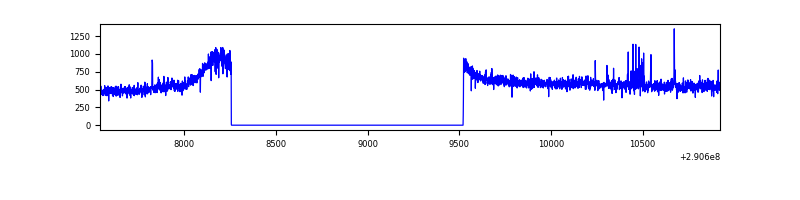 |
| C | 3382 | 2118 | 0 | 0 | 0.00% | 0.00% | 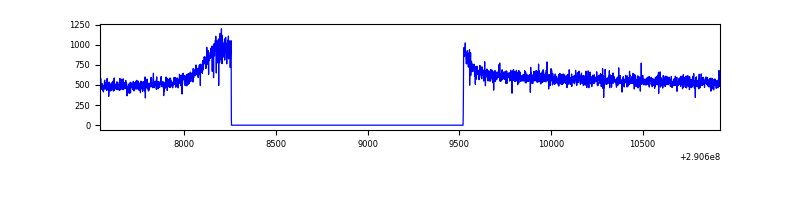 |
| D | 3382 | 2118 | 0 | 0 | 0.00% | 0.00% | 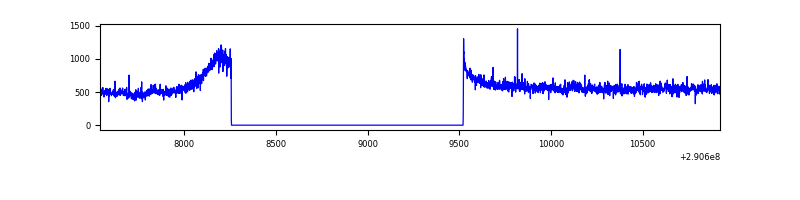 |
Top three noisy pixels from each quadrant. If the there are fewer than three noisy pixels in the level2.evt file, extra rows are filled as -1
| Pixel properties | Quadrant properties | ||||||
|---|---|---|---|---|---|---|---|
| Quadrant | DetID | PixID | Counts | Sigma | Mean | Median | Sigma |
| A | 11 | 29 | 14189 | 207.67 | 324 | 318 | 66.8 |
| A | 8 | 205 | 12221 | 178.21 | 324 | 318 | 66.8 |
| A | 15 | 192 | 10499 | 152.43 | 324 | 318 | 66.8 |
| B | 10 | 245 | 9215 | 140.54 | 318 | 310 | 63.4 |
| B | 4 | 216 | 9151 | 139.53 | 318 | 310 | 63.4 |
| B | 12 | 111 | 7374 | 111.49 | 318 | 310 | 63.4 |
| C | 14 | 238 | 47329 | 644.35 | 306 | 310 | 73.0 |
| C | 13 | 61 | 2090 | 24.39 | 306 | 310 | 73.0 |
| C | 14 | 111 | 714 | 5.54 | 306 | 310 | 73.0 |
| D | 13 | 168 | 24912 | 318.74 | 316 | 307 | 77.2 |
| D | 7 | 223 | 13561 | 171.69 | 316 | 307 | 77.2 |
| D | 2 | 234 | 9081 | 113.66 | 316 | 307 | 77.2 |
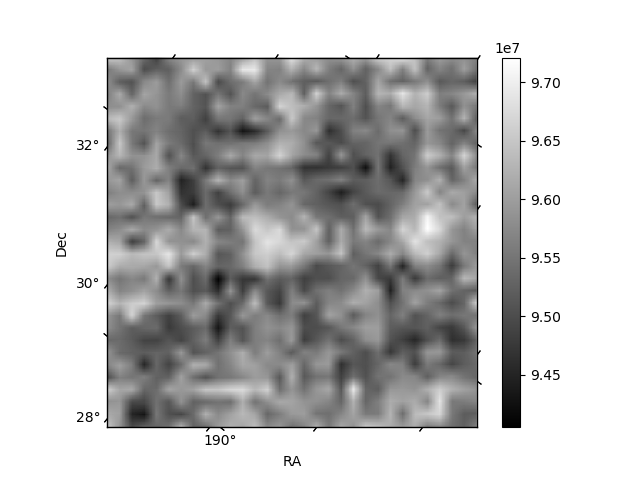
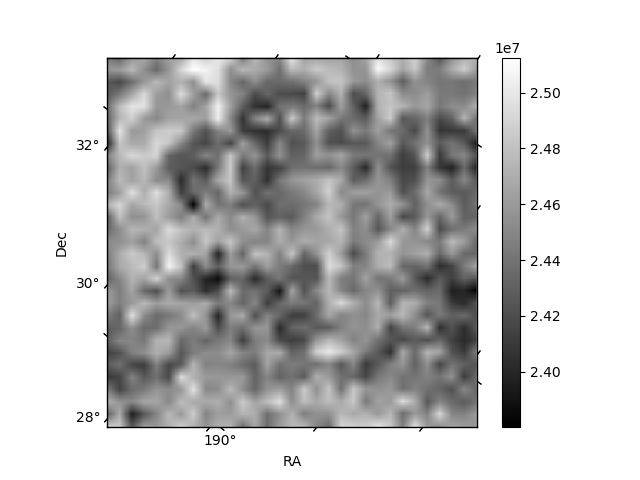
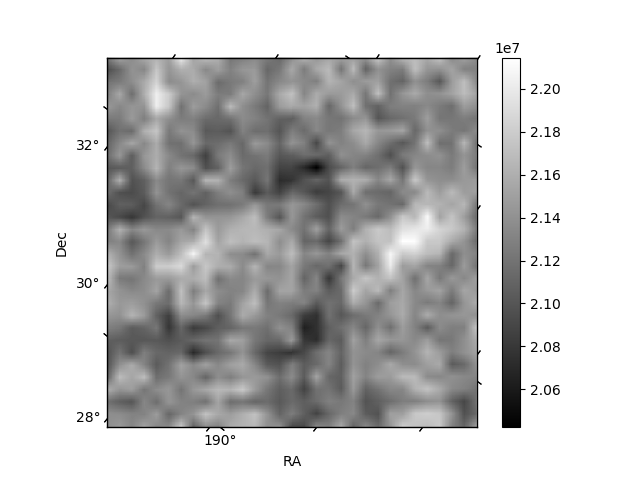
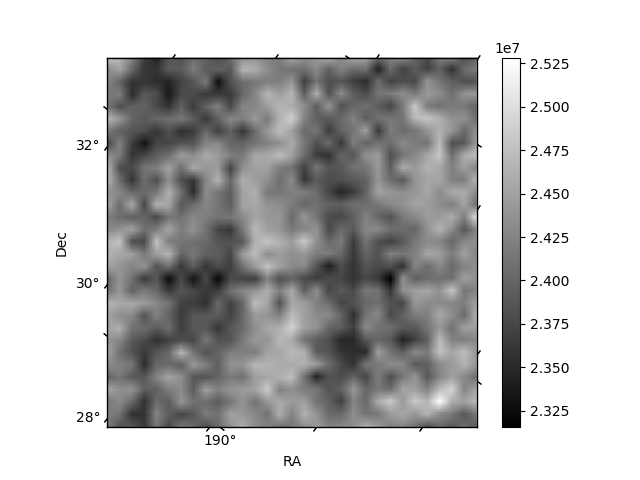
Histogram calculated using DETX and DETY for each event in the final _common_clean file
| Quadrant A | 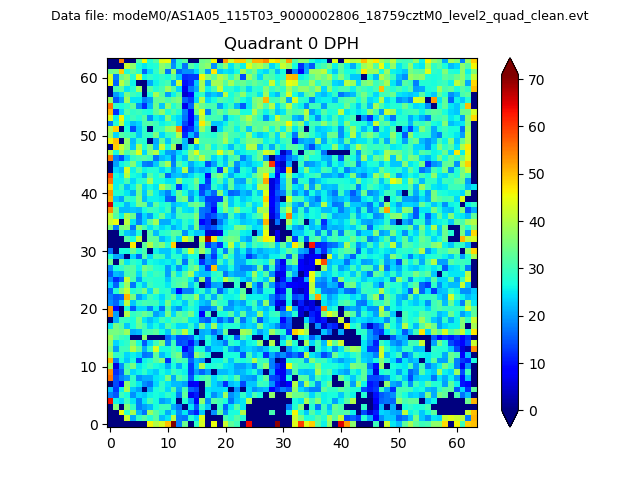 |
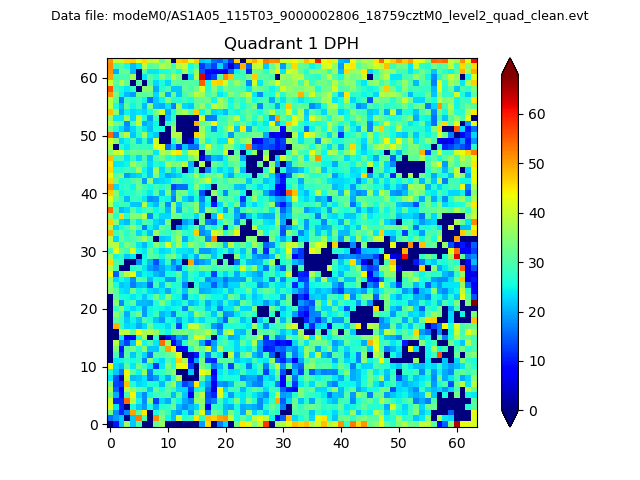 |
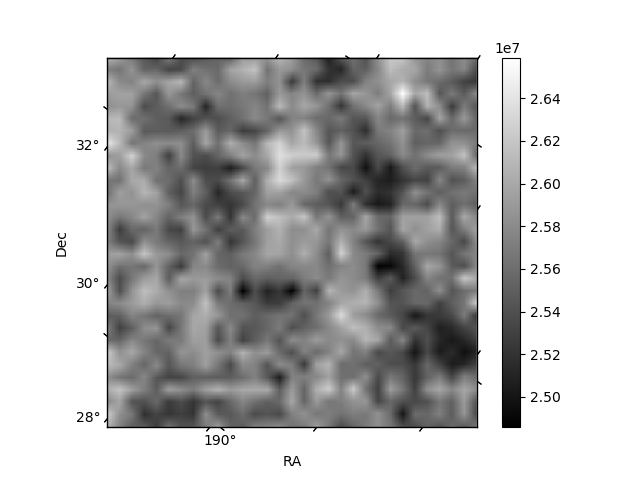
Quadrant B |
|---|---|---|---|
| Quadrant D | 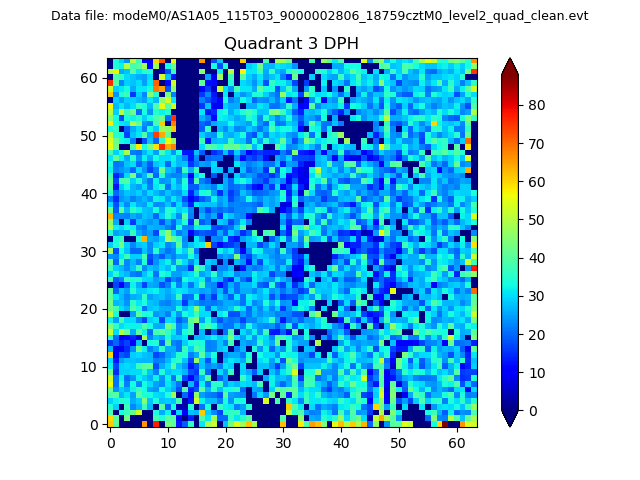 |
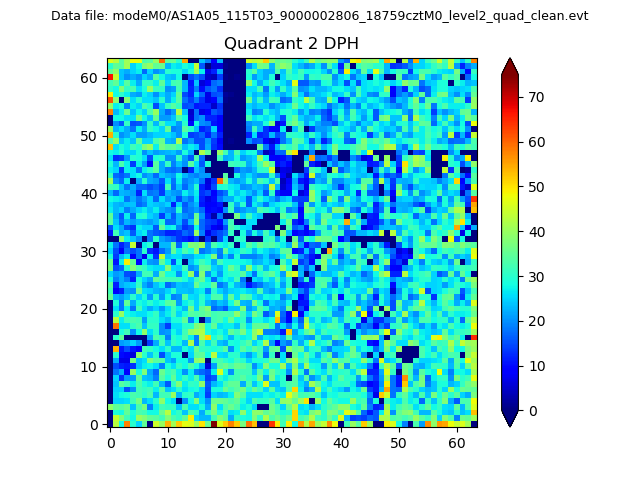 |
Quadrant C |
| Plot type | Count rate plots | Images |
|---|---|---|
| Comparison with Poisson distribution Blue bars denote a histogram of data divided into 1 sec bins. Red curve is a Poisson curve with rate = median count rate of data. |
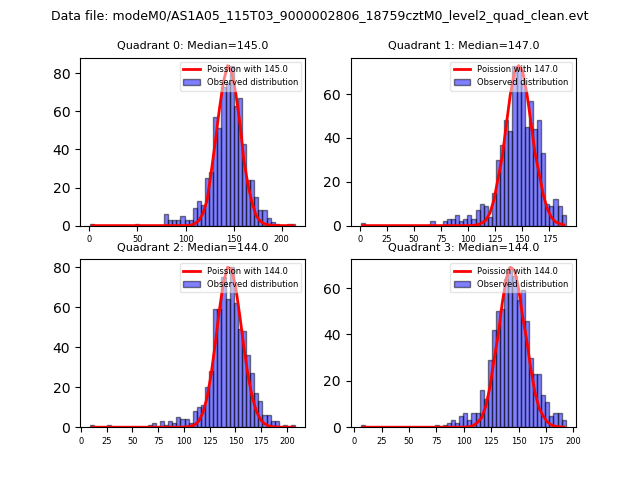 |
 |
| Quadrant-wise count rates Data is divided into 100 sec bins |
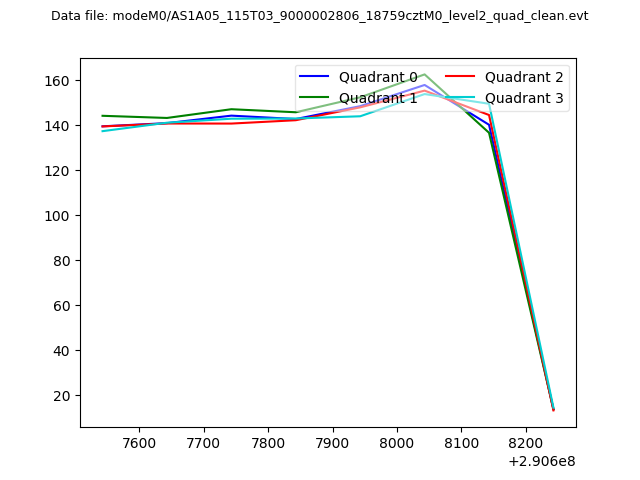 |
|
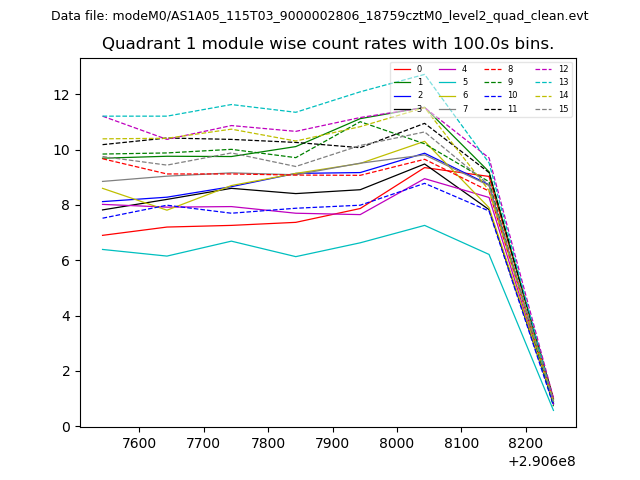
| Module-wise count rates for Quadrant A Data is divided into 100 sec bins |
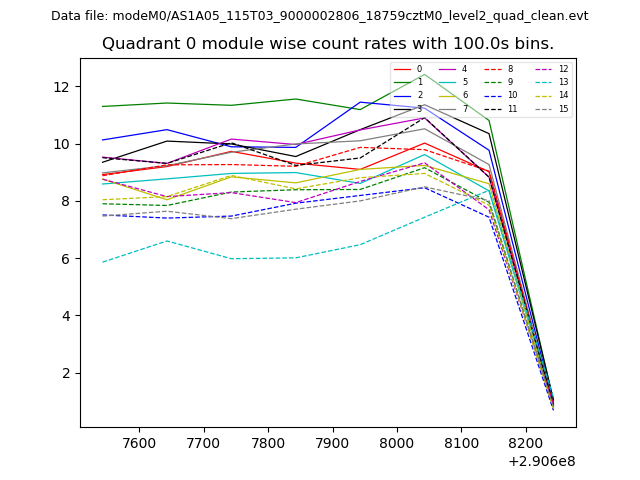 |
 |
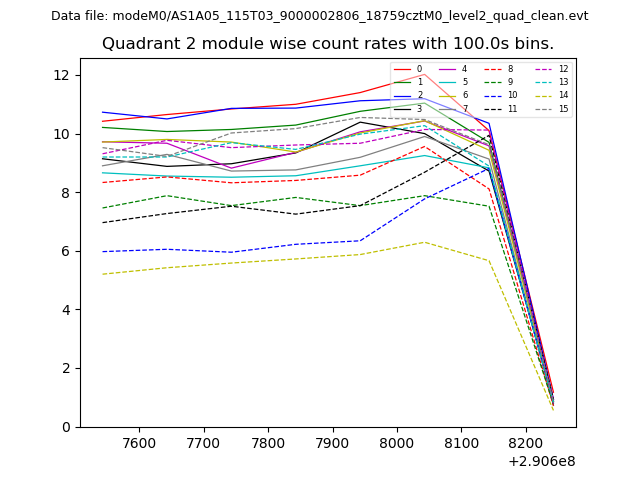
| Module-wise count rates for Quadrant B Data is divided into 100 sec bins |
 |
 |
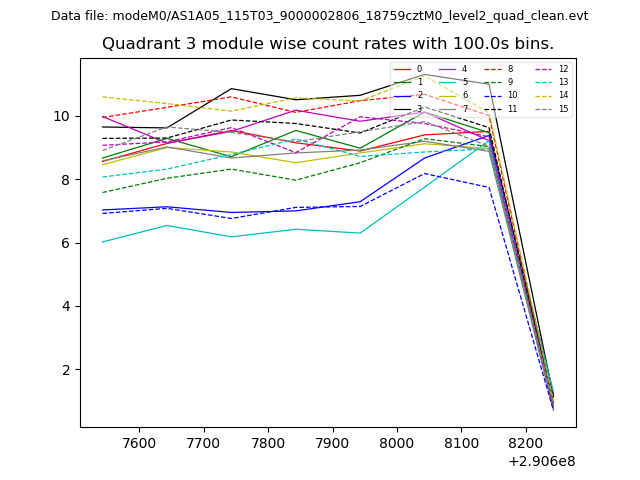
| Module-wise count rates for Quadrant C Data is divided into 100 sec bins |
 |
 |
| Module-wise count rates for Quadrant D Data is divided into 100 sec bins |
 |
 |
| Parameter | Plot |
|---|---|
| CZT HV Monitor | 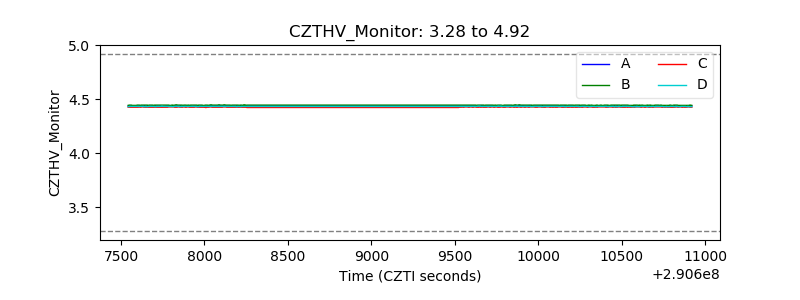 |
| D_VDD | 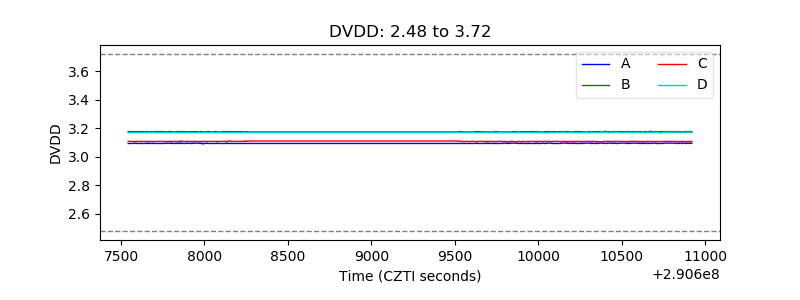 |
| Temperature 1 | 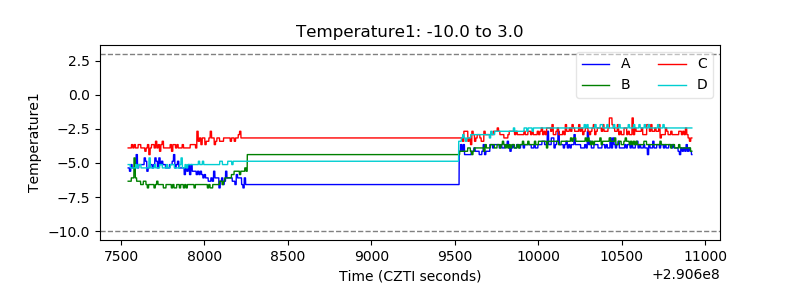 |
| Veto HV Monitor |  |
| Veto LLD | 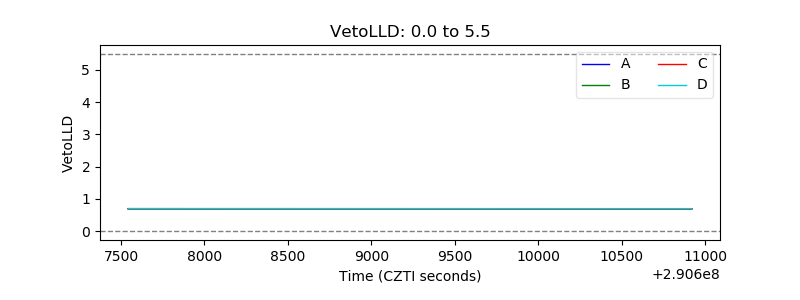 |
| Alpha Counter | 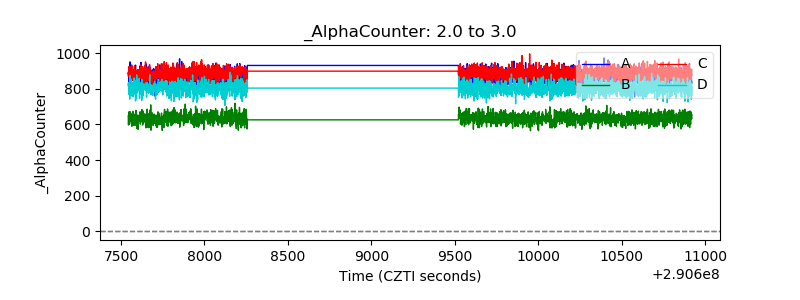 |
| _CPM_Rate | 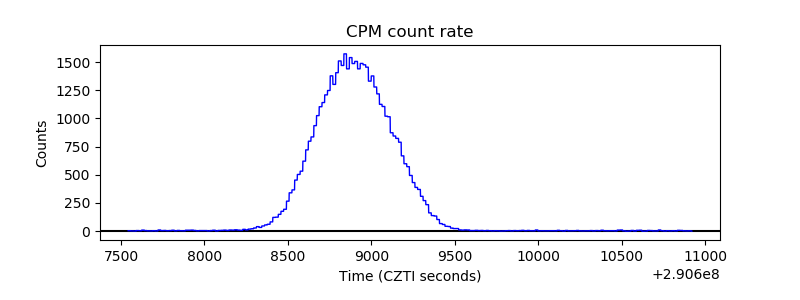 |
| CZT Counter |  |
| +2.5 Volts monitor |  |
| +5 Volts monitor |  |
| _ROLL_ROT | 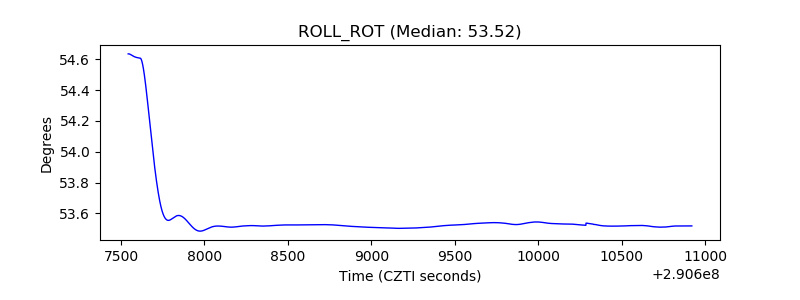 |
| _Roll_DEC | 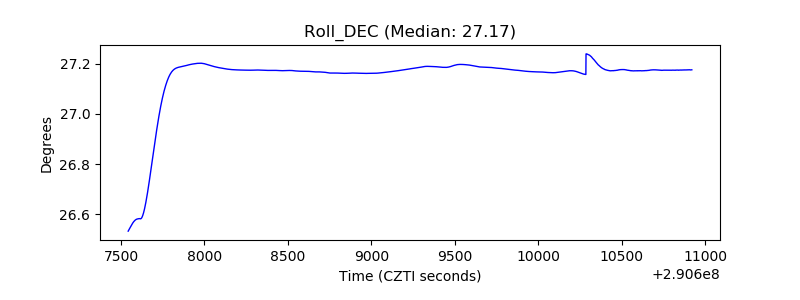 |
| _Roll_RA | 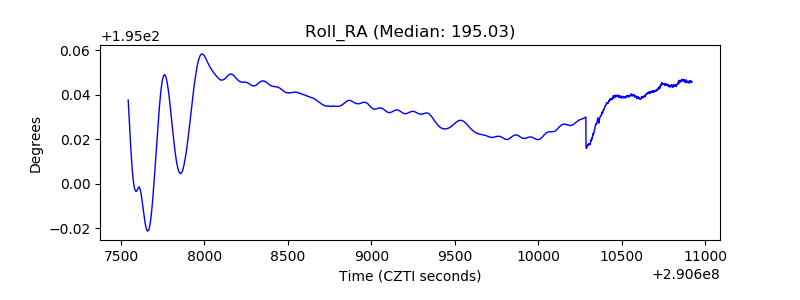 |
| Veto Counter | 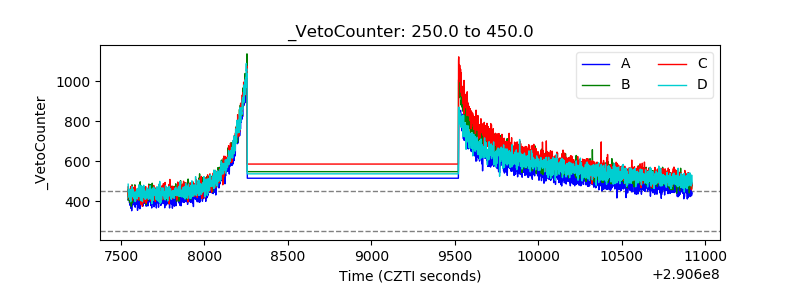 |