| Param | Original file | Final file |
|---|---|---|
| Filename | modeM0/AS1A05_115T03_9000002806_18761cztM0_level2.evt | modeM0/AS1A05_115T03_9000002806_18761cztM0_level2_quad_clean.evt |
| Size (bytes) | 478,088,640 | 95,840,640 |
| Size | 455.9 MB | 91.4 MB |
| Events in quadrant A | 3,434,042 | 613,853 |
| Events in quadrant B | 3,491,685 | 622,980 |
| Events in quadrant C | 3,545,225 | 600,685 |
| Events in quadrant D | 3,546,486 | 591,667 |
| Mode SS | |||
|---|---|---|---|
| Quadrant | BADHDUFLAG | Total packets | Discarded packets |
| A | 0 | 140 | 0 |
| B | 0 | 140 | 0 |
| C | 0 | 140 | 0 |
| D | 0 | 140 | 0 |
| Mode M0 | |||
|---|---|---|---|
| Quadrant | BADHDUFLAG | Total packets | Discarded packets |
| A | 0 | 14437 | 2 |
| B | 0 | 14615 | 2 |
| C | 0 | 14537 | 2 |
| D | 0 | 14989 | 2 |
| Mode M9 | |||
|---|---|---|---|
| Quadrant | BADHDUFLAG | Total packets | Discarded packets |
| A | 0 | 22 | 0 |
| B | 0 | 22 | 0 |
| C | 0 | 22 | 0 |
| D | 0 | 22 | 0 |
| Quadrant | Total seconds | Saturated seconds | Saturation percentage |
|---|---|---|---|
| A | 6791 | 139 | 2.046827% |
| B | 6791 | 176 | 2.591665% |
| C | 6790 | 188 | 2.768778% |
| D | 6790 | 118 | 1.737850% |
Noise dominated data is calculated using 1-second bins in cleaned event files. If a bin has >2000 counts, and if more than 50% of those come from <1% of pixels, then it is considered to be noise-dominated and hence unusable.
| Quadrant | # 1 sec bins | Bins with >0 counts | Bins with >2000 counts | High rate bins dominated by noise | Noise dominated (total time) | Noise dominated (detector-on time) | Marked lightcurve |
|---|---|---|---|---|---|---|---|
| A | 9011 | 6793 | 0 | 0 | 0.00% | 0.00% | 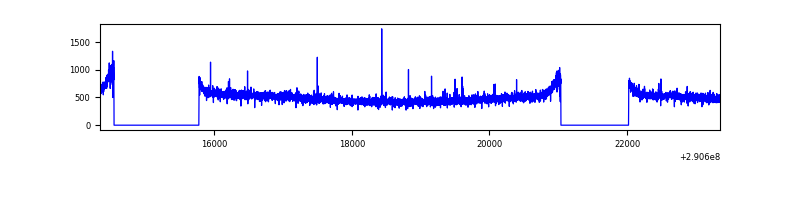 |
| B | 9011 | 6793 | 0 | 0 | 0.00% | 0.00% | 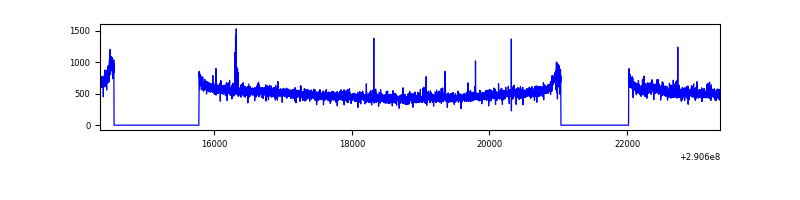 |
| C | 9010 | 6792 | 0 | 0 | 0.00% | 0.00% |  |
| D | 9010 | 6792 | 1 | 1 | 0.01% | 0.01% | 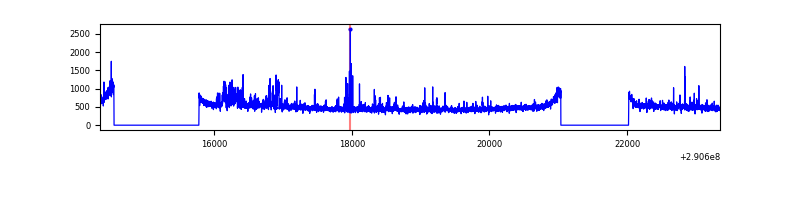 |
Top three noisy pixels from each quadrant. If the there are fewer than three noisy pixels in the level2.evt file, extra rows are filled as -1
| Pixel properties | Quadrant properties | ||||||
|---|---|---|---|---|---|---|---|
| Quadrant | DetID | PixID | Counts | Sigma | Mean | Median | Sigma |
| A | 9 | 143 | 18620 | 99.83 | 884 | 866 | 177.8 |
| A | 13 | 254 | 9091 | 46.25 | 884 | 866 | 177.8 |
| A | 0 | 226 | 7766 | 38.8 | 884 | 866 | 177.8 |
| B | 0 | 229 | 23556 | 134.36 | 880 | 857 | 168.9 |
| B | 12 | 111 | 20332 | 115.28 | 880 | 857 | 168.9 |
| B | 4 | 216 | 19371 | 109.59 | 880 | 857 | 168.9 |
| C | 14 | 238 | 132695 | 660.51 | 856 | 864 | 199.6 |
| C | 3 | 233 | 77425 | 383.59 | 856 | 864 | 199.6 |
| C | 13 | 61 | 6005 | 25.76 | 856 | 864 | 199.6 |
| D | 1 | 52 | 180166 | 844.63 | 872 | 850 | 212.3 |
| D | 7 | 96 | 50990 | 236.17 | 872 | 850 | 212.3 |
| D | 2 | 234 | 29883 | 136.75 | 872 | 850 | 212.3 |
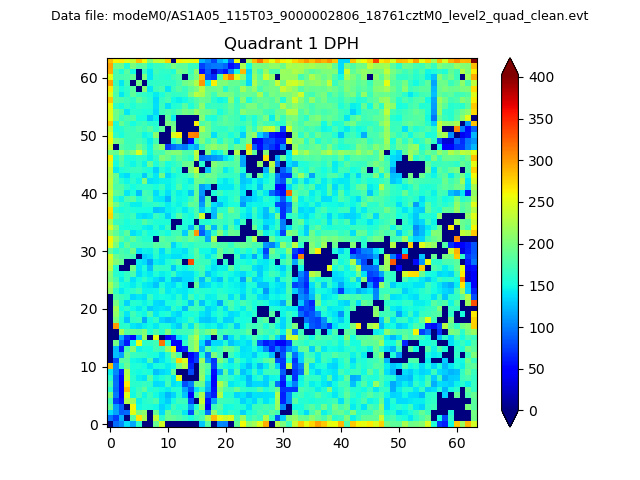
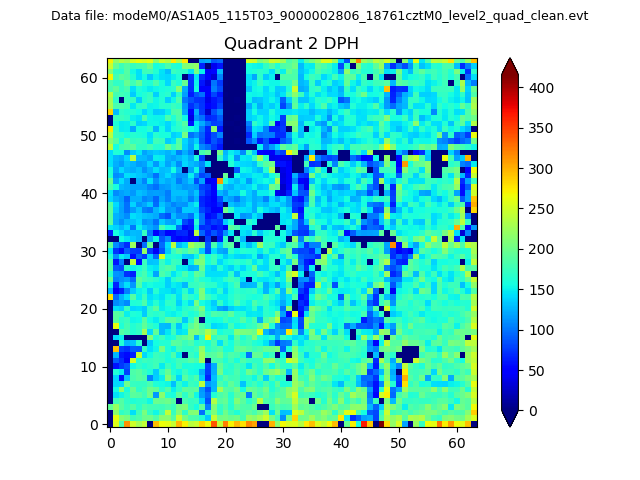
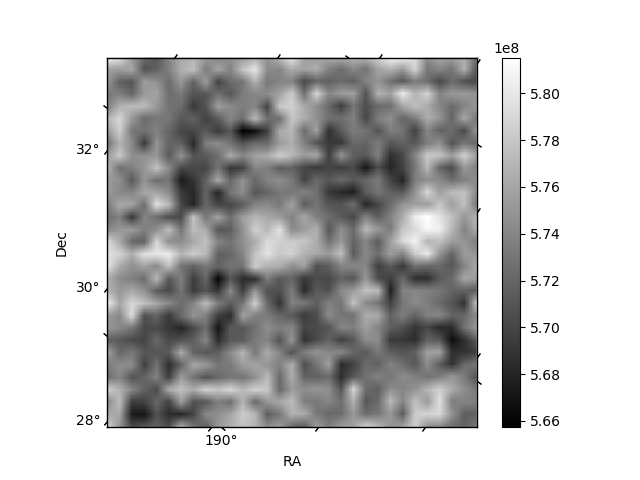
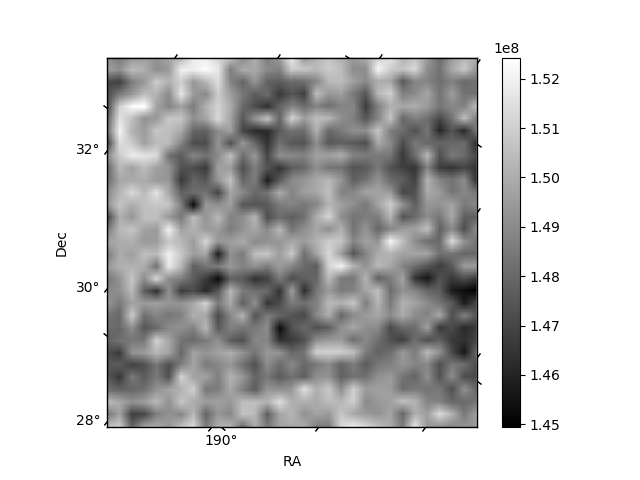
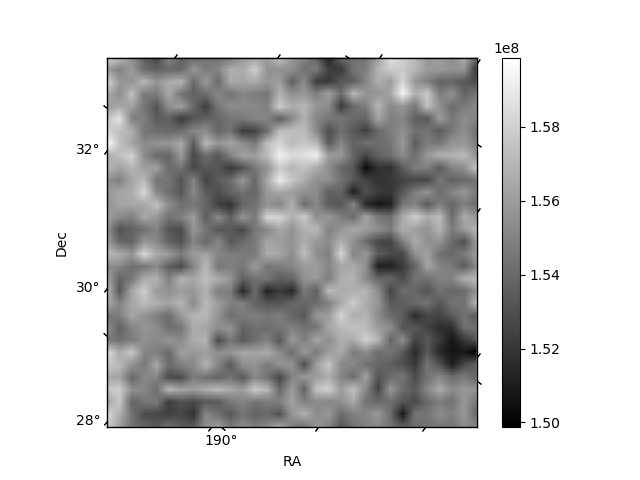
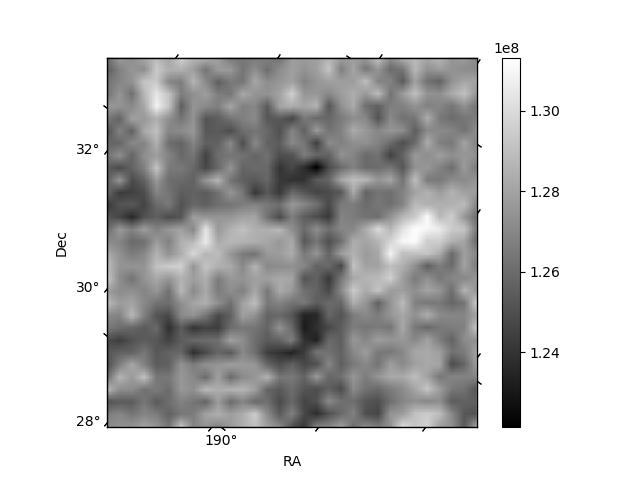
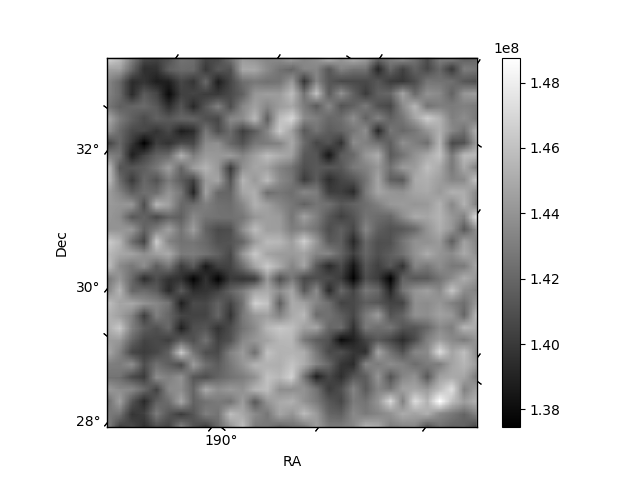
Histogram calculated using DETX and DETY for each event in the final _common_clean file
| Quadrant A | 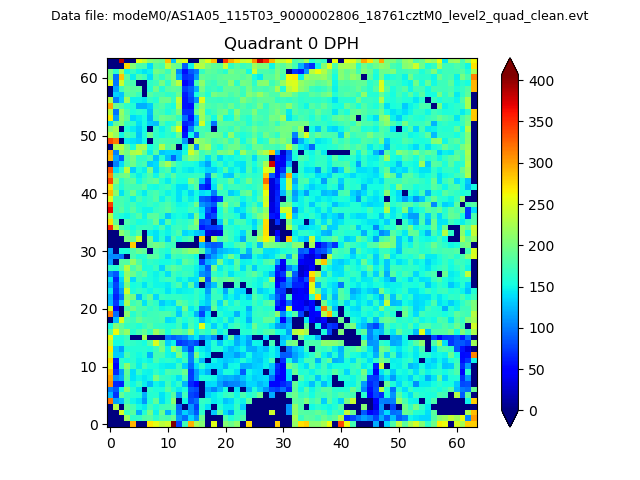 |
 |
Quadrant B |
|---|---|---|---|
| Quadrant D | 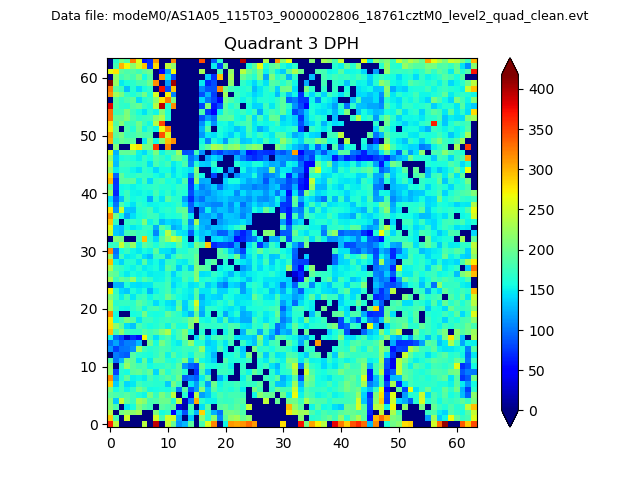 |
 |
Quadrant C |
| Plot type | Count rate plots | Images |
|---|---|---|
| Comparison with Poisson distribution Blue bars denote a histogram of data divided into 1 sec bins. Red curve is a Poisson curve with rate = median count rate of data. |
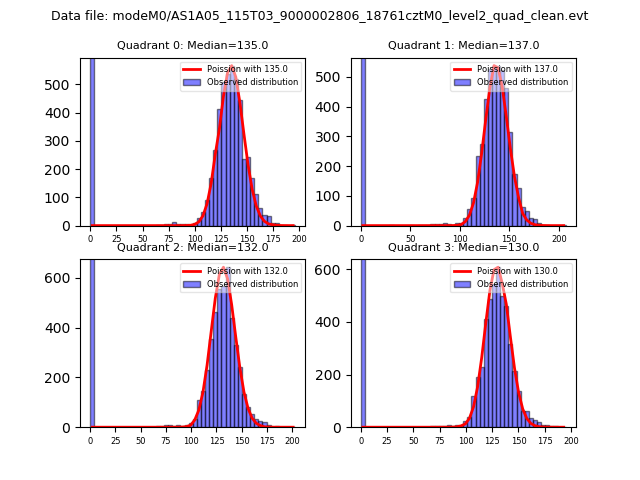 |
 |
| Quadrant-wise count rates Data is divided into 100 sec bins |
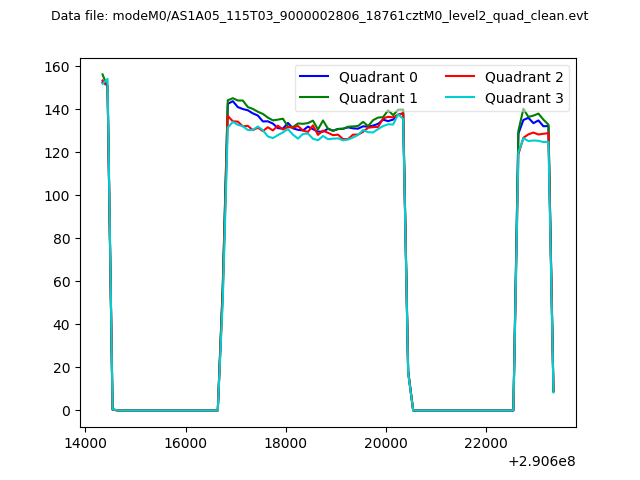 |
|
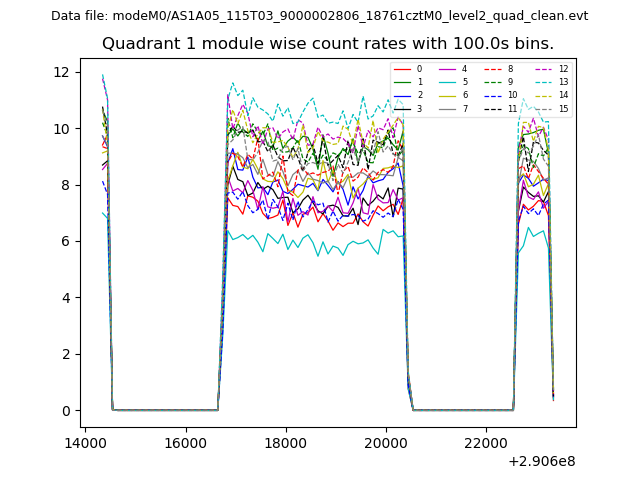
| Module-wise count rates for Quadrant A Data is divided into 100 sec bins |
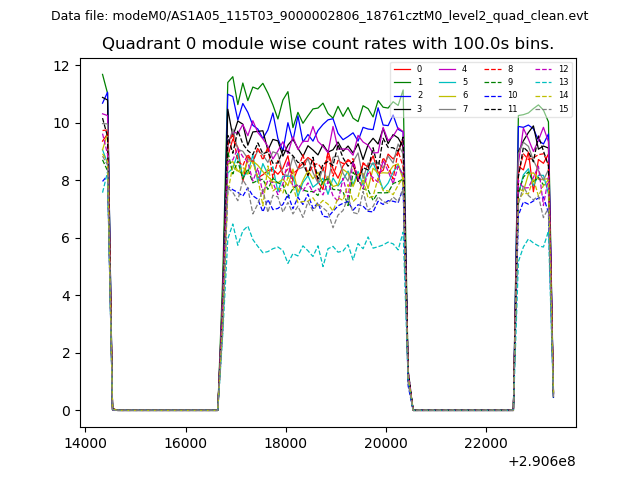 |
 |
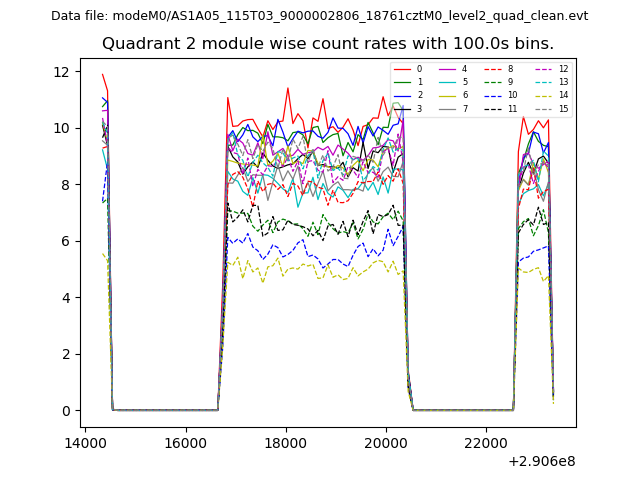
| Module-wise count rates for Quadrant B Data is divided into 100 sec bins |
 |
 |
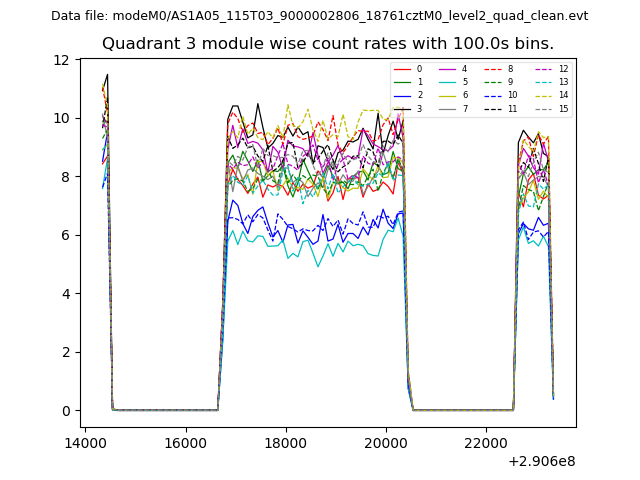
| Module-wise count rates for Quadrant C Data is divided into 100 sec bins |
 |
 |
| Module-wise count rates for Quadrant D Data is divided into 100 sec bins |
 |
 |
| Parameter | Plot |
|---|---|
| CZT HV Monitor | 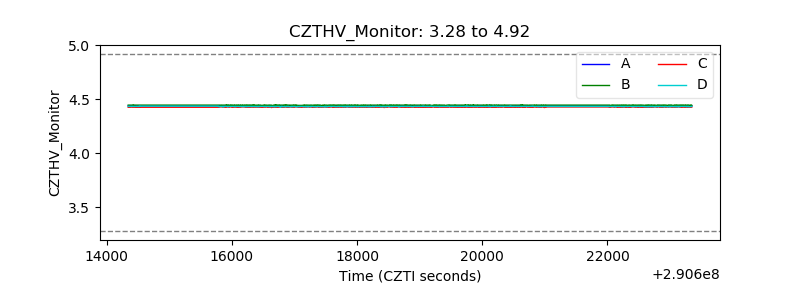 |
| D_VDD | 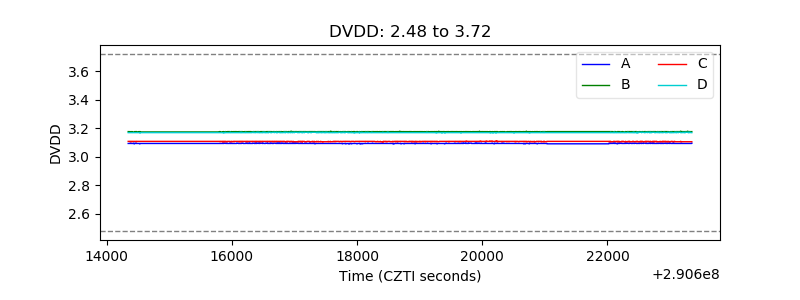 |
| Temperature 1 | 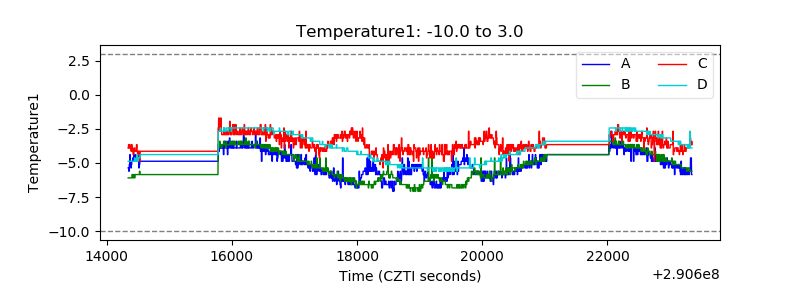 |
| Veto HV Monitor | 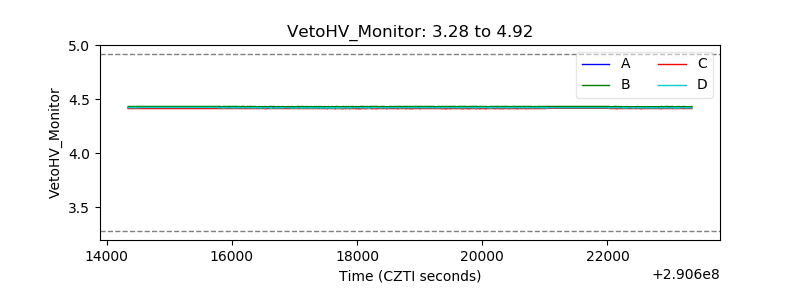 |
| Veto LLD | 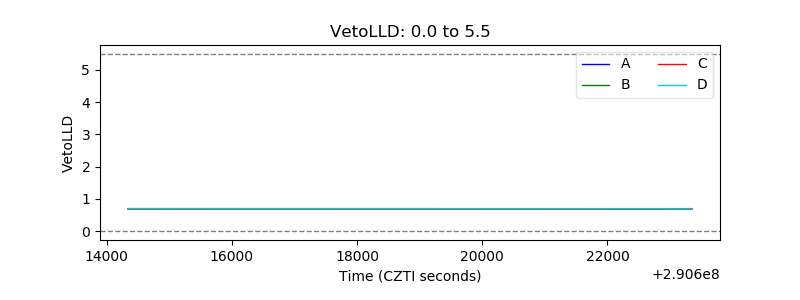 |
| Alpha Counter | 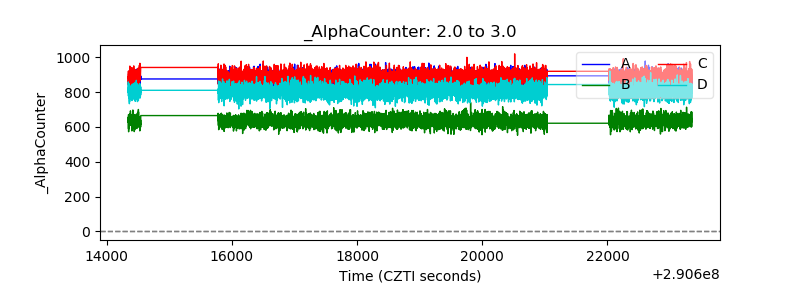 |
| _CPM_Rate | 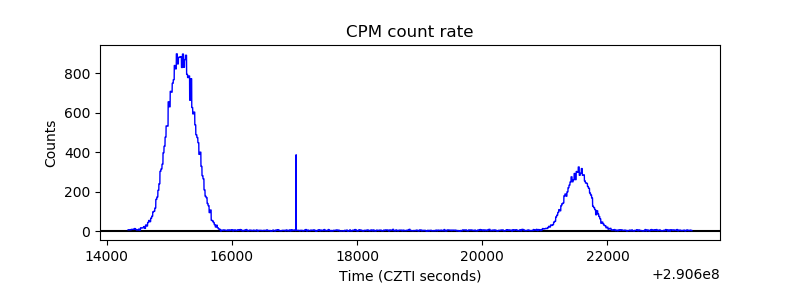 |
| CZT Counter | 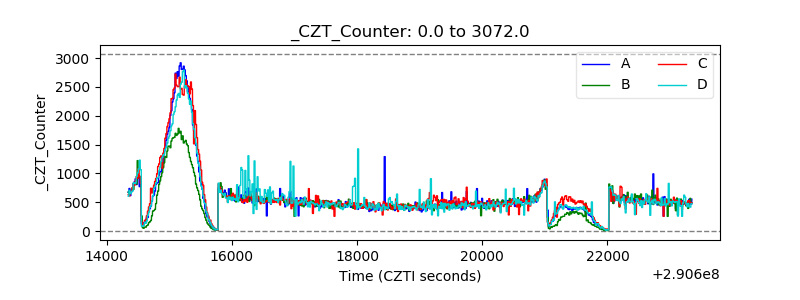 |
| +2.5 Volts monitor |  |
| +5 Volts monitor | 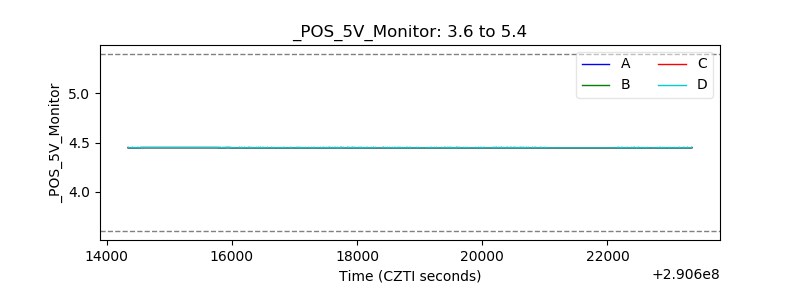 |
| _ROLL_ROT |  |
| _Roll_DEC |  |
| _Roll_RA | 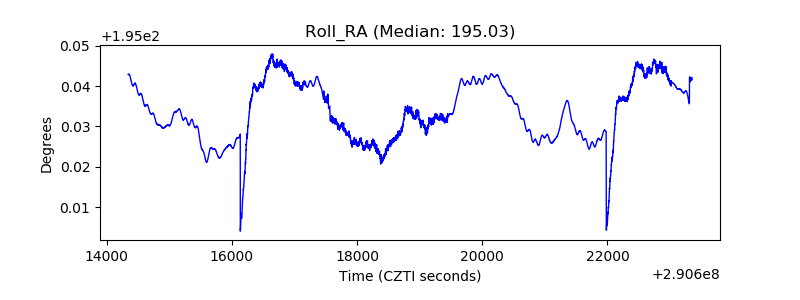 |
| Veto Counter | 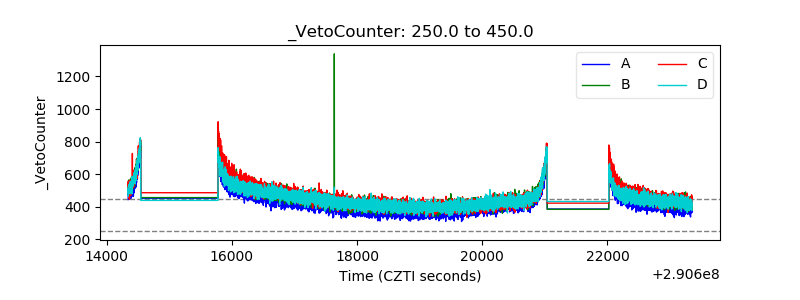 |