| Param | Original file | Final file |
|---|---|---|
| Filename | modeM0/AS1A05_115T03_9000002806_18762cztM0_level2.evt | modeM0/AS1A05_115T03_9000002806_18762cztM0_level2_quad_clean.evt |
| Size (bytes) | 519,272,640 | 100,440,000 |
| Size | 495.2 MB | 95.8 MB |
| Events in quadrant A | 3,778,835 | 631,817 |
| Events in quadrant B | 3,864,656 | 641,161 |
| Events in quadrant C | 3,816,769 | 620,291 |
| Events in quadrant D | 3,740,762 | 610,958 |
| Mode SS | |||
|---|---|---|---|
| Quadrant | BADHDUFLAG | Total packets | Discarded packets |
| A | 0 | 158 | 0 |
| B | 0 | 158 | 0 |
| C | 0 | 158 | 0 |
| D | 0 | 158 | 0 |
| Mode M0 | |||
|---|---|---|---|
| Quadrant | BADHDUFLAG | Total packets | Discarded packets |
| A | 0 | 16154 | 2 |
| B | 0 | 16369 | 2 |
| C | 0 | 16150 | 3 |
| D | 0 | 16201 | 2 |
| Mode M9 | |||
|---|---|---|---|
| Quadrant | BADHDUFLAG | Total packets | Discarded packets |
| A | 0 | 16 | 0 |
| B | 0 | 16 | 0 |
| C | 0 | 16 | 0 |
| D | 0 | 16 | 0 |
| Quadrant | Total seconds | Saturated seconds | Saturation percentage |
|---|---|---|---|
| A | 7731 | 122 | 1.578062% |
| B | 7732 | 171 | 2.211588% |
| C | 7731 | 207 | 2.677532% |
| D | 7731 | 118 | 1.526323% |
Noise dominated data is calculated using 1-second bins in cleaned event files. If a bin has >2000 counts, and if more than 50% of those come from <1% of pixels, then it is considered to be noise-dominated and hence unusable.
| Quadrant | # 1 sec bins | Bins with >0 counts | Bins with >2000 counts | High rate bins dominated by noise | Noise dominated (total time) | Noise dominated (detector-on time) | Marked lightcurve |
|---|---|---|---|---|---|---|---|
| A | 9321 | 7733 | 0 | 0 | 0.00% | 0.00% | 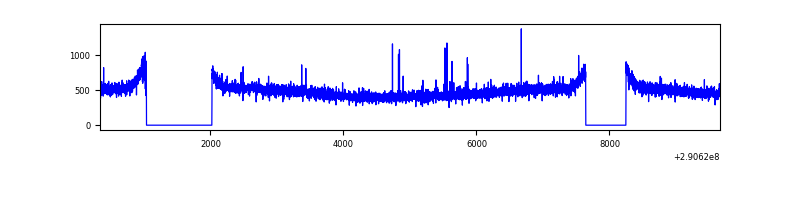 |
| B | 9322 | 7734 | 0 | 0 | 0.00% | 0.00% | 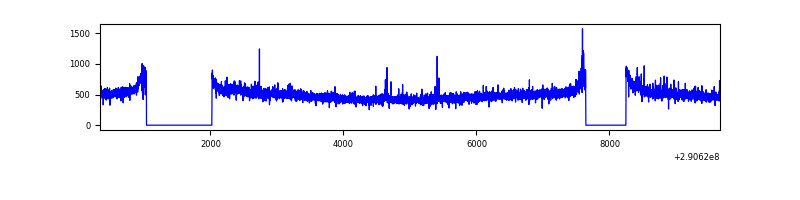 |
| C | 9321 | 7733 | 0 | 0 | 0.00% | 0.00% | 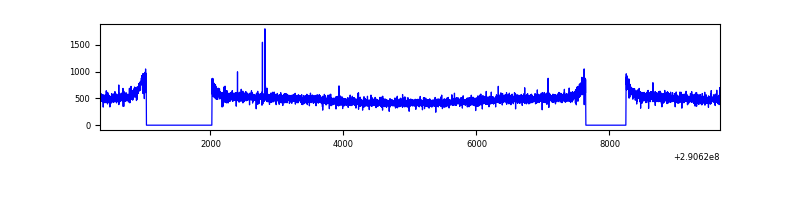 |
| D | 9321 | 7733 | 1 | 1 | 0.01% | 0.01% | 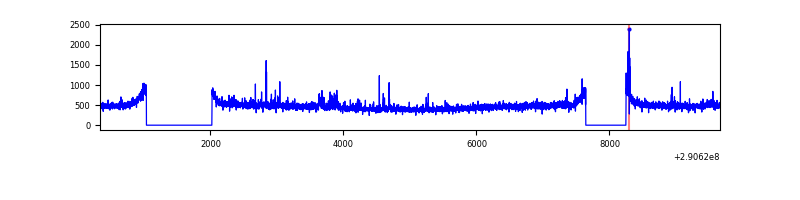 |
Top three noisy pixels from each quadrant. If the there are fewer than three noisy pixels in the level2.evt file, extra rows are filled as -1
| Pixel properties | Quadrant properties | ||||||
|---|---|---|---|---|---|---|---|
| Quadrant | DetID | PixID | Counts | Sigma | Mean | Median | Sigma |
| A | 6 | 16 | 12734 | 59.94 | 974 | 953 | 196.6 |
| A | 13 | 254 | 11384 | 53.07 | 974 | 953 | 196.6 |
| A | 15 | 192 | 10029 | 46.17 | 974 | 953 | 196.6 |
| B | 0 | 229 | 23493 | 120.82 | 970 | 942 | 186.6 |
| B | 12 | 111 | 23114 | 118.79 | 970 | 942 | 186.6 |
| B | 11 | 111 | 20446 | 104.5 | 970 | 942 | 186.6 |
| C | 14 | 238 | 145302 | 656.7 | 938 | 944 | 219.8 |
| C | 3 | 233 | 12630 | 53.16 | 938 | 944 | 219.8 |
| C | 13 | 61 | 6602 | 25.74 | 938 | 944 | 219.8 |
| D | 7 | 223 | 66689 | 284.27 | 955 | 928 | 231.3 |
| D | 2 | 234 | 33641 | 141.41 | 955 | 928 | 231.3 |
| D | 1 | 52 | 24351 | 101.25 | 955 | 928 | 231.3 |
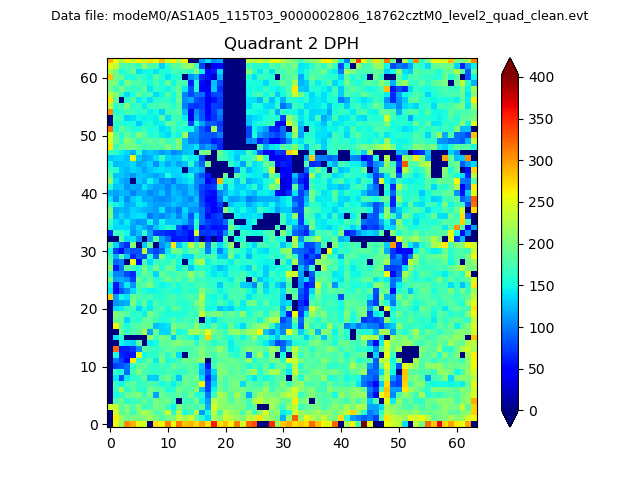
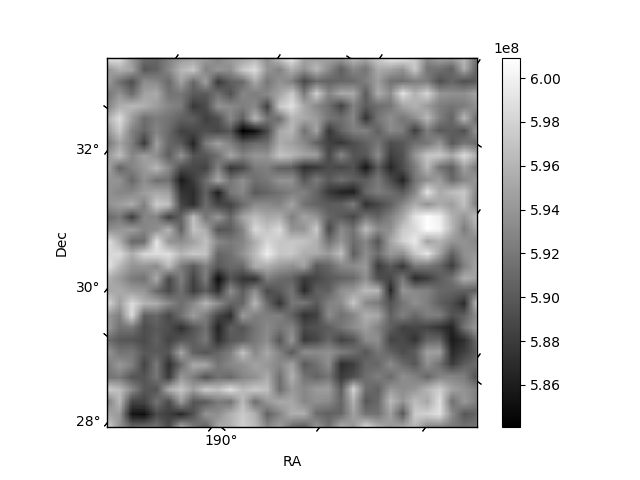
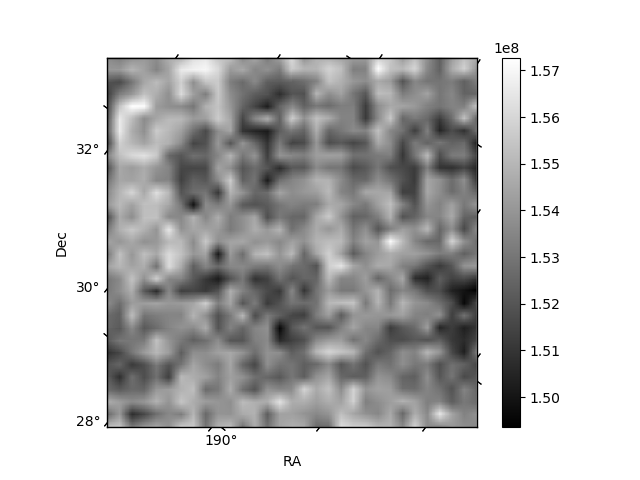
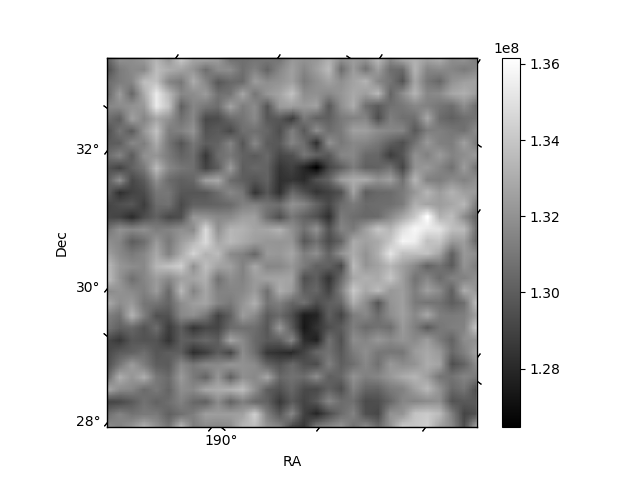
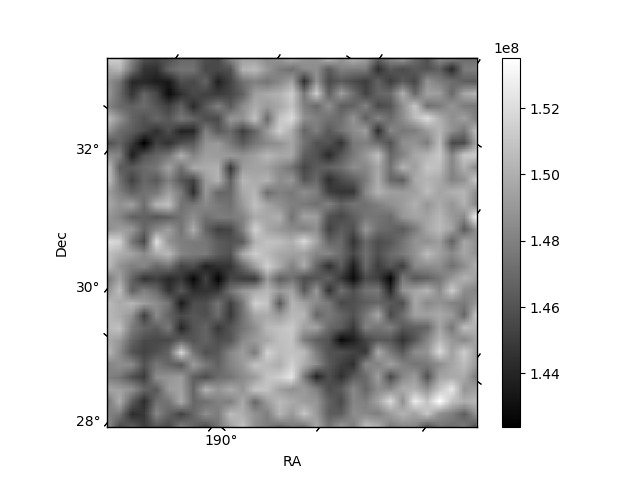
Histogram calculated using DETX and DETY for each event in the final _common_clean file
| Quadrant A | 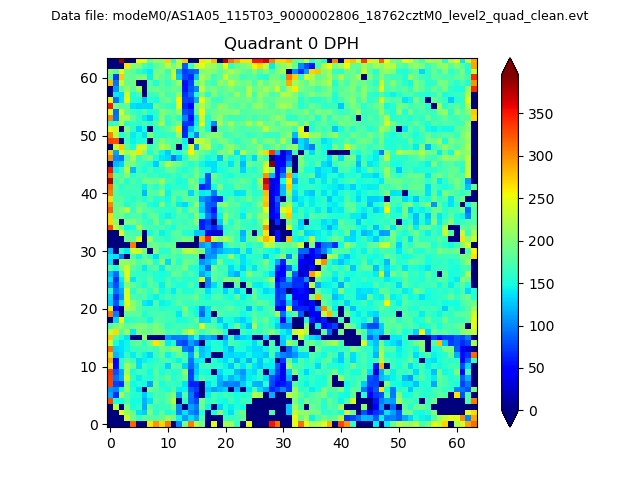 |
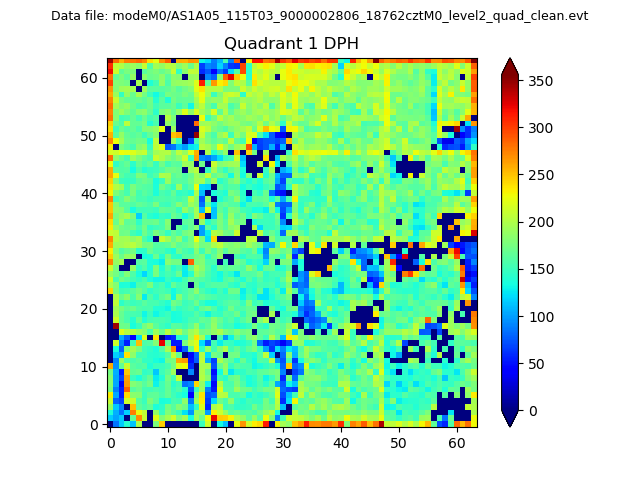 |
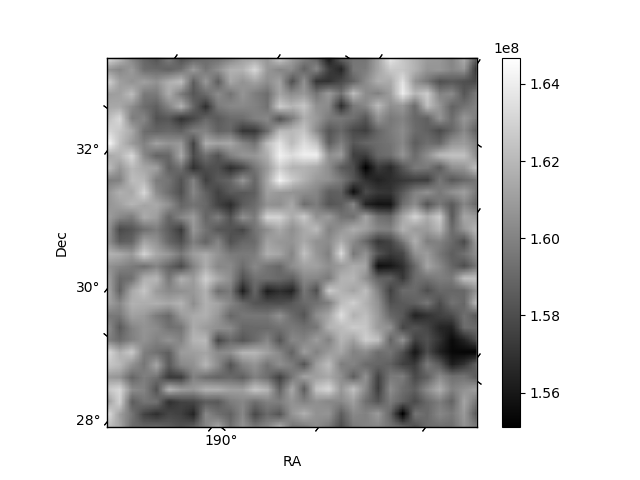
Quadrant B |
|---|---|---|---|
| Quadrant D | 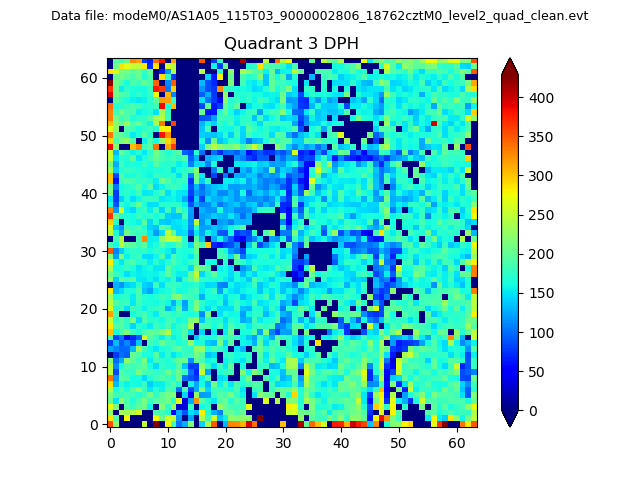 |
 |
Quadrant C |
| Plot type | Count rate plots | Images |
|---|---|---|
| Comparison with Poisson distribution Blue bars denote a histogram of data divided into 1 sec bins. Red curve is a Poisson curve with rate = median count rate of data. |
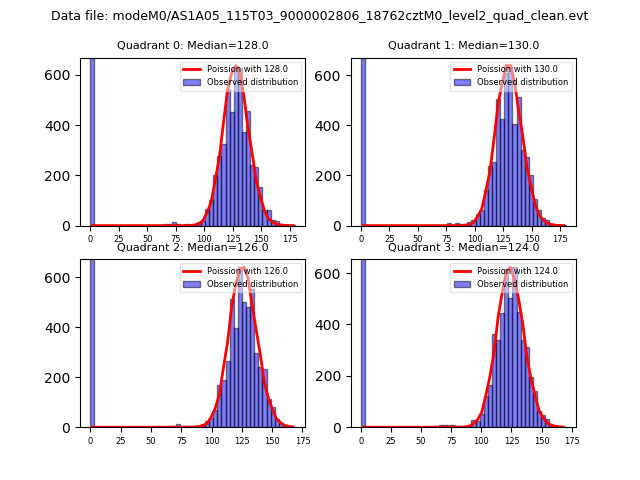 |
 |
| Quadrant-wise count rates Data is divided into 100 sec bins |
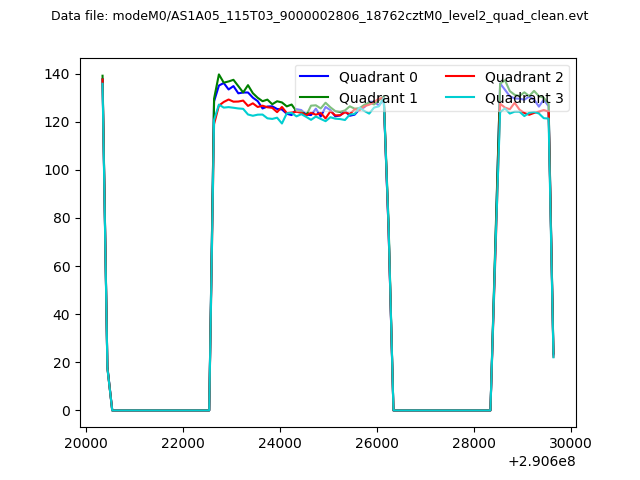 |
|
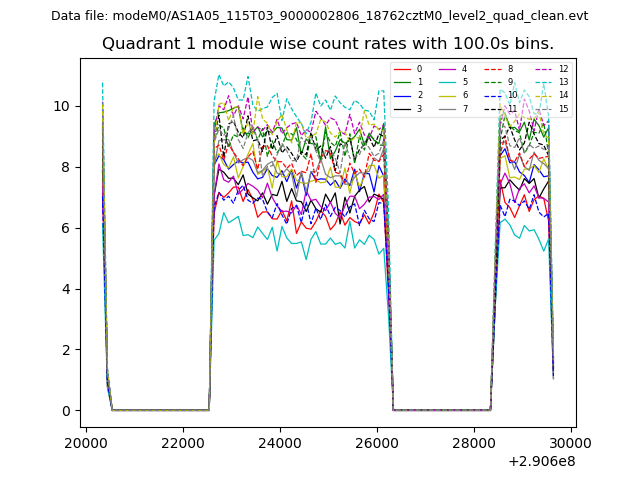
| Module-wise count rates for Quadrant A Data is divided into 100 sec bins |
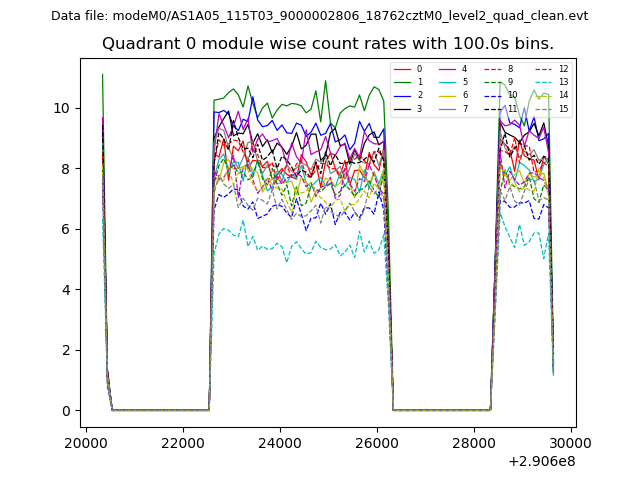 |
 |
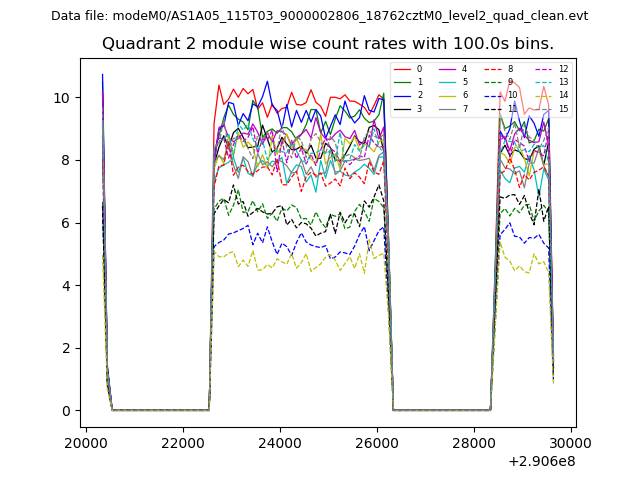
| Module-wise count rates for Quadrant B Data is divided into 100 sec bins |
 |
 |
| Module-wise count rates for Quadrant C Data is divided into 100 sec bins |
 |
 |
| Module-wise count rates for Quadrant D Data is divided into 100 sec bins |
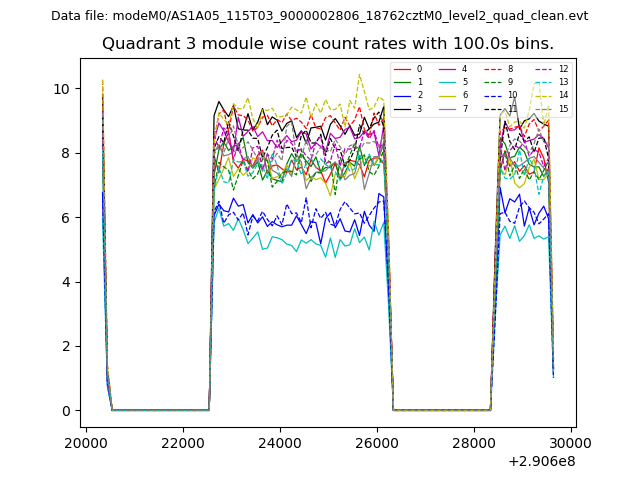 |
 |
| Parameter | Plot |
|---|---|
| CZT HV Monitor | 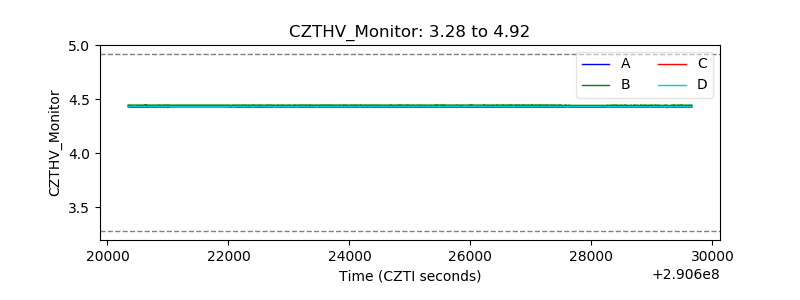 |
| D_VDD | 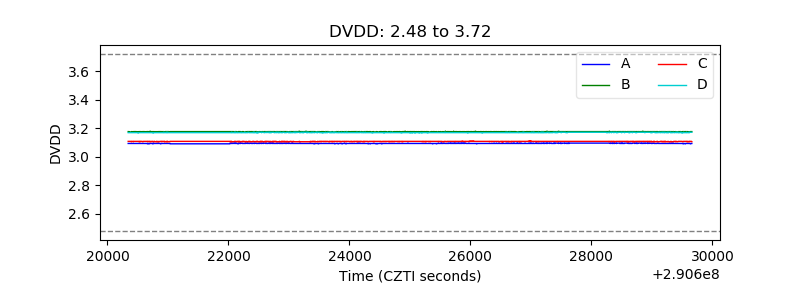 |
| Temperature 1 | 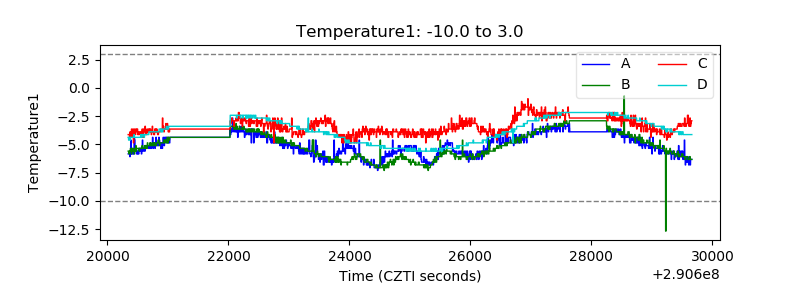 |
| Veto HV Monitor | 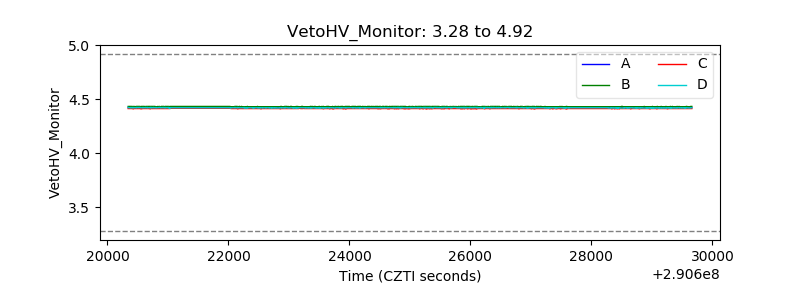 |
| Veto LLD | 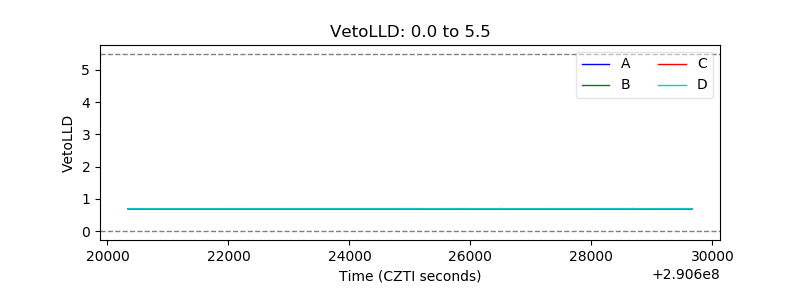 |
| Alpha Counter | 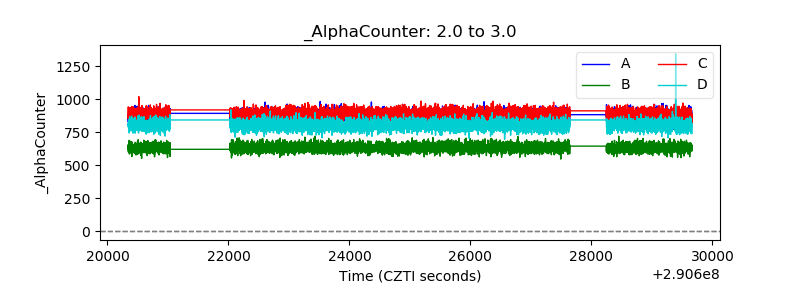 |
| _CPM_Rate | 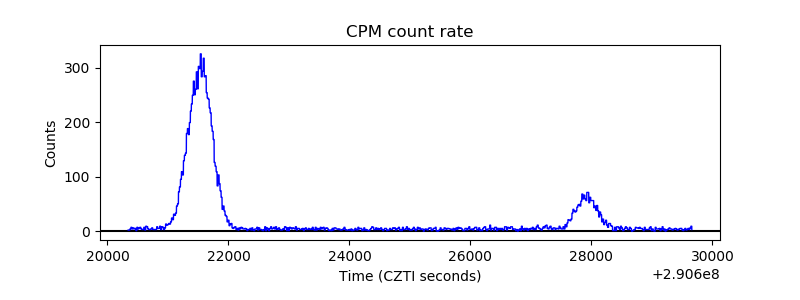 |
| CZT Counter | 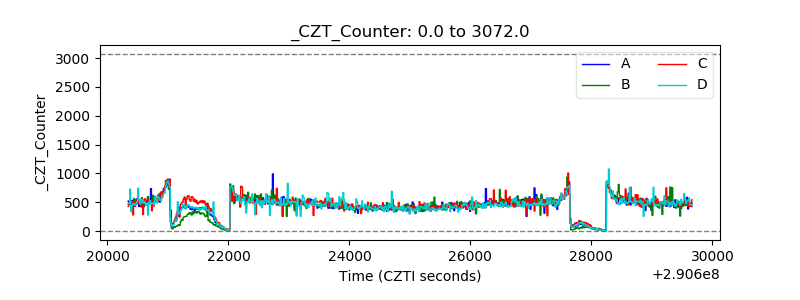 |
| +2.5 Volts monitor | 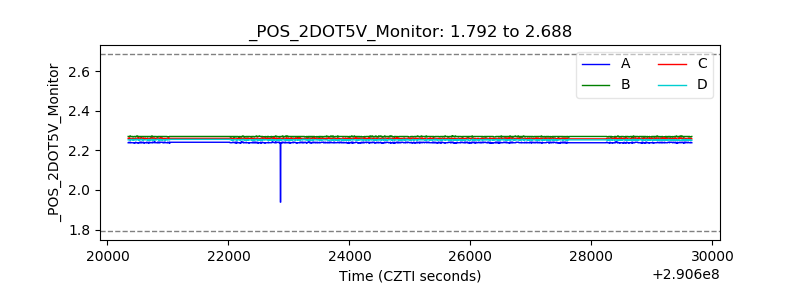 |
| +5 Volts monitor |  |
| _ROLL_ROT | 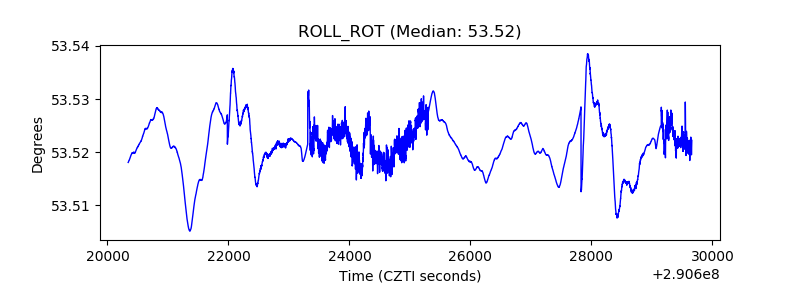 |
| _Roll_DEC | 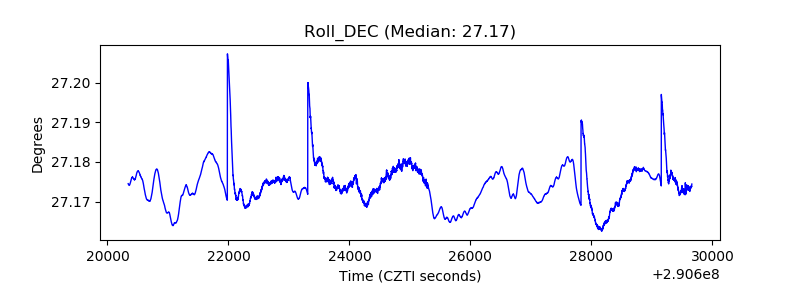 |
| _Roll_RA | 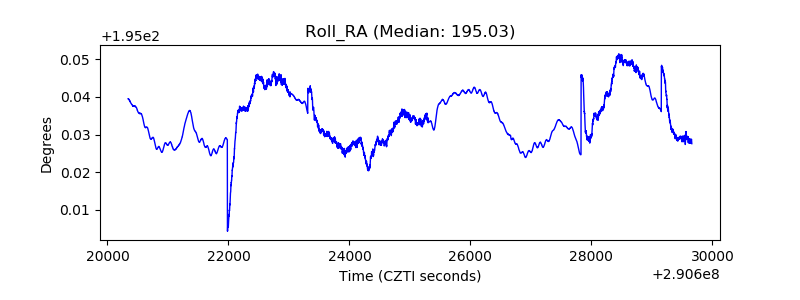 |
| Veto Counter | 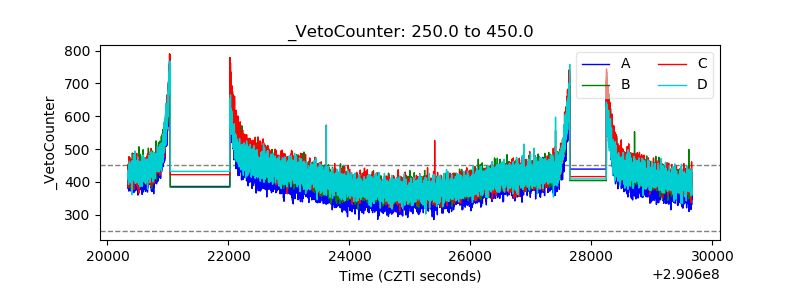 |