| Param | Original file | Final file |
|---|---|---|
| Filename | modeM0/AS1A05_115T03_9000002806_18767cztM0_level2.evt | modeM0/AS1A05_115T03_9000002806_18767cztM0_level2_quad_clean.evt |
| Size (bytes) | 1,310,541,120 | 247,631,040 |
| Size | 1.2 GB | 236.2 MB |
| Events in quadrant A | 9,329,902 | 1,547,943 |
| Events in quadrant B | 9,443,743 | 1,570,107 |
| Events in quadrant C | 10,101,922 | 1,522,709 |
| Events in quadrant D | 9,486,830 | 1,507,625 |
| Mode SS | |||
|---|---|---|---|
| Quadrant | BADHDUFLAG | Total packets | Discarded packets |
| A | 0 | 400 | 0 |
| B | 0 | 400 | 0 |
| C | 0 | 400 | 0 |
| D | 0 | 400 | 0 |
| Mode M0 | |||
|---|---|---|---|
| Quadrant | BADHDUFLAG | Total packets | Discarded packets |
| A | 0 | 40749 | 4 |
| B | 0 | 40967 | 4 |
| C | 0 | 42844 | 4 |
| D | 0 | 41726 | 4 |
| Mode M9 | |||
|---|---|---|---|
| Quadrant | BADHDUFLAG | Total packets | Discarded packets |
| A | 0 | 21 | 0 |
| B | 0 | 21 | 0 |
| C | 0 | 21 | 0 |
| D | 0 | 21 | 0 |
| Quadrant | Total seconds | Saturated seconds | Saturation percentage |
|---|---|---|---|
| A | 19624 | 224 | 1.141459% |
| B | 19625 | 339 | 1.727389% |
| C | 19625 | 418 | 2.129936% |
| D | 19625 | 200 | 1.019108% |
Noise dominated data is calculated using 1-second bins in cleaned event files. If a bin has >2000 counts, and if more than 50% of those come from <1% of pixels, then it is considered to be noise-dominated and hence unusable.
| Quadrant | # 1 sec bins | Bins with >0 counts | Bins with >2000 counts | High rate bins dominated by noise | Noise dominated (total time) | Noise dominated (detector-on time) | Marked lightcurve |
|---|---|---|---|---|---|---|---|
| A | 21734 | 19628 | 3 | 3 | 0.01% | 0.02% | 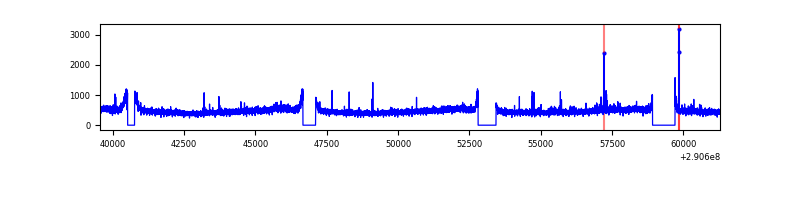 |
| B | 21735 | 19629 | 0 | 0 | 0.00% | 0.00% | 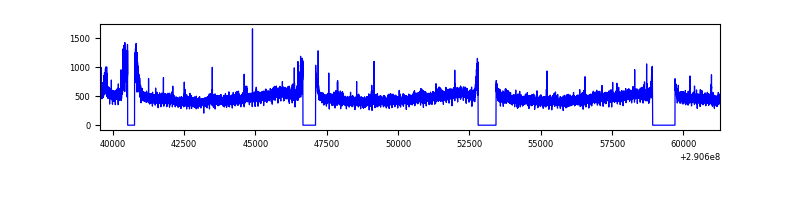 |
| C | 21735 | 19629 | 25 | 25 | 0.12% | 0.13% | 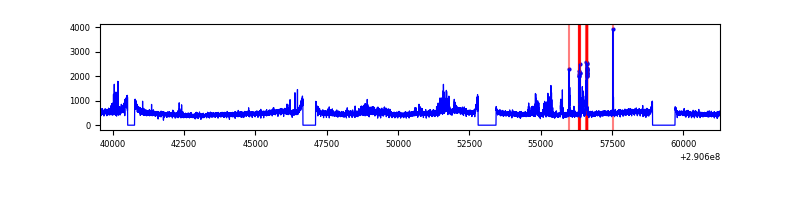 |
| D | 21735 | 19629 | 21 | 21 | 0.10% | 0.11% | 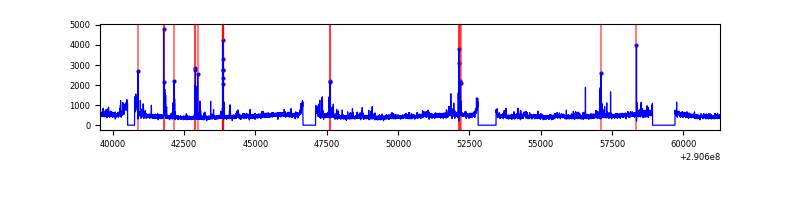 |
Top three noisy pixels from each quadrant. If the there are fewer than three noisy pixels in the level2.evt file, extra rows are filled as -1
| Pixel properties | Quadrant properties | ||||||
|---|---|---|---|---|---|---|---|
| Quadrant | DetID | PixID | Counts | Sigma | Mean | Median | Sigma |
| A | 6 | 16 | 84544 | 170.94 | 2376 | 2318 | 481.0 |
| A | 15 | 192 | 36591 | 71.25 | 2376 | 2318 | 481.0 |
| A | 13 | 254 | 28107 | 53.61 | 2376 | 2318 | 481.0 |
| B | 10 | 245 | 104167 | 222.94 | 2366 | 2305 | 456.9 |
| B | 12 | 111 | 57774 | 121.4 | 2366 | 2305 | 456.9 |
| B | 0 | 229 | 52630 | 110.14 | 2366 | 2305 | 456.9 |
| C | 3 | 233 | 812239 | 1508.3 | 2283 | 2297 | 537.0 |
| C | 14 | 238 | 349659 | 646.87 | 2283 | 2297 | 537.0 |
| C | 6 | 96 | 20751 | 34.37 | 2283 | 2297 | 537.0 |
| D | 7 | 223 | 243294 | 428.74 | 2314 | 2248 | 562.2 |
| D | 12 | 110 | 234923 | 413.85 | 2314 | 2248 | 562.2 |
| D | 7 | 96 | 120320 | 210.01 | 2314 | 2248 | 562.2 |
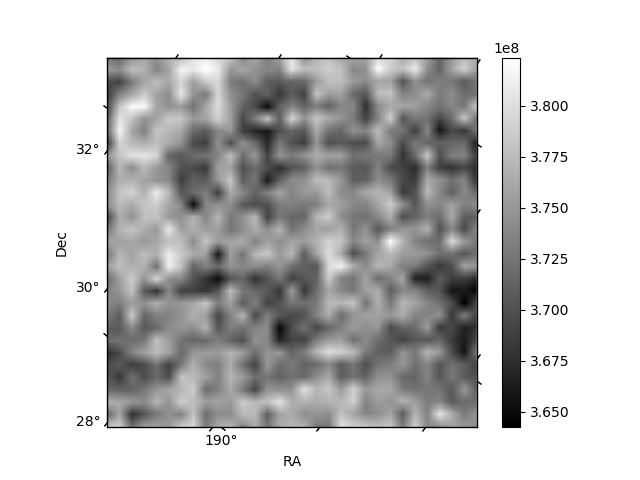
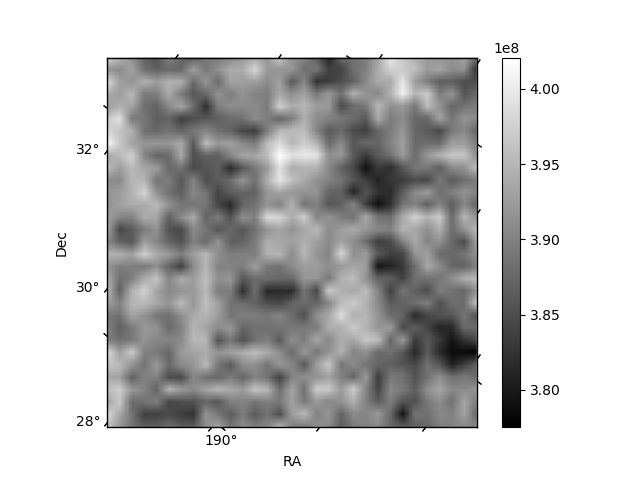
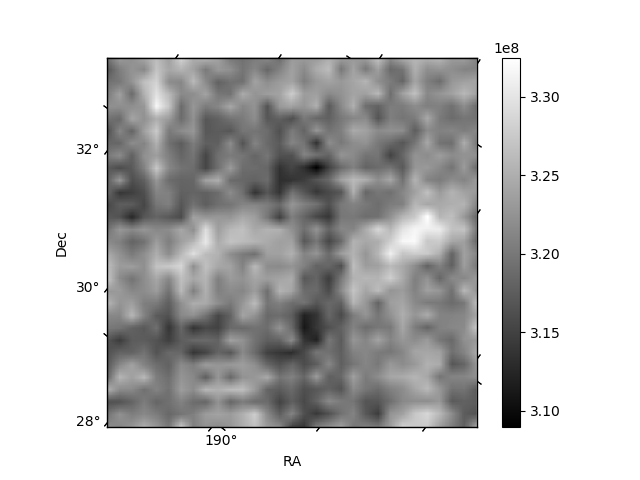
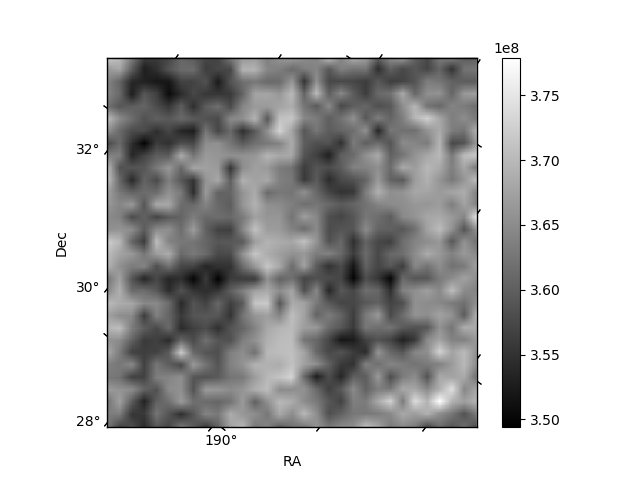
Histogram calculated using DETX and DETY for each event in the final _common_clean file
| Quadrant A | 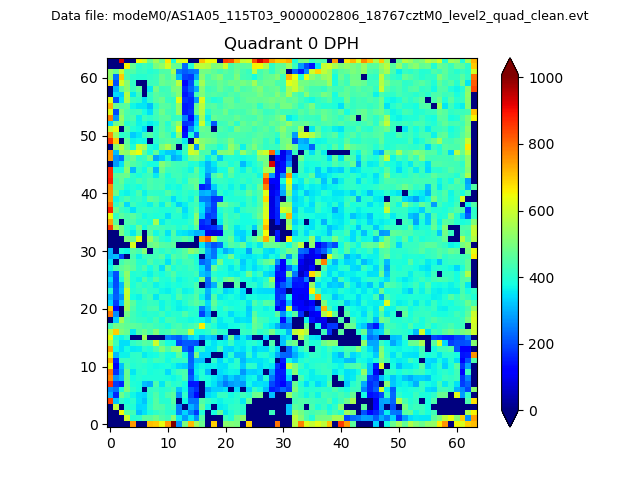 |
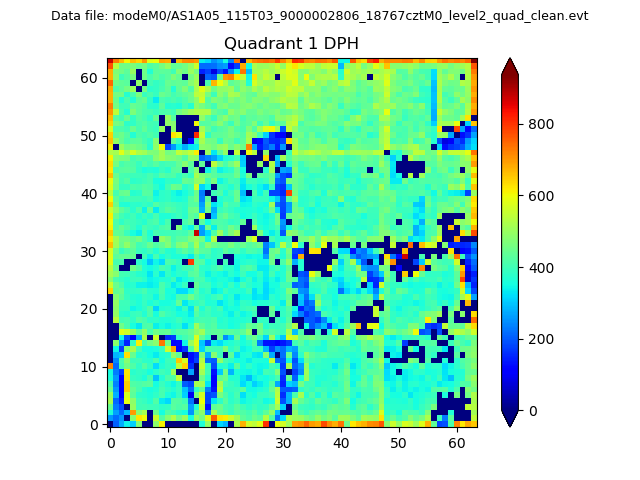 |
Quadrant B |
|---|---|---|---|
| Quadrant D |  |
 |
Quadrant C |
| Plot type | Count rate plots | Images |
|---|---|---|
| Comparison with Poisson distribution Blue bars denote a histogram of data divided into 1 sec bins. Red curve is a Poisson curve with rate = median count rate of data. |
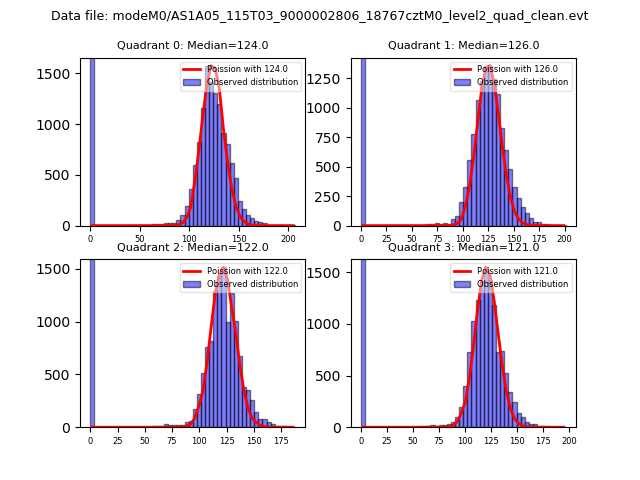 |
 |
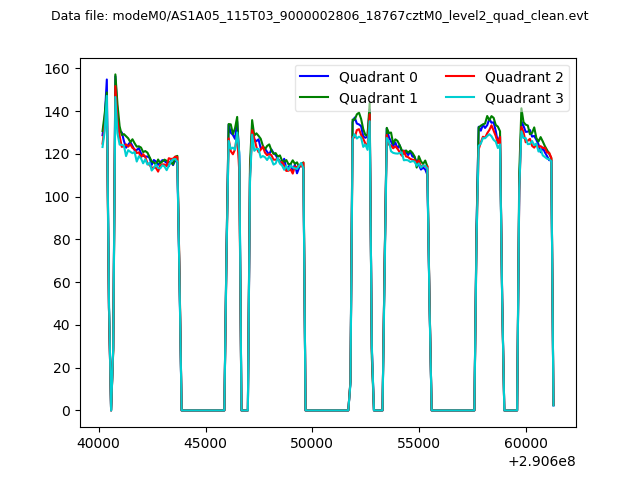
| Quadrant-wise count rates Data is divided into 100 sec bins |
 |
|
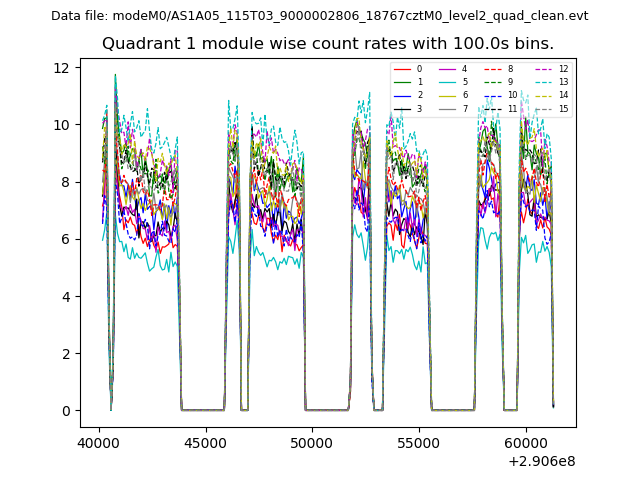
| Module-wise count rates for Quadrant A Data is divided into 100 sec bins |
 |
 |
| Module-wise count rates for Quadrant B Data is divided into 100 sec bins |
 |
 |
| Module-wise count rates for Quadrant C Data is divided into 100 sec bins |
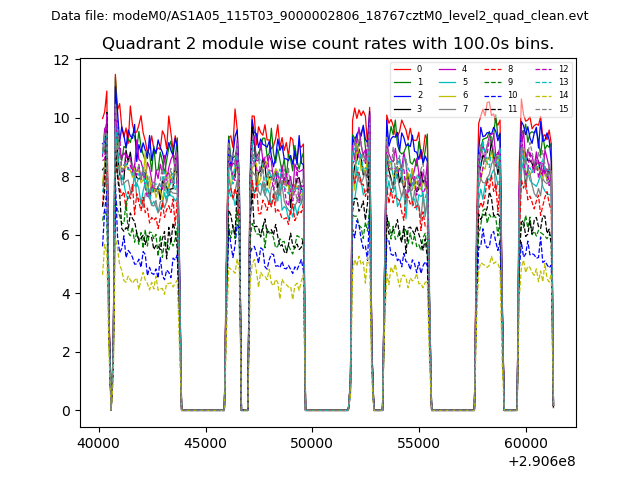 |
 |
| Module-wise count rates for Quadrant D Data is divided into 100 sec bins |
 |
 |
| Parameter | Plot |
|---|---|
| CZT HV Monitor | 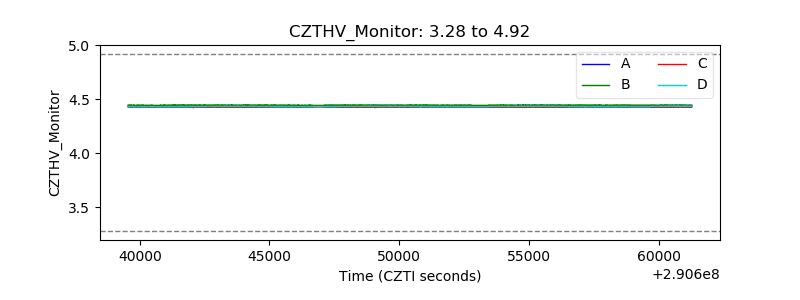 |
| D_VDD | 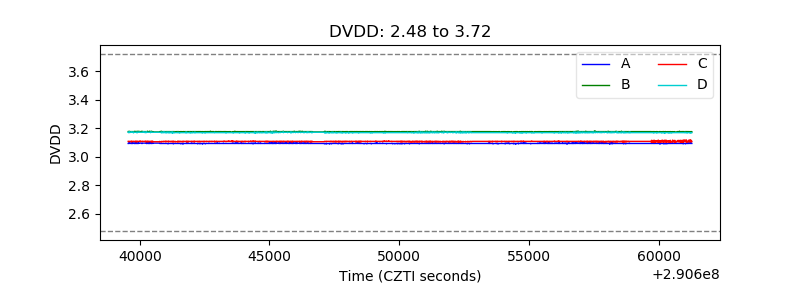 |
| Temperature 1 | 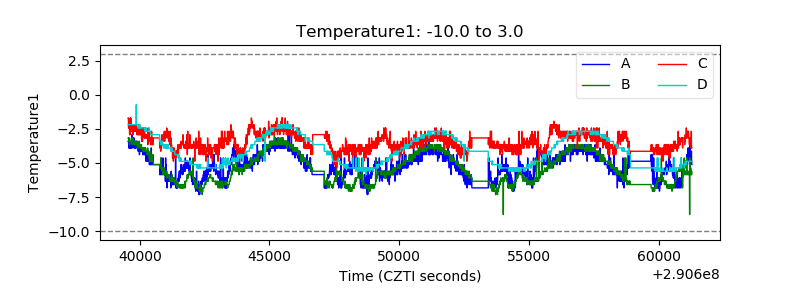 |
| Veto HV Monitor | 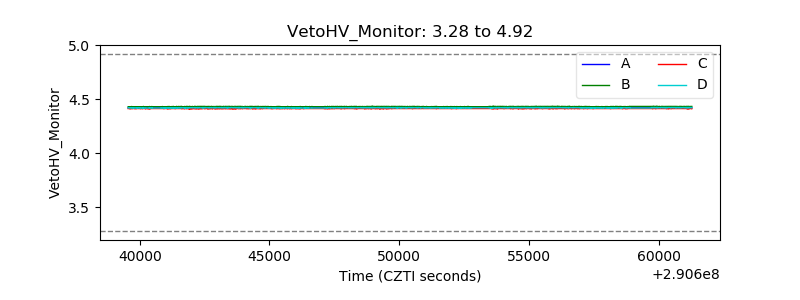 |
| Veto LLD | 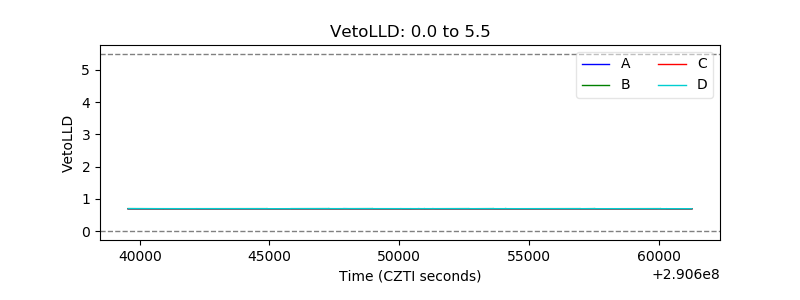 |
| Alpha Counter | 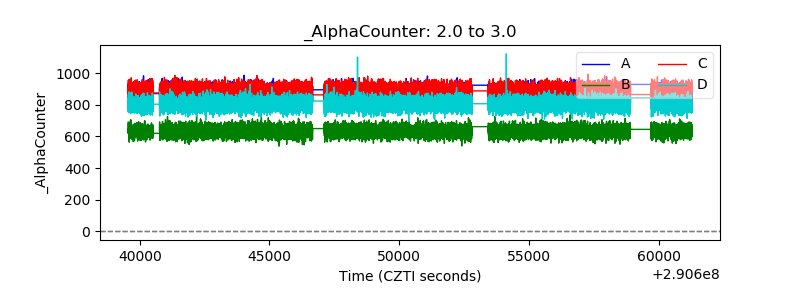 |
| _CPM_Rate | 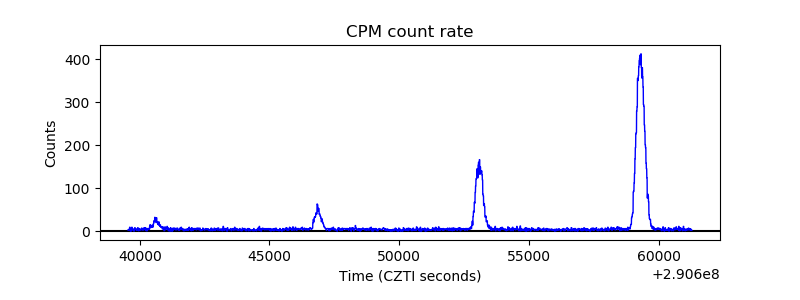 |
| CZT Counter | 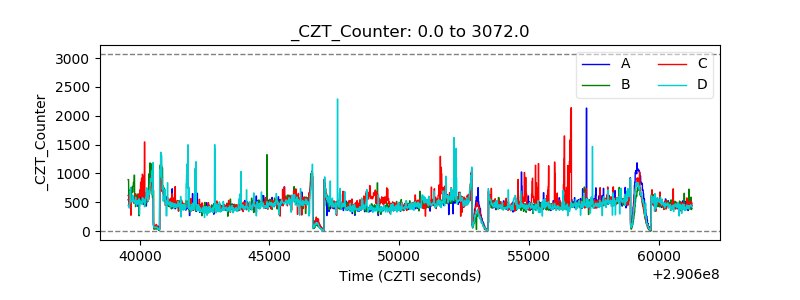 |
| +2.5 Volts monitor | 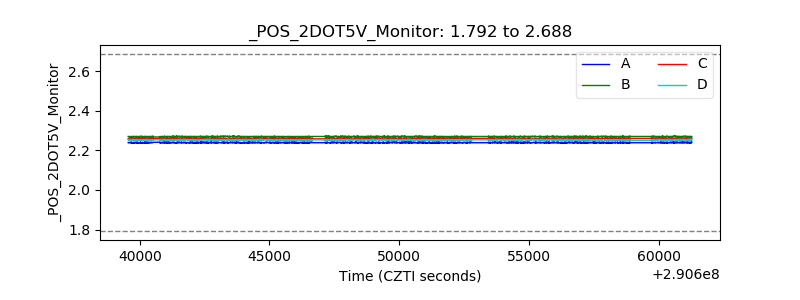 |
| +5 Volts monitor |  |
| _ROLL_ROT |  |
| _Roll_DEC | 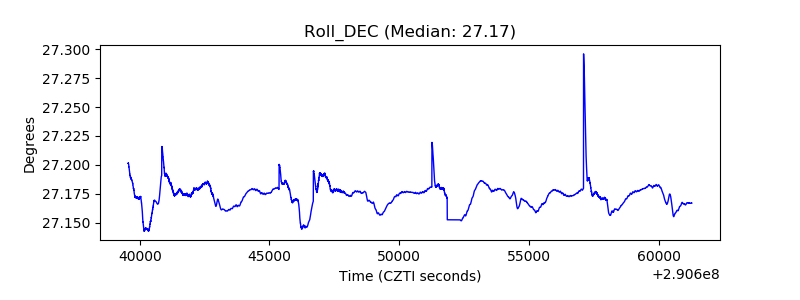 |
| _Roll_RA | 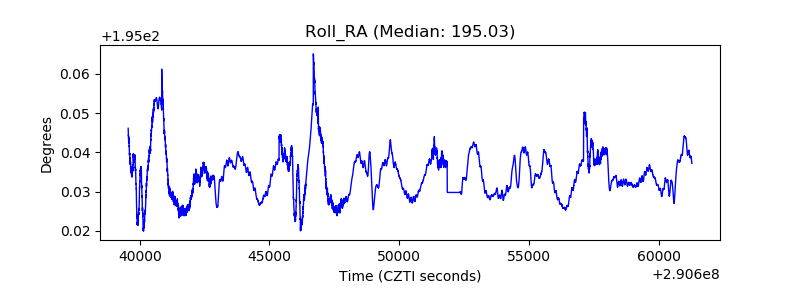 |
| Veto Counter |  |