| Param | Original file | Final file |
|---|---|---|
| Filename | modeM0/AS1A05_115T03_9000002806_18768cztM0_level2.evt | modeM0/AS1A05_115T03_9000002806_18768cztM0_level2_quad_clean.evt |
| Size (bytes) | 445,916,160 | 90,970,560 |
| Size | 425.3 MB | 86.8 MB |
| Events in quadrant A | 3,241,496 | 578,882 |
| Events in quadrant B | 3,205,474 | 587,577 |
| Events in quadrant C | 3,186,335 | 564,515 |
| Events in quadrant D | 3,414,067 | 555,217 |
| Mode SS | |||
|---|---|---|---|
| Quadrant | BADHDUFLAG | Total packets | Discarded packets |
| A | 0 | 134 | 0 |
| B | 0 | 134 | 0 |
| C | 0 | 134 | 0 |
| D | 0 | 134 | 0 |
| Mode M0 | |||
|---|---|---|---|
| Quadrant | BADHDUFLAG | Total packets | Discarded packets |
| A | 0 | 13891 | 2 |
| B | 0 | 13761 | 2 |
| C | 0 | 13694 | 2 |
| D | 0 | 14627 | 4 |
| Mode M9 | |||
|---|---|---|---|
| Quadrant | BADHDUFLAG | Total packets | Discarded packets |
| A | 0 | 11 | 0 |
| B | 0 | 12 | 0 |
| C | 0 | 12 | 0 |
| D | 0 | 12 | 0 |
| Quadrant | Total seconds | Saturated seconds | Saturation percentage |
|---|---|---|---|
| A | 6733 | 56 | 0.831724% |
| B | 6733 | 58 | 0.861429% |
| C | 6733 | 62 | 0.920838% |
| D | 6732 | 56 | 0.831848% |
Noise dominated data is calculated using 1-second bins in cleaned event files. If a bin has >2000 counts, and if more than 50% of those come from <1% of pixels, then it is considered to be noise-dominated and hence unusable.
| Quadrant | # 1 sec bins | Bins with >0 counts | Bins with >2000 counts | High rate bins dominated by noise | Noise dominated (total time) | Noise dominated (detector-on time) | Marked lightcurve |
|---|---|---|---|---|---|---|---|
| A | 7668 | 6734 | 3 | 3 | 0.04% | 0.04% | 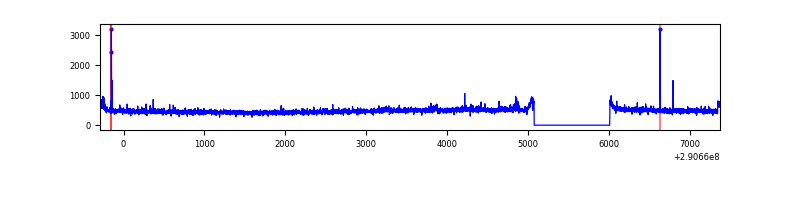 |
| B | 7668 | 6734 | 0 | 0 | 0.00% | 0.00% | 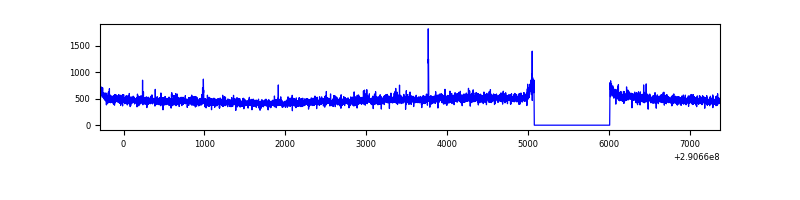 |
| C | 7668 | 6734 | 0 | 0 | 0.00% | 0.00% | 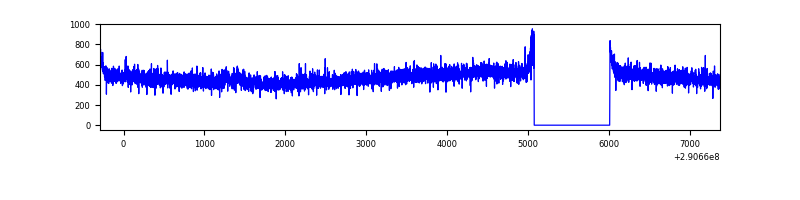 |
| D | 7667 | 6733 | 24 | 24 | 0.31% | 0.36% | 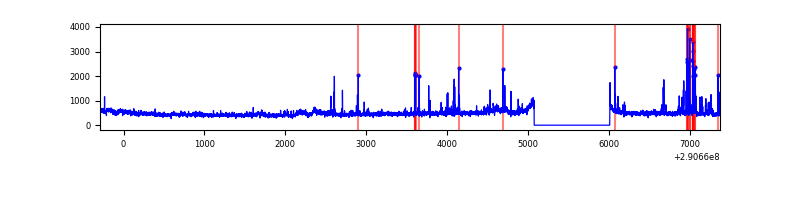 |
Top three noisy pixels from each quadrant. If the there are fewer than three noisy pixels in the level2.evt file, extra rows are filled as -1
| Pixel properties | Quadrant properties | ||||||
|---|---|---|---|---|---|---|---|
| Quadrant | DetID | PixID | Counts | Sigma | Mean | Median | Sigma |
| A | 6 | 16 | 63734 | 380.52 | 816 | 799 | 165.4 |
| A | 15 | 192 | 12866 | 72.96 | 816 | 799 | 165.4 |
| A | 11 | 29 | 12456 | 70.48 | 816 | 799 | 165.4 |
| B | 0 | 229 | 24468 | 151.54 | 810 | 789 | 156.3 |
| B | 12 | 111 | 19521 | 119.88 | 810 | 789 | 156.3 |
| B | 11 | 111 | 17091 | 104.33 | 810 | 789 | 156.3 |
| C | 14 | 238 | 119940 | 654.83 | 775 | 780 | 182.0 |
| C | 3 | 233 | 20047 | 105.88 | 775 | 780 | 182.0 |
| C | 8 | 128 | 14102 | 73.21 | 775 | 780 | 182.0 |
| D | 1 | 52 | 196289 | 1014.63 | 789 | 763 | 192.7 |
| D | 7 | 223 | 189417 | 978.97 | 789 | 763 | 192.7 |
| D | 7 | 96 | 26696 | 134.57 | 789 | 763 | 192.7 |
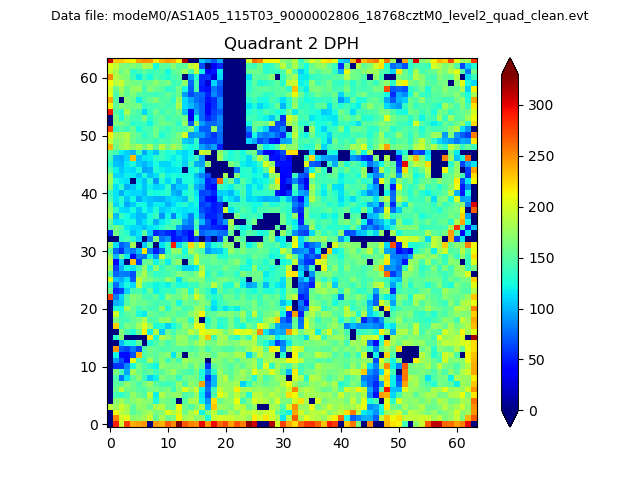
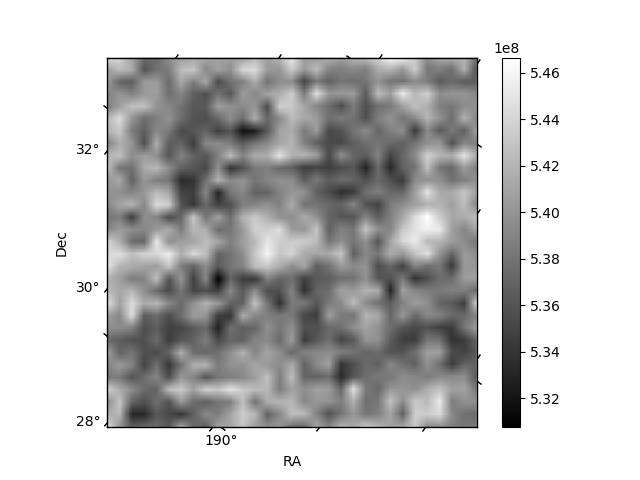
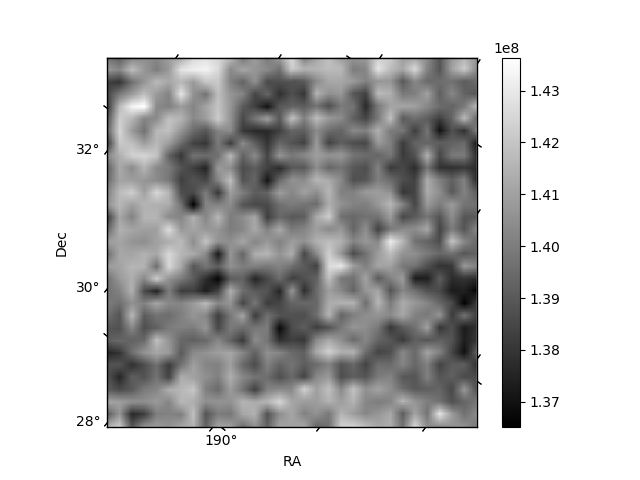
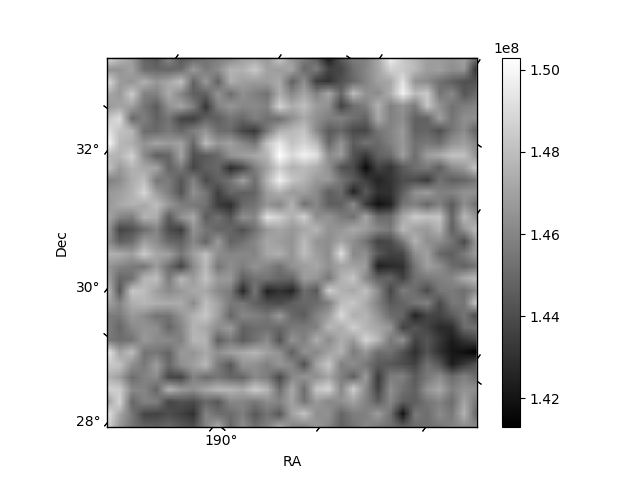
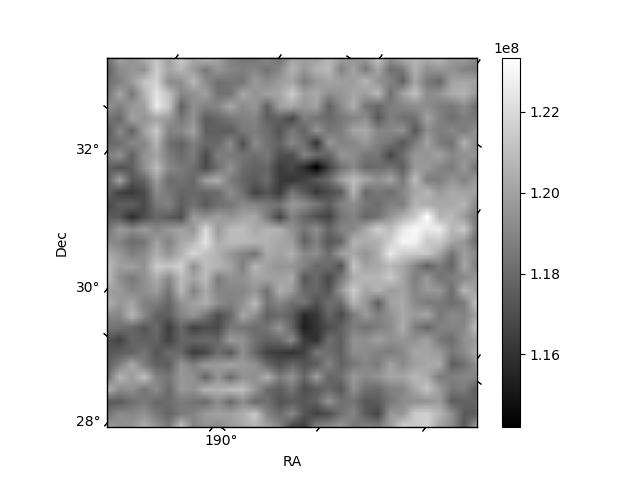
Histogram calculated using DETX and DETY for each event in the final _common_clean file
| Quadrant A | 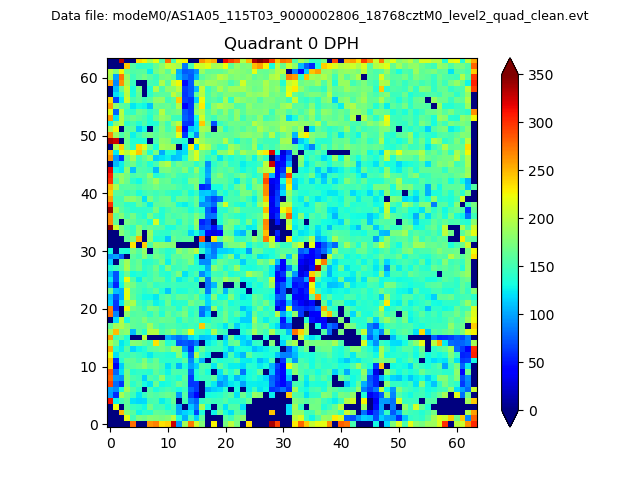 |
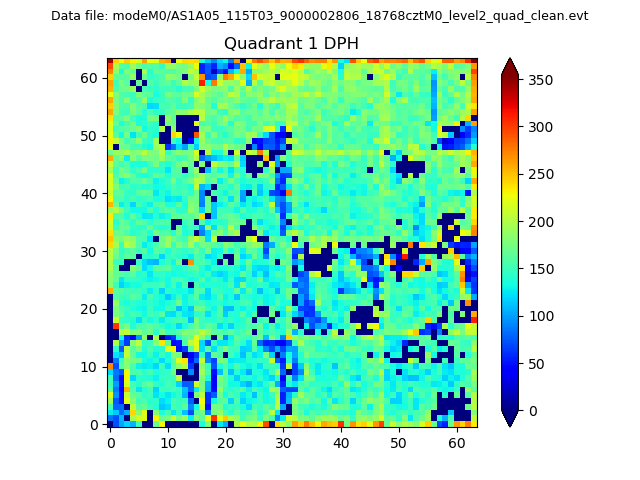 |
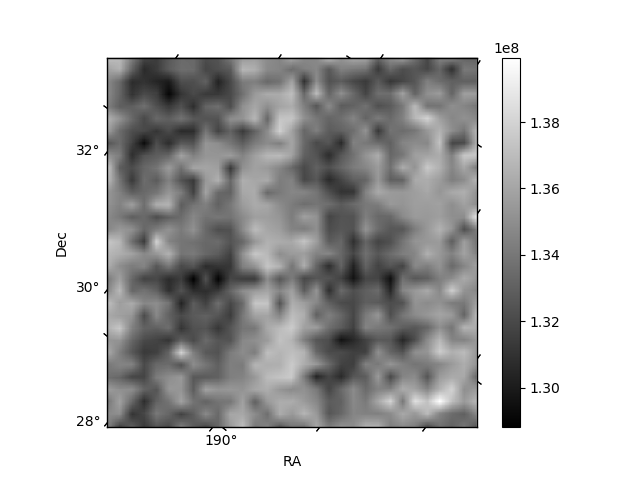
Quadrant B |
|---|---|---|---|
| Quadrant D | 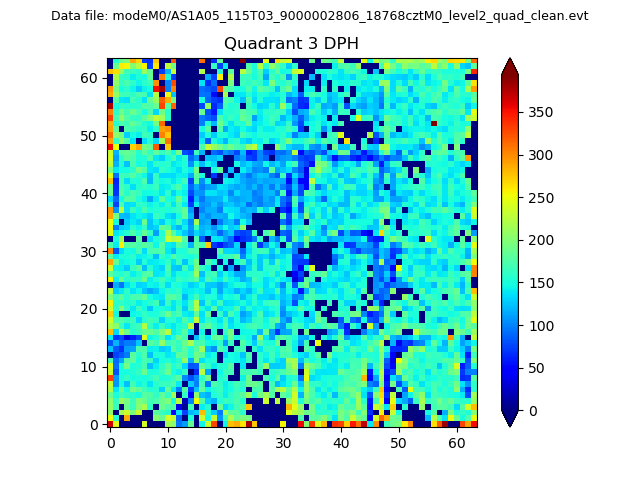 |
 |
Quadrant C |
| Plot type | Count rate plots | Images |
|---|---|---|
| Comparison with Poisson distribution Blue bars denote a histogram of data divided into 1 sec bins. Red curve is a Poisson curve with rate = median count rate of data. |
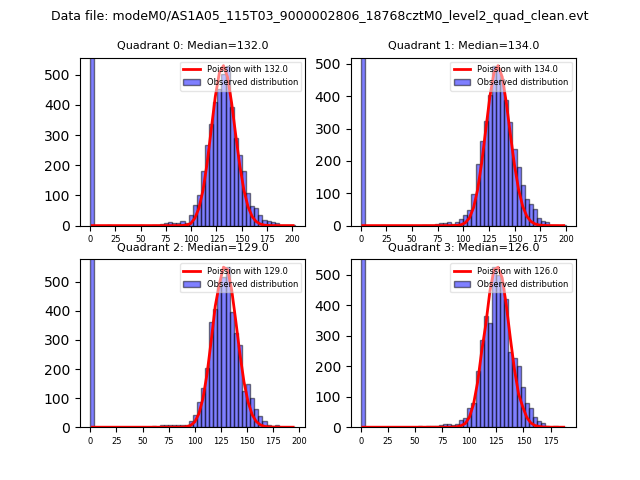 |
 |
| Quadrant-wise count rates Data is divided into 100 sec bins |
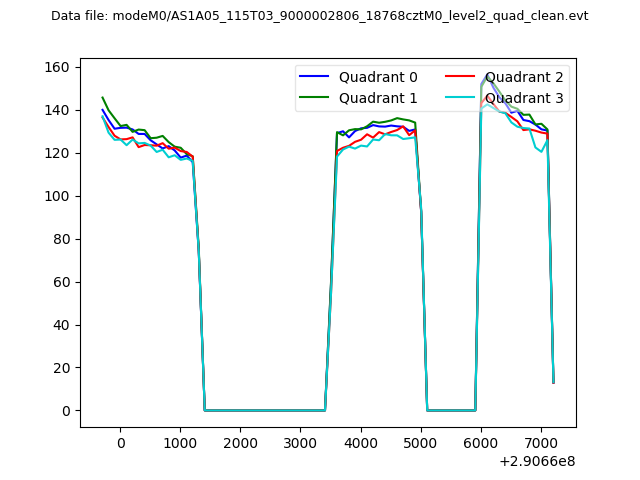 |
|
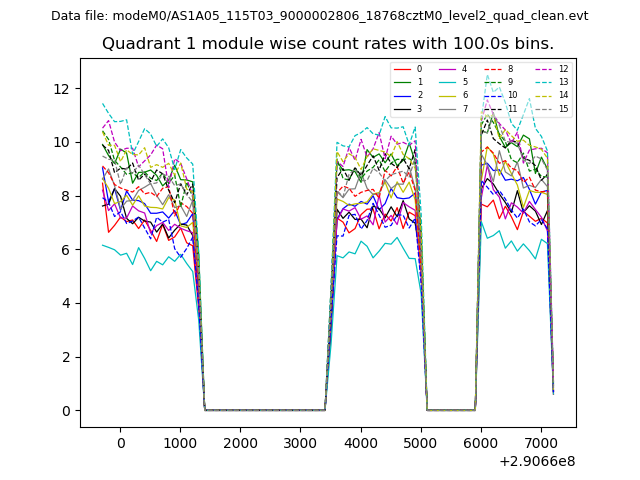
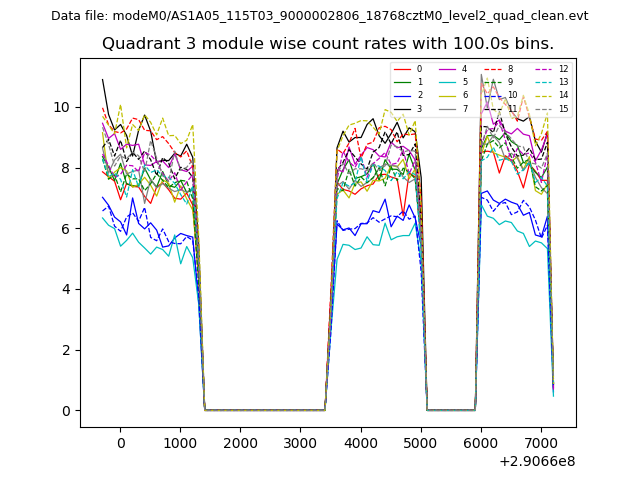
| Module-wise count rates for Quadrant A Data is divided into 100 sec bins |
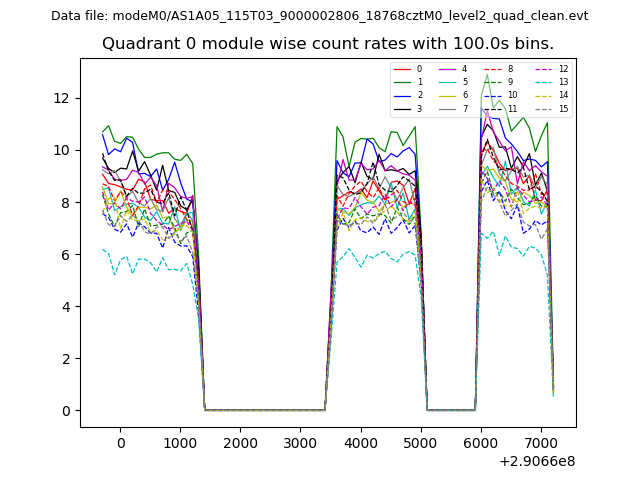 |
 |
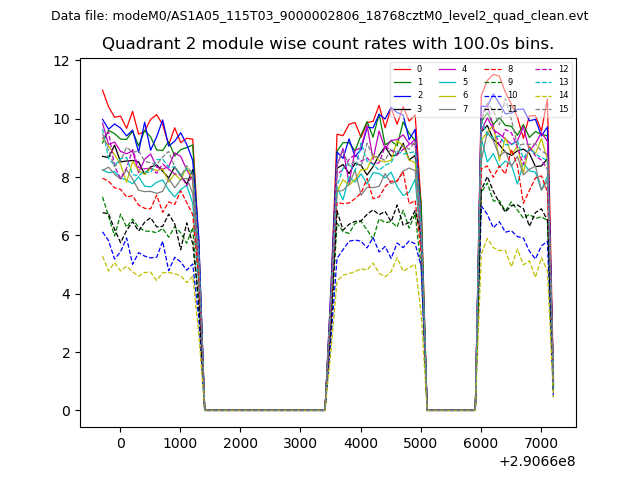
| Module-wise count rates for Quadrant B Data is divided into 100 sec bins |
 |
 |
| Module-wise count rates for Quadrant C Data is divided into 100 sec bins |
 |
 |
| Module-wise count rates for Quadrant D Data is divided into 100 sec bins |
 |
 |
| Parameter | Plot |
|---|---|
| CZT HV Monitor | 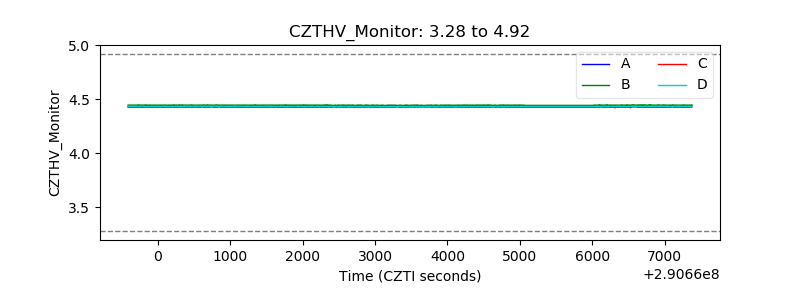 |
| D_VDD | 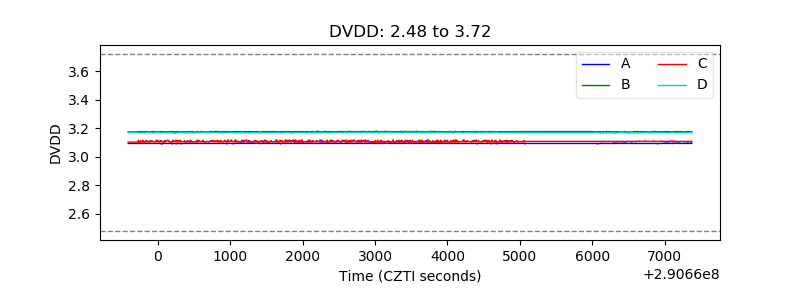 |
| Temperature 1 |  |
| Veto HV Monitor | 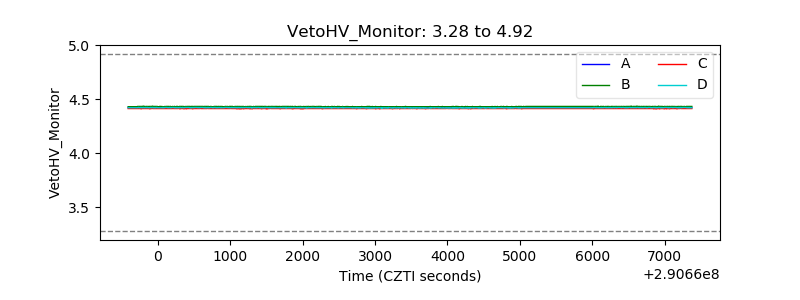 |
| Veto LLD | 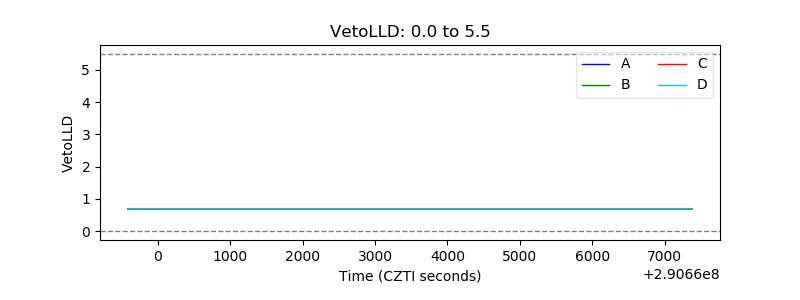 |
| Alpha Counter | 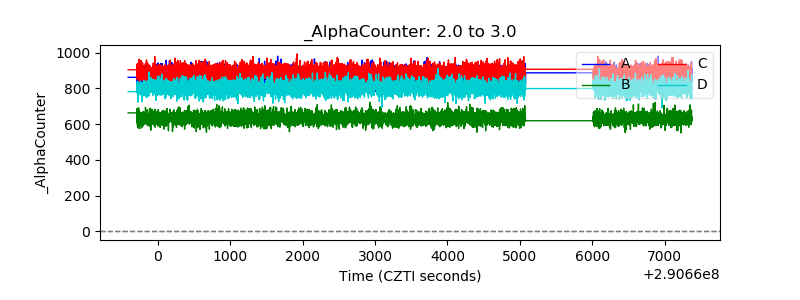 |
| _CPM_Rate | 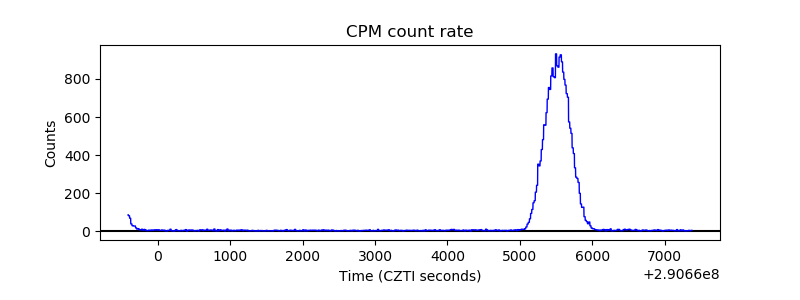 |
| CZT Counter | 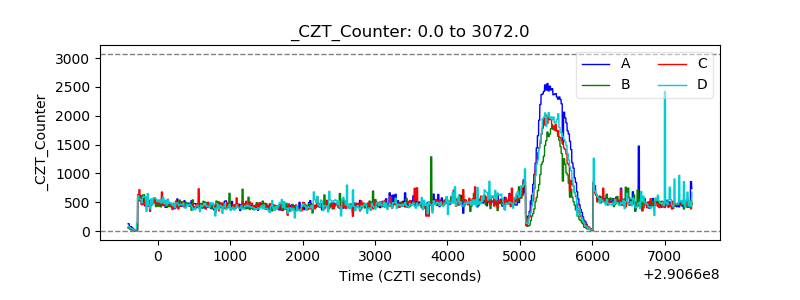 |
| +2.5 Volts monitor |  |
| +5 Volts monitor |  |
| _ROLL_ROT | 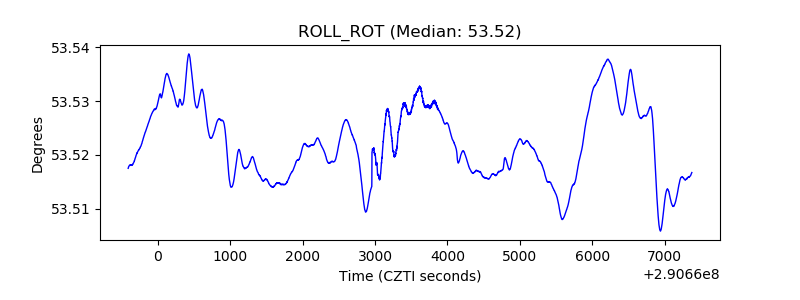 |
| _Roll_DEC |  |
| _Roll_RA | 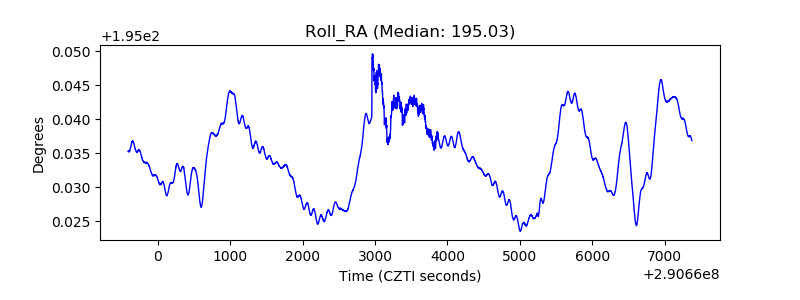 |
| Veto Counter | 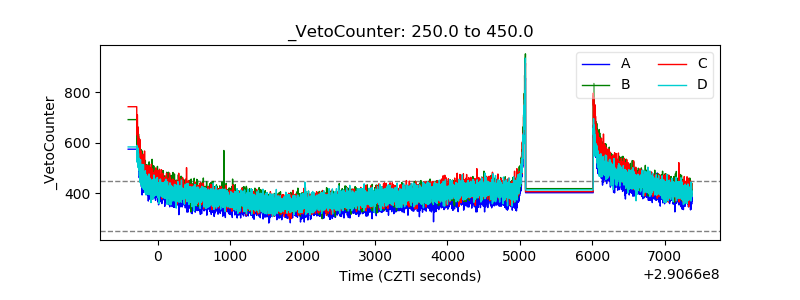 |