| Param | Original file | Final file |
|---|---|---|
| Filename | modeM0/AS1A05_115T03_9000002806_18771cztM0_level2.evt | modeM0/AS1A05_115T03_9000002806_18771cztM0_level2_quad_clean.evt |
| Size (bytes) | 318,669,120 | 53,012,160 |
| Size | 303.9 MB | 50.6 MB |
| Events in quadrant A | 2,685,121 | 328,110 |
| Events in quadrant B | 2,227,153 | 334,332 |
| Events in quadrant C | 2,200,899 | 315,376 |
| Events in quadrant D | 2,234,194 | 314,053 |
| Mode SS | |||
|---|---|---|---|
| Quadrant | BADHDUFLAG | Total packets | Discarded packets |
| A | 0 | 88 | 0 |
| B | 0 | 88 | 0 |
| C | 0 | 88 | 0 |
| D | 0 | 88 | 0 |
| Mode M0 | |||
|---|---|---|---|
| Quadrant | BADHDUFLAG | Total packets | Discarded packets |
| A | 0 | 10674 | 1 |
| B | 0 | 9215 | 1 |
| C | 0 | 9173 | 1 |
| D | 0 | 9442 | 1 |
| Mode M9 | |||
|---|---|---|---|
| Quadrant | BADHDUFLAG | Total packets | Discarded packets |
| A | 0 | 5 | 0 |
| B | 0 | 6 | 0 |
| C | 0 | 6 | 0 |
| D | 0 | 6 | 0 |
| Quadrant | Total seconds | Saturated seconds | Saturation percentage |
|---|---|---|---|
| A | 4455 | 69 | 1.548822% |
| B | 4455 | 10 | 0.224467% |
| C | 4455 | 14 | 0.314254% |
| D | 4455 | 4 | 0.089787% |
Noise dominated data is calculated using 1-second bins in cleaned event files. If a bin has >2000 counts, and if more than 50% of those come from <1% of pixels, then it is considered to be noise-dominated and hence unusable.
| Quadrant | # 1 sec bins | Bins with >0 counts | Bins with >2000 counts | High rate bins dominated by noise | Noise dominated (total time) | Noise dominated (detector-on time) | Marked lightcurve |
|---|---|---|---|---|---|---|---|
| A | 4455 | 4455 | 49 | 49 | 1.10% | 1.10% | 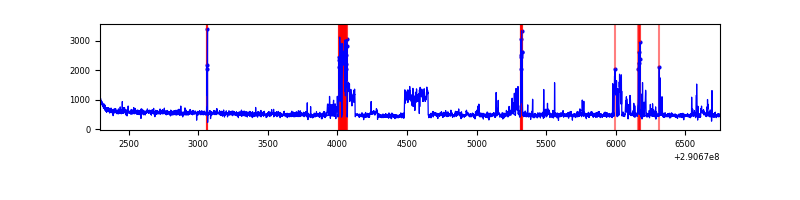 |
| B | 4455 | 4455 | 0 | 0 | 0.00% | 0.00% | 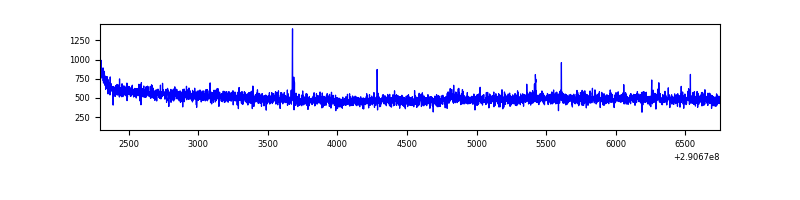 |
| C | 4455 | 4455 | 0 | 0 | 0.00% | 0.00% | 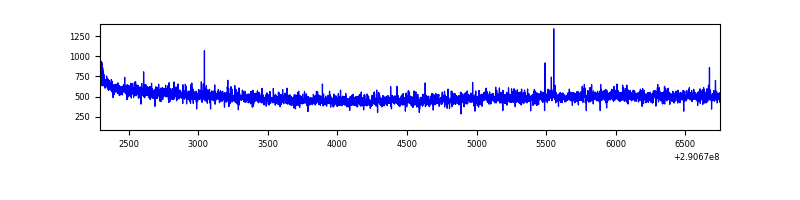 |
| D | 4455 | 4455 | 3 | 3 | 0.07% | 0.07% | 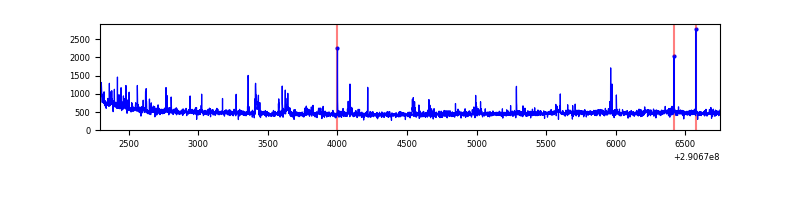 |
Top three noisy pixels from each quadrant. If the there are fewer than three noisy pixels in the level2.evt file, extra rows are filled as -1
| Pixel properties | Quadrant properties | ||||||
|---|---|---|---|---|---|---|---|
| Quadrant | DetID | PixID | Counts | Sigma | Mean | Median | Sigma |
| A | 6 | 16 | 467591 | 4125.79 | 566 | 557 | 113.2 |
| A | 15 | 192 | 25281 | 218.41 | 566 | 557 | 113.2 |
| A | 9 | 143 | 7638 | 62.55 | 566 | 557 | 113.2 |
| B | 12 | 111 | 12905 | 114.75 | 562 | 549 | 107.7 |
| B | 11 | 111 | 11270 | 99.57 | 562 | 549 | 107.7 |
| B | 0 | 229 | 10696 | 94.24 | 562 | 549 | 107.7 |
| C | 14 | 238 | 85243 | 676.52 | 537 | 539 | 125.2 |
| C | 3 | 233 | 18081 | 140.11 | 537 | 539 | 125.2 |
| C | 13 | 61 | 3789 | 25.96 | 537 | 539 | 125.2 |
| D | 7 | 238 | 71919 | 533.84 | 550 | 537 | 133.7 |
| D | 1 | 52 | 36435 | 268.47 | 550 | 537 | 133.7 |
| D | 7 | 96 | 19507 | 141.87 | 550 | 537 | 133.7 |
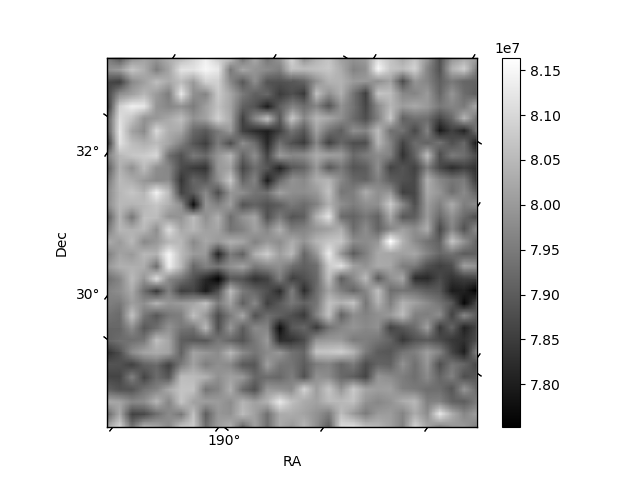
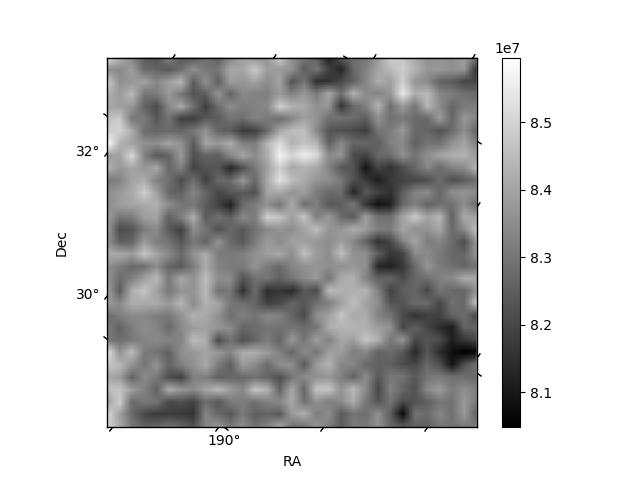
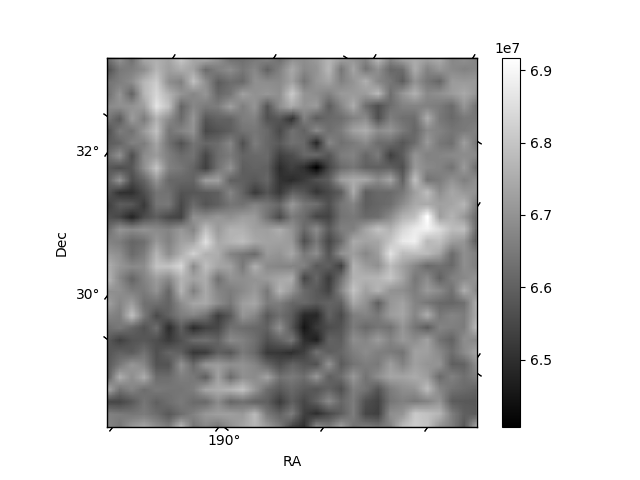
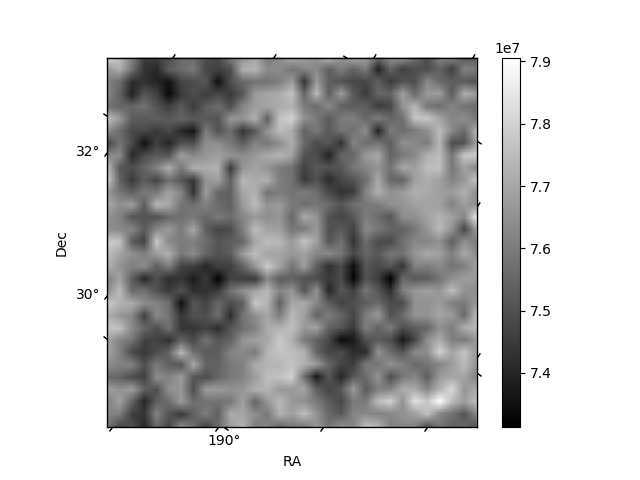
Histogram calculated using DETX and DETY for each event in the final _common_clean file
| Quadrant A | 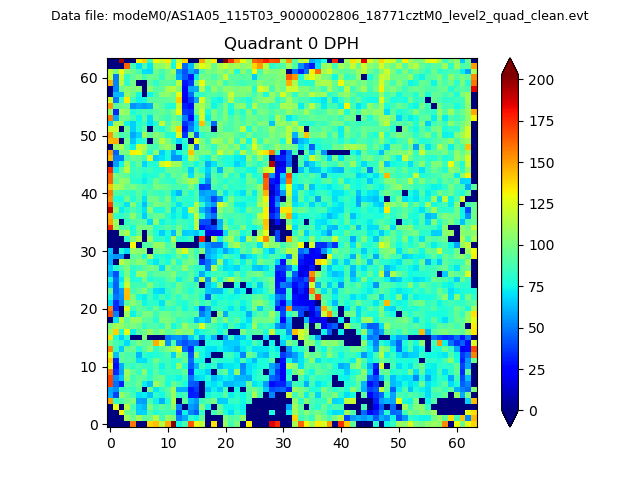 |
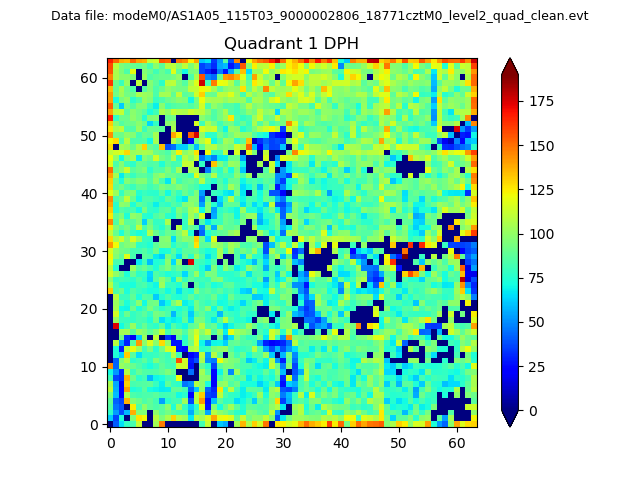 |
Quadrant B |
|---|---|---|---|
| Quadrant D | 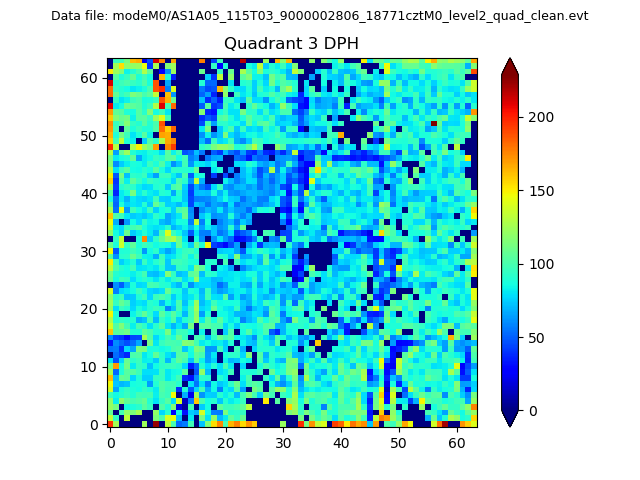 |
 |
Quadrant C |
| Plot type | Count rate plots | Images |
|---|---|---|
| Comparison with Poisson distribution Blue bars denote a histogram of data divided into 1 sec bins. Red curve is a Poisson curve with rate = median count rate of data. |
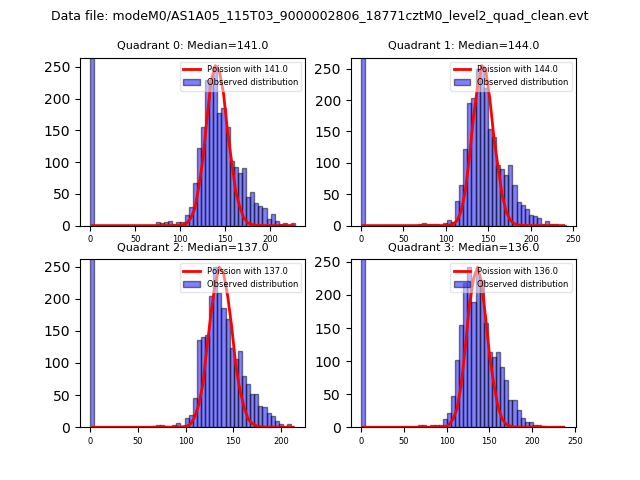 |
 |
| Quadrant-wise count rates Data is divided into 100 sec bins |
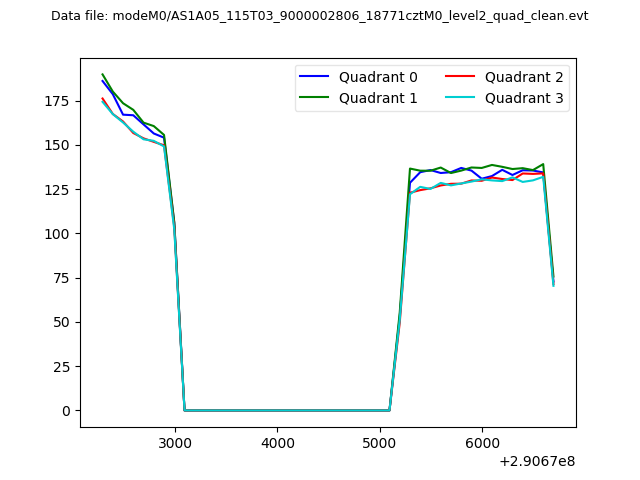 |
|
| Module-wise count rates for Quadrant A Data is divided into 100 sec bins |
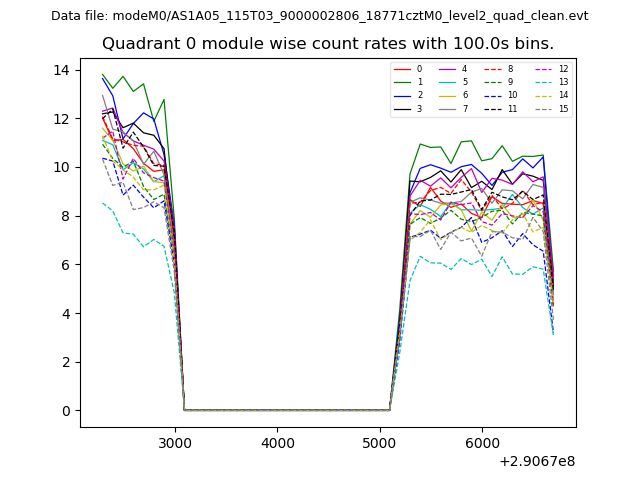 |
 |
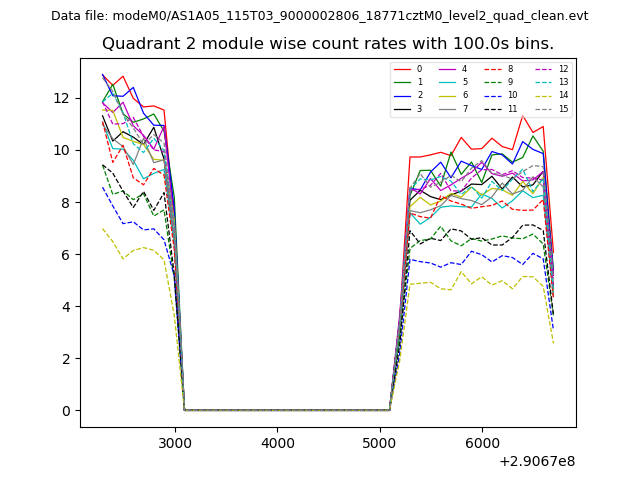
| Module-wise count rates for Quadrant B Data is divided into 100 sec bins |
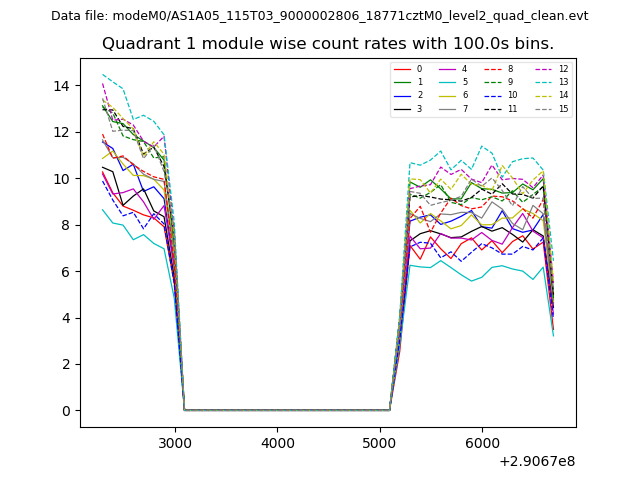 |
 |
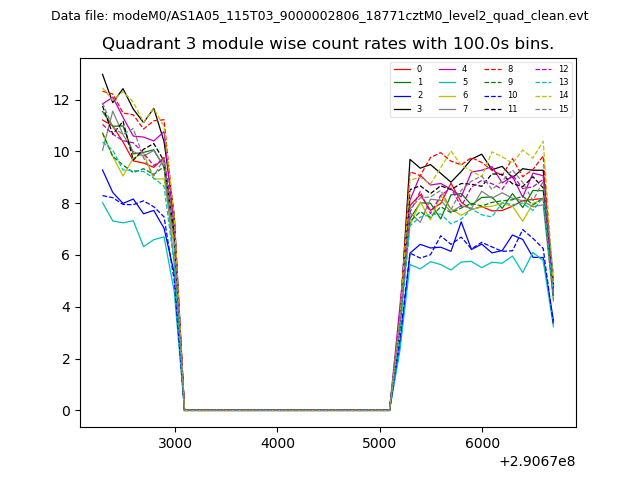
| Module-wise count rates for Quadrant C Data is divided into 100 sec bins |
 |
 |
| Module-wise count rates for Quadrant D Data is divided into 100 sec bins |
 |
 |
| Parameter | Plot |
|---|---|
| CZT HV Monitor | 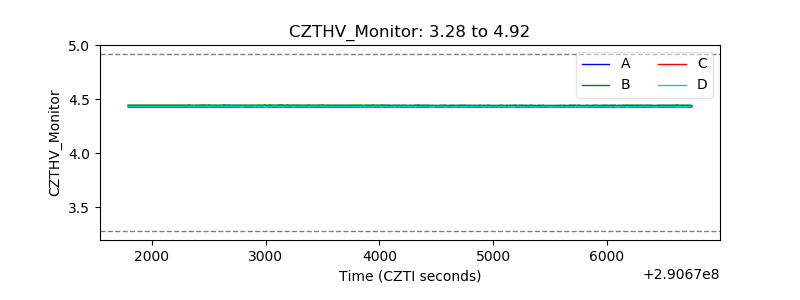 |
| D_VDD | 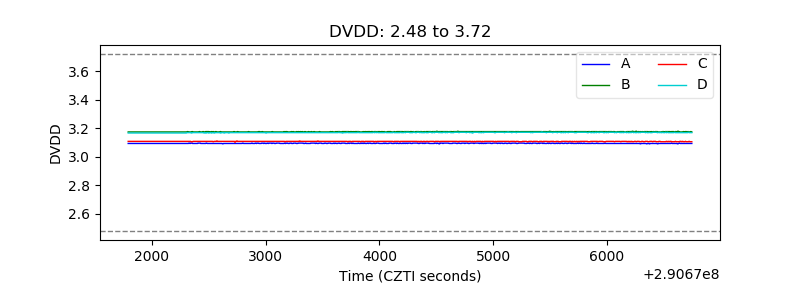 |
| Temperature 1 | 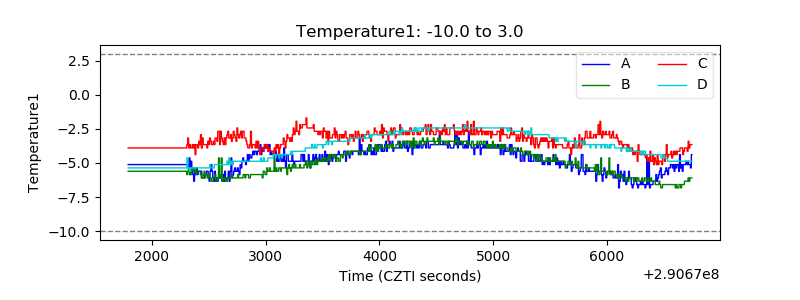 |
| Veto HV Monitor | 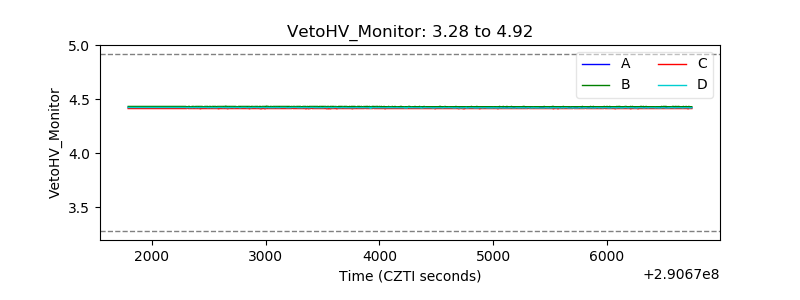 |
| Veto LLD | 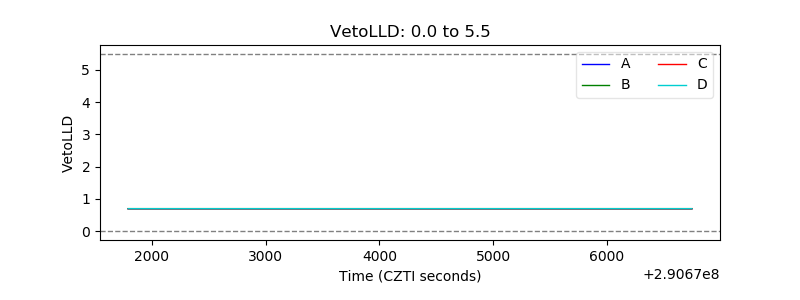 |
| Alpha Counter | 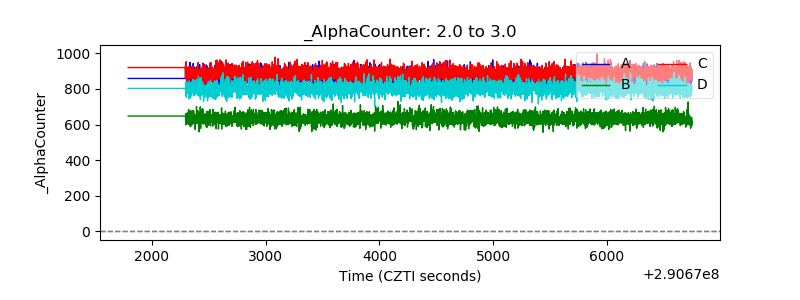 |
| _CPM_Rate | 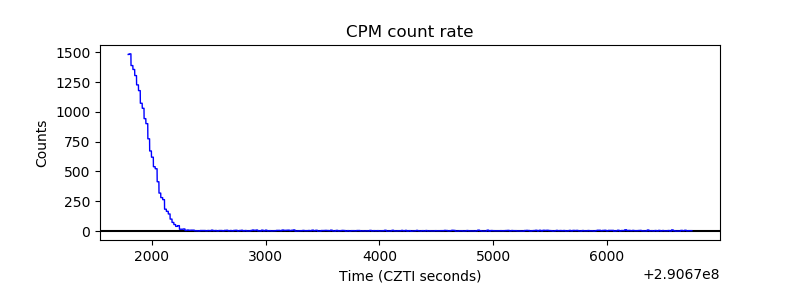 |
| CZT Counter |  |
| +2.5 Volts monitor |  |
| +5 Volts monitor |  |
| _ROLL_ROT | 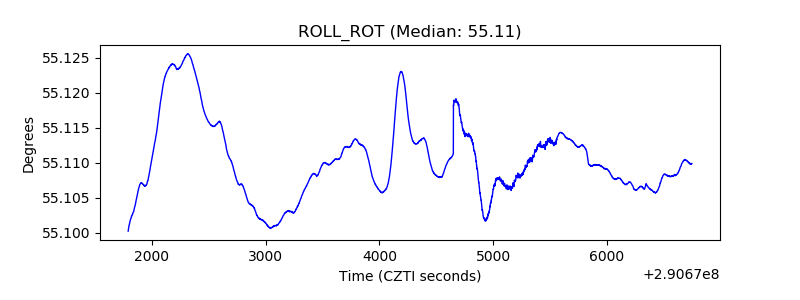 |
| _Roll_DEC | 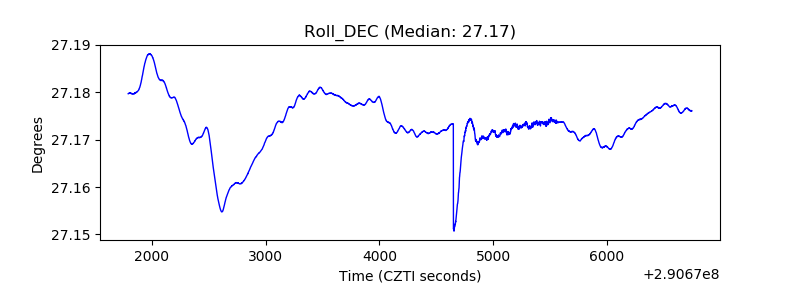 |
| _Roll_RA | 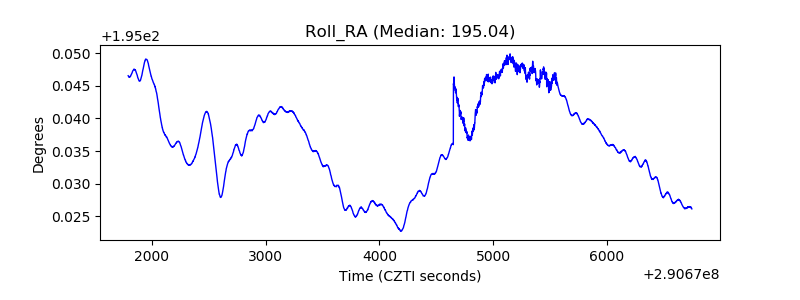 |
| Veto Counter | 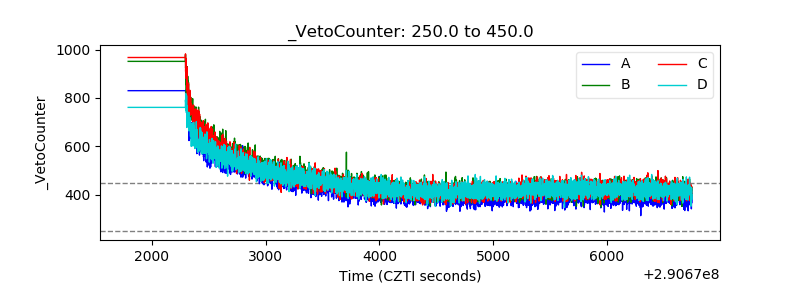 |