| Param | Original file | Final file |
|---|---|---|
| Filename | modeM0/AS1A05_024T01_9000002810cztM0_level2.fits | modeM0/AS1A05_024T01_9000002810cztM0_level2_quad_clean.evt |
| Size (bytes) | 1,323,875,520 | 1,185,935,040 |
| Size | 1.2 GB | 1.1 GB |
| Events in quadrant A | 8,180,866 | 7,001,826 |
| Events in quadrant B | 7,843,960 | 7,053,133 |
| Events in quadrant C | 8,007,912 | 6,682,229 |
| Events in quadrant D | 6,973,798 | 6,092,498 |
| Mode SS | |||
|---|---|---|---|
| Quadrant | BADHDUFLAG | Total packets | Discarded packets |
| A | 0 | 2696 | 0 |
| B | 0 | 2696 | 0 |
| C | 0 | 2696 | 0 |
| D | 0 | 2696 | 0 |
| Mode M9 | |||
|---|---|---|---|
| Quadrant | BADHDUFLAG | Total packets | Discarded packets |
| A | 0 | 227 | 0 |
| B | 0 | 227 | 0 |
| C | 0 | 226 | 0 |
| D | 0 | 227 | 0 |
| Mode M0 | |||
|---|---|---|---|
| Quadrant | BADHDUFLAG | Total packets | Discarded packets |
| A | 0 | 281913 | 0 |
| B | 0 | 284060 | 0 |
| C | 0 | 286678 | 0 |
| D | 0 | 319526 | 0 |
| Quadrant | Total seconds | Saturated seconds | Saturation percentage |
|---|---|---|---|
| A | 132627 | 1759 | 1.326276% |
| B | 132632 | 1915 | 1.443845% |
| C | 132639 | 2388 | 1.800375% |
| D | 132624 | 3885 | 2.929334% |
Noise dominated data is calculated using 1-second bins in cleaned event files. If a bin has >2000 counts, and if more than 50% of those come from <1% of pixels, then it is considered to be noise-dominated and hence unusable.
| Quadrant | # 1 sec bins | Bins with >0 counts | Bins with >2000 counts | High rate bins dominated by noise | Noise dominated (total time) | Noise dominated (detector-on time) | Marked lightcurve |
|---|---|---|---|---|---|---|---|
| A | 156183 | 132648 | 0 | 0 | 0.00% | 0.00% |  |
| B | 156183 | 132654 | 0 | 0 | 0.00% | 0.00% | 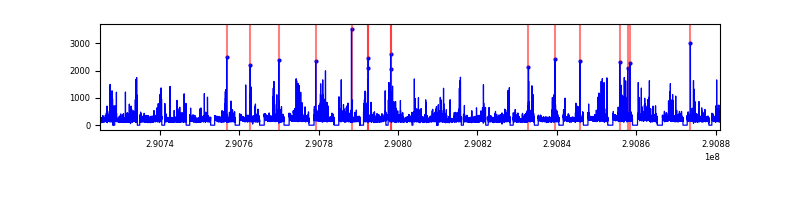 |
| C | 156183 | 132649 | 0 | 0 | 0.00% | 0.00% |  |
| D | 156183 | 132619 | 0 | 0 | 0.00% | 0.00% |  |
Top three noisy pixels from each quadrant. If the there are fewer than three noisy pixels in the level2.evt file, extra rows are filled as -1
| Pixel properties | Quadrant properties | ||||||
|---|---|---|---|---|---|---|---|
| Quadrant | DetID | PixID | Counts | Sigma | Mean | Median | Sigma |
| A | 0 | 29 | 7888 | 11.53 | 2130 | 2005 | 510.4 |
| A | 7 | 110 | 6525 | 8.86 | 2130 | 2005 | 510.4 |
| A | 9 | 19 | 6215 | 8.25 | 2130 | 2005 | 510.4 |
| B | 2 | 9 | 6316 | 10.7 | 2076 | 1984 | 405.0 |
| B | 2 | 8 | 5255 | 8.08 | 2076 | 1984 | 405.0 |
| B | 3 | 17 | 5167 | 7.86 | 2076 | 1984 | 405.0 |
| C | 1 | 81 | 6115 | 7.71 | 2113 | 1982 | 536.1 |
| C | 1 | 80 | 6110 | 7.7 | 2113 | 1982 | 536.1 |
| C | 12 | 241 | 5443 | 6.45 | 2113 | 1982 | 536.1 |
| D | 10 | 190 | 5215 | 6.54 | 1989 | 1821 | 519.1 |
| D | 6 | 231 | 4903 | 5.94 | 1989 | 1821 | 519.1 |
| D | 7 | 3 | 4885 | 5.9 | 1989 | 1821 | 519.1 |
Histogram calculated using DETX and DETY for each event in the final _common_clean file
| Quadrant A |  |
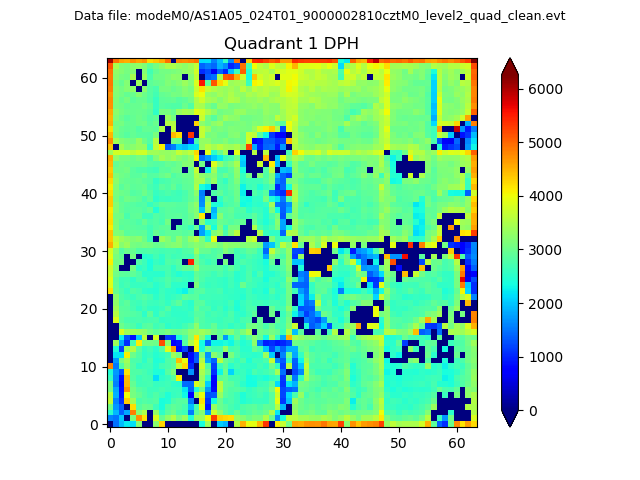 |
Quadrant B |
|---|---|---|---|
| Quadrant D |  |
 |
Quadrant C |
| Plot type | Count rate plots | Images |
|---|---|---|
| Comparison with Poisson distribution Blue bars denote a histogram of data divided into 1 sec bins. Red curve is a Poisson curve with rate = median count rate of data. |
 |
 |
| Quadrant-wise count rates Data is divided into 100 sec bins |
 |
|
| Module-wise count rates for Quadrant A Data is divided into 100 sec bins |
 |
 |
| Module-wise count rates for Quadrant B Data is divided into 100 sec bins |
 |
 |
| Module-wise count rates for Quadrant C Data is divided into 100 sec bins |
 |
 |
| Module-wise count rates for Quadrant D Data is divided into 100 sec bins |
 |
 |
| Parameter | Plot |
|---|---|
| CZT HV Monitor |  |
| D_VDD |  |
| Temperature 1 |  |
| Veto HV Monitor |  |
| Veto LLD |  |
| Alpha Counter |  |
| _CPM_Rate |  |
| CZT Counter |  |
| +2.5 Volts monitor |  |
| +5 Volts monitor |  |
| _ROLL_ROT |  |
| _Roll_DEC |  |
| _Roll_RA |  |
| Veto Counter |  |