| Param | Original file | Final file |
|---|---|---|
| Filename | modeM0/AS1A05_024T01_9000002810_18782cztM0_level2.evt | modeM0/AS1A05_024T01_9000002810_18782cztM0_level2_quad_clean.evt |
| Size (bytes) | 1,524,398,400 | 261,820,800 |
| Size | 1.4 GB | 249.7 MB |
| Events in quadrant A | 11,463,790 | 1,630,797 |
| Events in quadrant B | 10,342,327 | 1,674,864 |
| Events in quadrant C | 10,790,399 | 1,602,229 |
| Events in quadrant D | 12,123,626 | 1,547,591 |
| Mode SS | |||
|---|---|---|---|
| Quadrant | BADHDUFLAG | Total packets | Discarded packets |
| A | 0 | 436 | 0 |
| B | 0 | 436 | 0 |
| C | 0 | 436 | 0 |
| D | 0 | 436 | 0 |
| Mode M9 | |||
|---|---|---|---|
| Quadrant | BADHDUFLAG | Total packets | Discarded packets |
| A | 0 | 28 | 0 |
| B | 0 | 28 | 0 |
| C | 0 | 28 | 0 |
| D | 0 | 28 | 0 |
| Mode M0 | |||
|---|---|---|---|
| Quadrant | BADHDUFLAG | Total packets | Discarded packets |
| A | 0 | 48443 | 4 |
| B | 0 | 44547 | 4 |
| C | 0 | 45495 | 4 |
| D | 0 | 50475 | 4 |
| Quadrant | Total seconds | Saturated seconds | Saturation percentage |
|---|---|---|---|
| A | 21424 | 319 | 1.488984% |
| B | 21424 | 119 | 0.555452% |
| C | 21424 | 225 | 1.050224% |
| D | 21424 | 373 | 1.741038% |
Noise dominated data is calculated using 1-second bins in cleaned event files. If a bin has >2000 counts, and if more than 50% of those come from <1% of pixels, then it is considered to be noise-dominated and hence unusable.
| Quadrant | # 1 sec bins | Bins with >0 counts | Bins with >2000 counts | High rate bins dominated by noise | Noise dominated (total time) | Noise dominated (detector-on time) | Marked lightcurve |
|---|---|---|---|---|---|---|---|
| A | 24089 | 21429 | 164 | 164 | 0.68% | 0.77% | 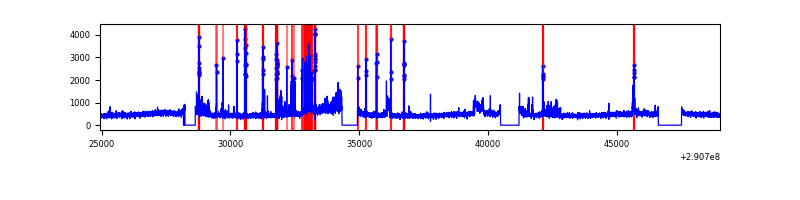 |
| B | 24089 | 21429 | 6 | 6 | 0.02% | 0.03% | 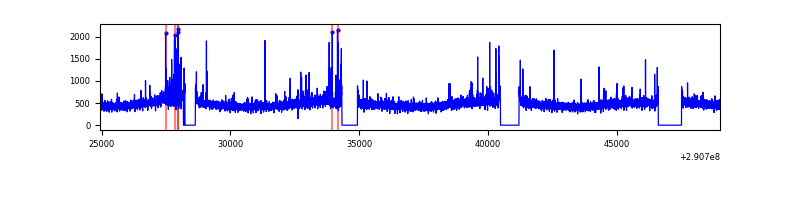 |
| C | 24089 | 21429 | 0 | 0 | 0.00% | 0.00% | 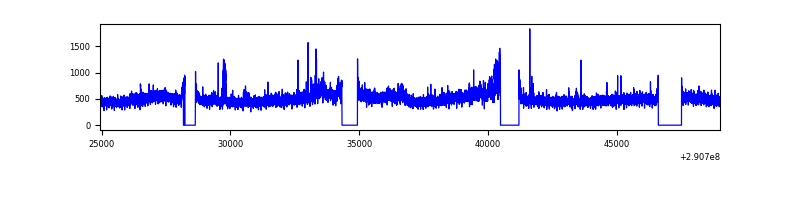 |
| D | 24089 | 21429 | 299 | 299 | 1.24% | 1.40% | 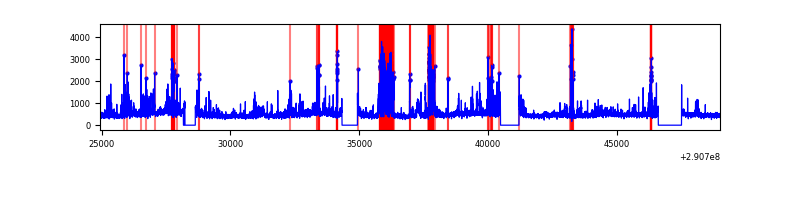 |
Top three noisy pixels from each quadrant. If the there are fewer than three noisy pixels in the level2.evt file, extra rows are filled as -1
| Pixel properties | Quadrant properties | ||||||
|---|---|---|---|---|---|---|---|
| Quadrant | DetID | PixID | Counts | Sigma | Mean | Median | Sigma |
| A | 6 | 16 | 1066184 | 2074.15 | 2550 | 2500 | 512.8 |
| A | 0 | 254 | 486208 | 943.21 | 2550 | 2500 | 512.8 |
| A | 4 | 2 | 41070 | 75.21 | 2550 | 2500 | 512.8 |
| B | 0 | 197 | 81037 | 161.47 | 2560 | 2492 | 486.4 |
| B | 12 | 111 | 59605 | 117.41 | 2560 | 2492 | 486.4 |
| B | 7 | 220 | 59488 | 117.17 | 2560 | 2492 | 486.4 |
| C | 3 | 233 | 712414 | 1222.76 | 2485 | 2500 | 580.6 |
| C | 14 | 238 | 384603 | 658.14 | 2485 | 2500 | 580.6 |
| C | 13 | 61 | 17232 | 25.37 | 2485 | 2500 | 580.6 |
| D | 1 | 52 | 1993493 | 3295.56 | 2497 | 2432 | 604.2 |
| D | 12 | 110 | 247825 | 406.17 | 2497 | 2432 | 604.2 |
| D | 9 | 1 | 219335 | 359.01 | 2497 | 2432 | 604.2 |
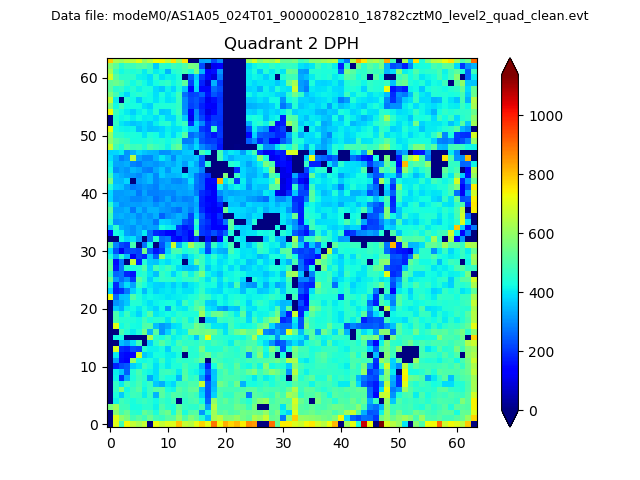
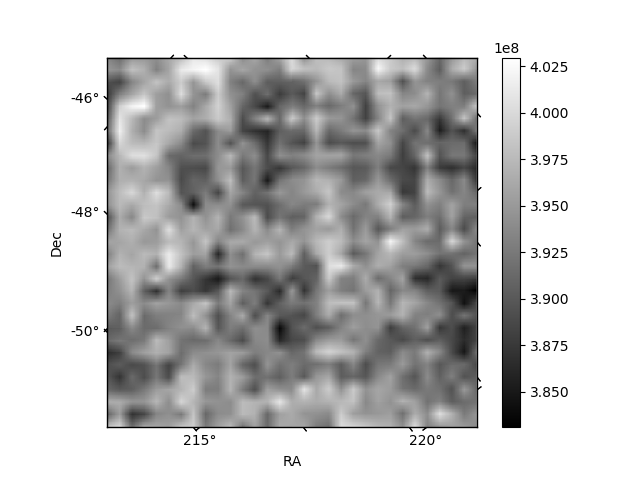
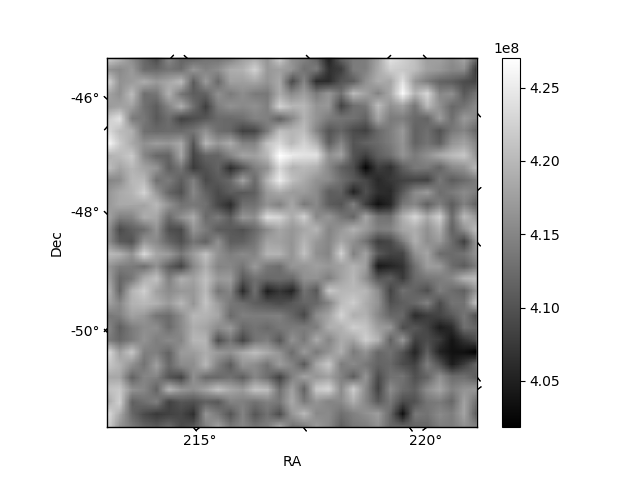
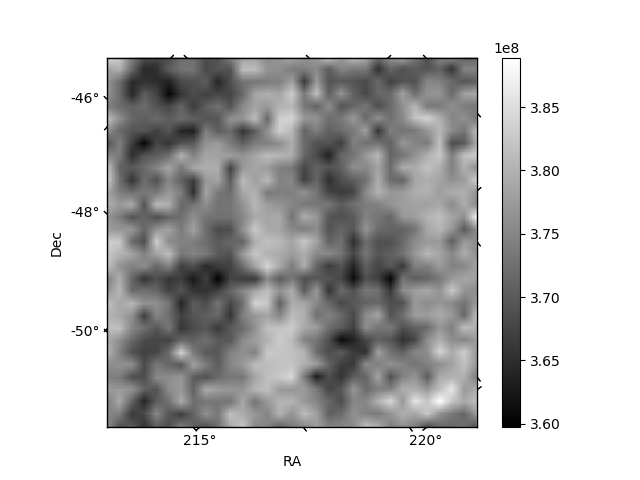
Histogram calculated using DETX and DETY for each event in the final _common_clean file
| Quadrant A |  |
 |
Quadrant B |
|---|---|---|---|
| Quadrant D | 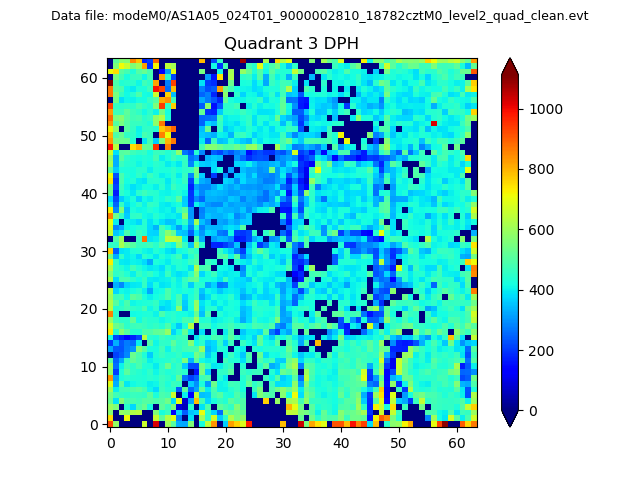 |
 |
Quadrant C |
| Plot type | Count rate plots | Images |
|---|---|---|
| Comparison with Poisson distribution Blue bars denote a histogram of data divided into 1 sec bins. Red curve is a Poisson curve with rate = median count rate of data. |
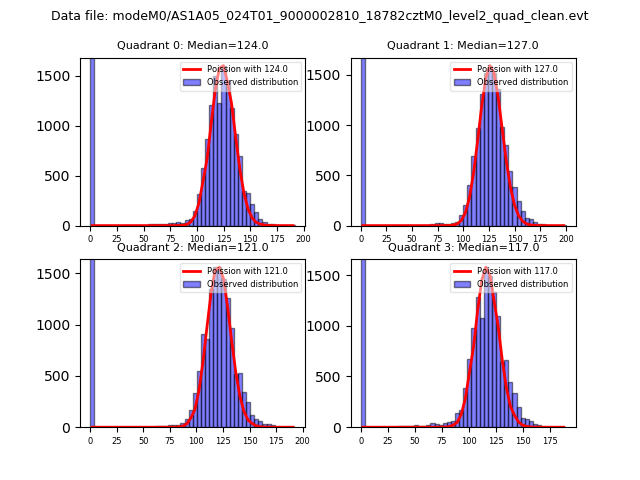 |
 |
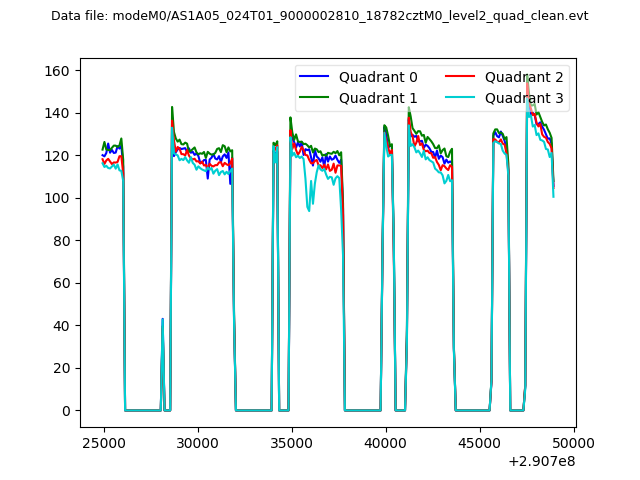
| Quadrant-wise count rates Data is divided into 100 sec bins |
 |
|
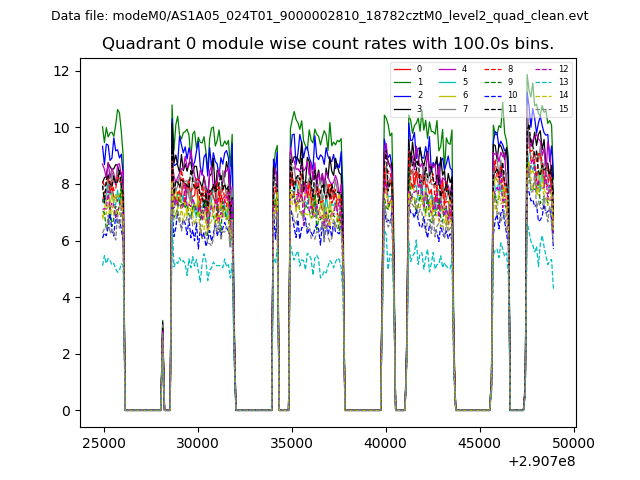
| Module-wise count rates for Quadrant A Data is divided into 100 sec bins |
 |
 |
| Module-wise count rates for Quadrant B Data is divided into 100 sec bins |
 |
 |
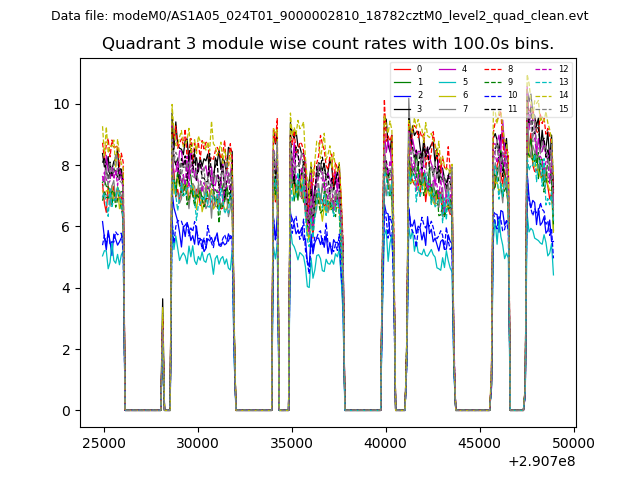
| Module-wise count rates for Quadrant C Data is divided into 100 sec bins |
 |
 |
| Module-wise count rates for Quadrant D Data is divided into 100 sec bins |
 |
 |
| Parameter | Plot |
|---|---|
| CZT HV Monitor | 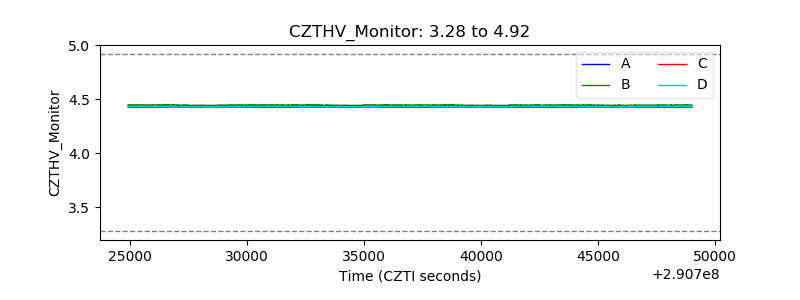 |
| D_VDD | 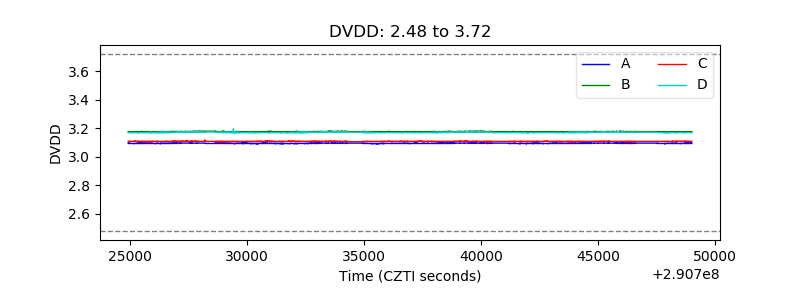 |
| Temperature 1 | 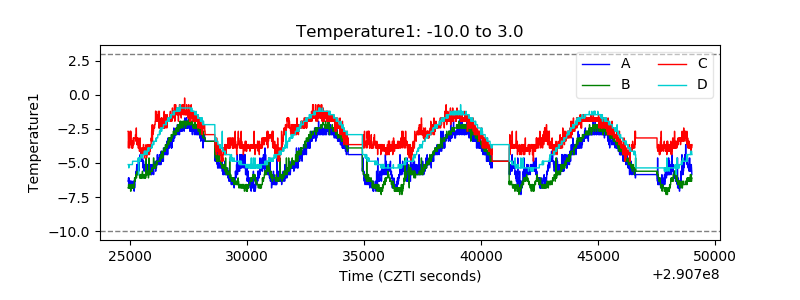 |
| Veto HV Monitor | 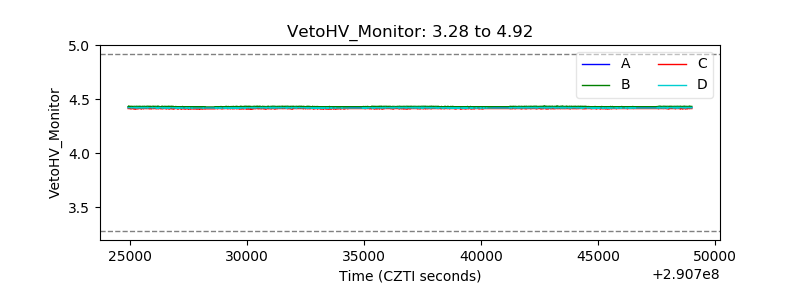 |
| Veto LLD | 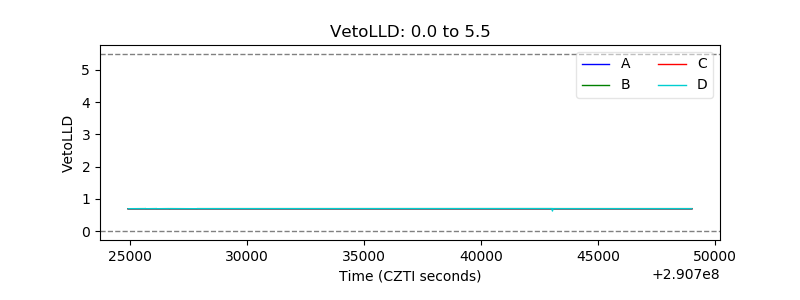 |
| Alpha Counter | 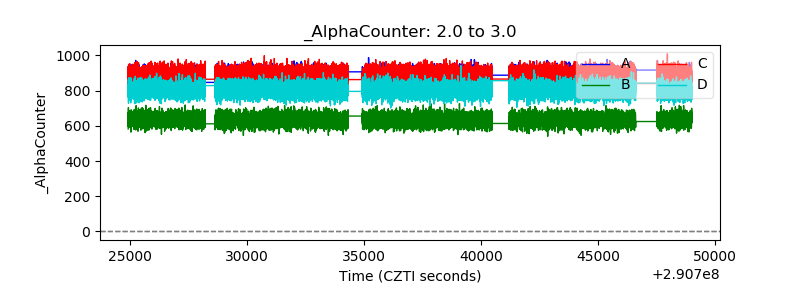 |
| _CPM_Rate | 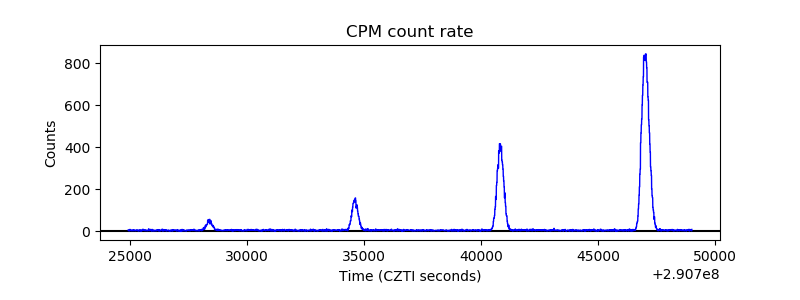 |
| CZT Counter | 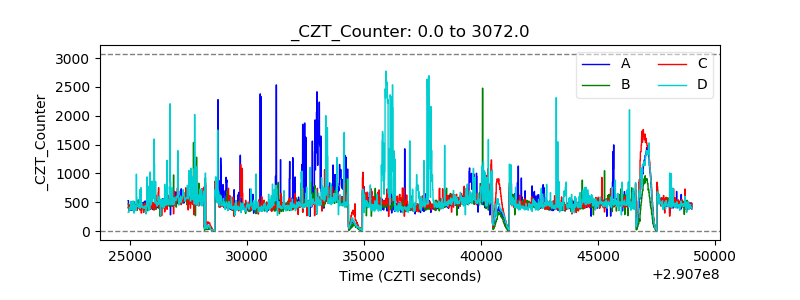 |
| +2.5 Volts monitor | 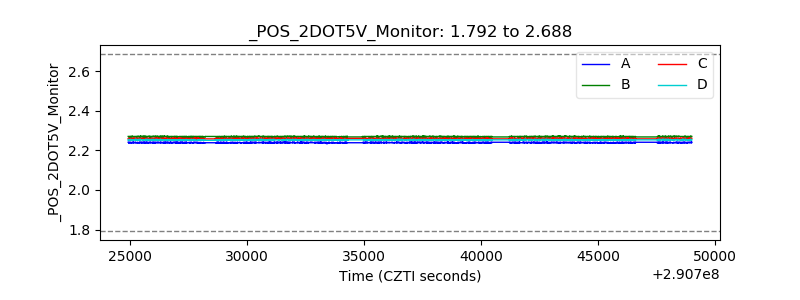 |
| +5 Volts monitor |  |
| _ROLL_ROT | 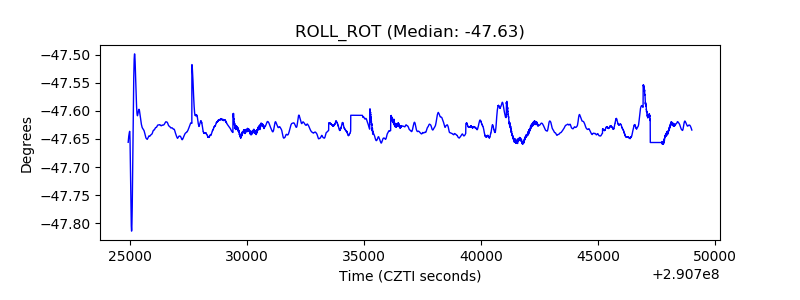 |
| _Roll_DEC | 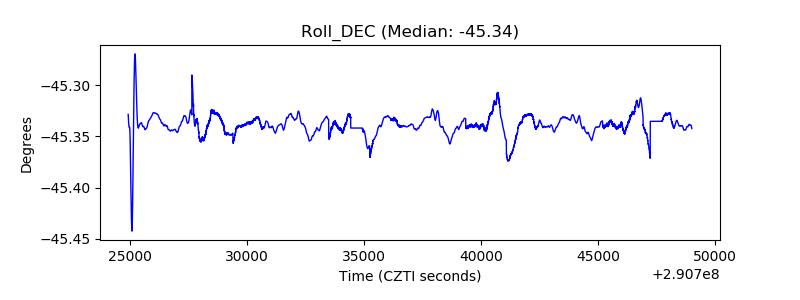 |
| _Roll_RA | 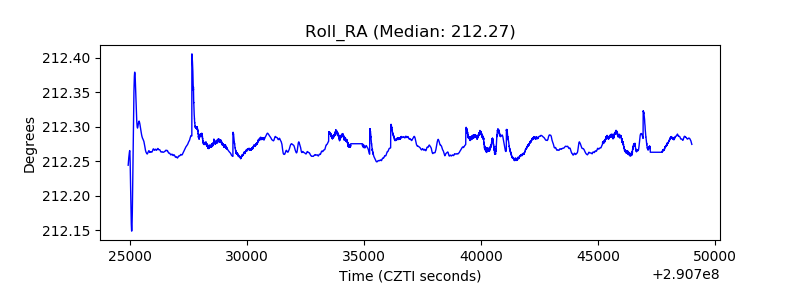 |
| Veto Counter | 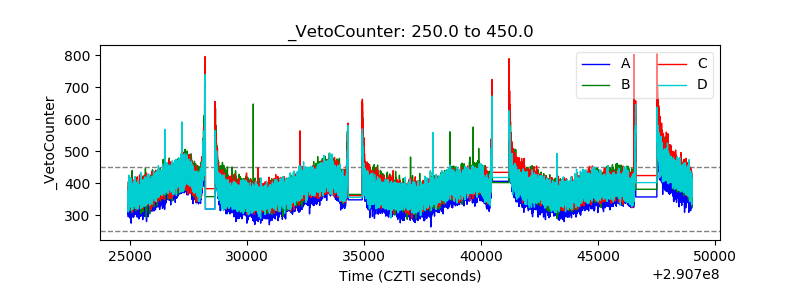 |