| Param | Original file | Final file |
|---|---|---|
| Filename | modeM0/AS1A05_024T01_9000002810_18785cztM0_level2.evt | modeM0/AS1A05_024T01_9000002810_18785cztM0_level2_quad_clean.evt |
| Size (bytes) | 428,425,920 | 89,732,160 |
| Size | 408.6 MB | 85.6 MB |
| Events in quadrant A | 3,199,840 | 576,283 |
| Events in quadrant B | 3,121,149 | 591,444 |
| Events in quadrant C | 3,153,297 | 568,112 |
| Events in quadrant D | 3,083,736 | 553,438 |
| Mode SS | |||
|---|---|---|---|
| Quadrant | BADHDUFLAG | Total packets | Discarded packets |
| A | 0 | 126 | 0 |
| B | 0 | 126 | 0 |
| C | 0 | 126 | 0 |
| D | 0 | 126 | 0 |
| Mode M9 | |||
|---|---|---|---|
| Quadrant | BADHDUFLAG | Total packets | Discarded packets |
| A | 0 | 11 | 0 |
| B | 0 | 11 | 0 |
| C | 0 | 11 | 0 |
| D | 0 | 11 | 0 |
| Mode M0 | |||
|---|---|---|---|
| Quadrant | BADHDUFLAG | Total packets | Discarded packets |
| A | 0 | 13316 | 1 |
| B | 0 | 12962 | 1 |
| C | 0 | 13147 | 1 |
| D | 0 | 13004 | 1 |
| Quadrant | Total seconds | Saturated seconds | Saturation percentage |
|---|---|---|---|
| A | 6128 | 91 | 1.484987% |
| B | 6128 | 54 | 0.881201% |
| C | 6127 | 105 | 1.713726% |
| D | 6127 | 45 | 0.734454% |
Noise dominated data is calculated using 1-second bins in cleaned event files. If a bin has >2000 counts, and if more than 50% of those come from <1% of pixels, then it is considered to be noise-dominated and hence unusable.
| Quadrant | # 1 sec bins | Bins with >0 counts | Bins with >2000 counts | High rate bins dominated by noise | Noise dominated (total time) | Noise dominated (detector-on time) | Marked lightcurve |
|---|---|---|---|---|---|---|---|
| A | 7253 | 6129 | 38 | 38 | 0.52% | 0.62% | 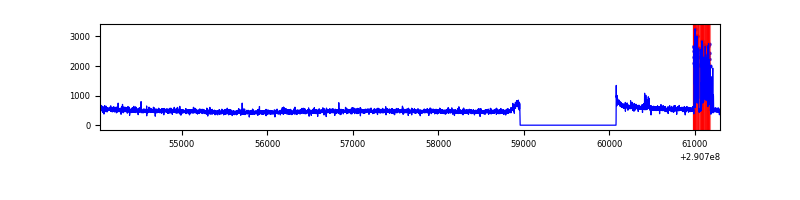 |
| B | 7253 | 6129 | 1 | 1 | 0.01% | 0.02% | 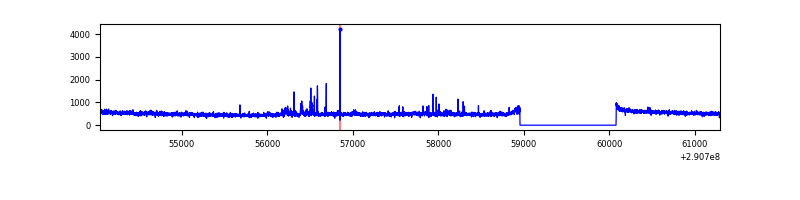 |
| C | 7252 | 6128 | 14 | 14 | 0.19% | 0.23% | 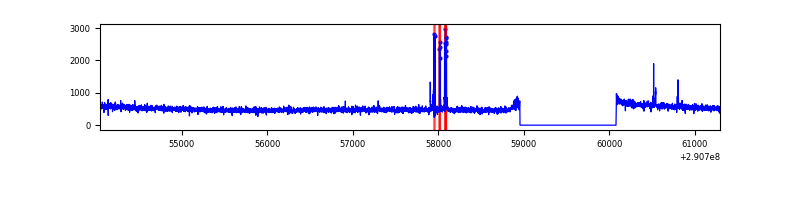 |
| D | 7252 | 6128 | 2 | 2 | 0.03% | 0.03% | 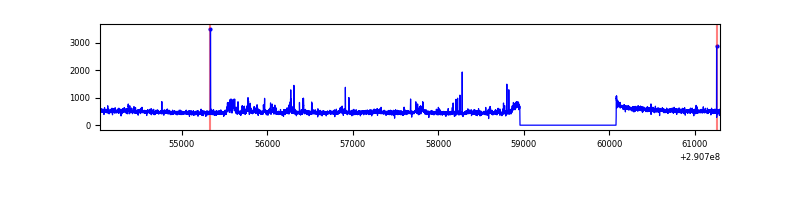 |
Top three noisy pixels from each quadrant. If the there are fewer than three noisy pixels in the level2.evt file, extra rows are filled as -1
| Pixel properties | Quadrant properties | ||||||
|---|---|---|---|---|---|---|---|
| Quadrant | DetID | PixID | Counts | Sigma | Mean | Median | Sigma |
| A | 6 | 16 | 191225 | 1226.99 | 776 | 761 | 155.2 |
| A | 11 | 29 | 10969 | 65.76 | 776 | 761 | 155.2 |
| A | 13 | 254 | 9609 | 57.0 | 776 | 761 | 155.2 |
| B | 10 | 245 | 44657 | 298.48 | 775 | 754 | 147.1 |
| B | 12 | 111 | 17104 | 111.16 | 775 | 754 | 147.1 |
| B | 11 | 111 | 15128 | 97.72 | 775 | 754 | 147.1 |
| C | 14 | 238 | 119556 | 668.31 | 759 | 764 | 177.7 |
| C | 6 | 96 | 39151 | 215.96 | 759 | 764 | 177.7 |
| C | 9 | 54 | 19868 | 107.48 | 759 | 764 | 177.7 |
| D | 12 | 110 | 157644 | 839.36 | 767 | 745 | 186.9 |
| D | 2 | 234 | 24871 | 129.07 | 767 | 745 | 186.9 |
| D | 13 | 104 | 9515 | 46.92 | 767 | 745 | 186.9 |
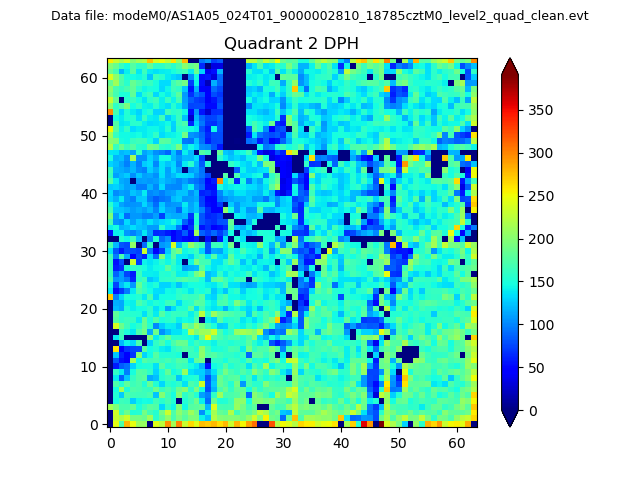
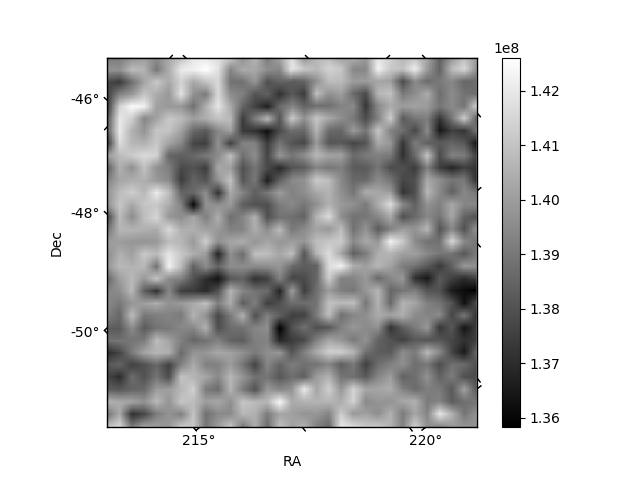
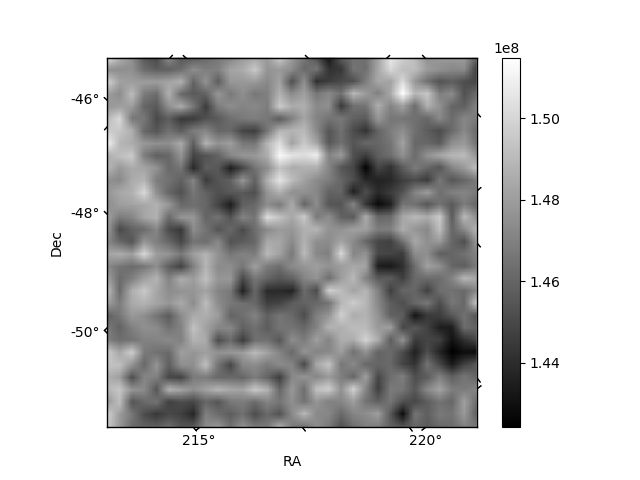
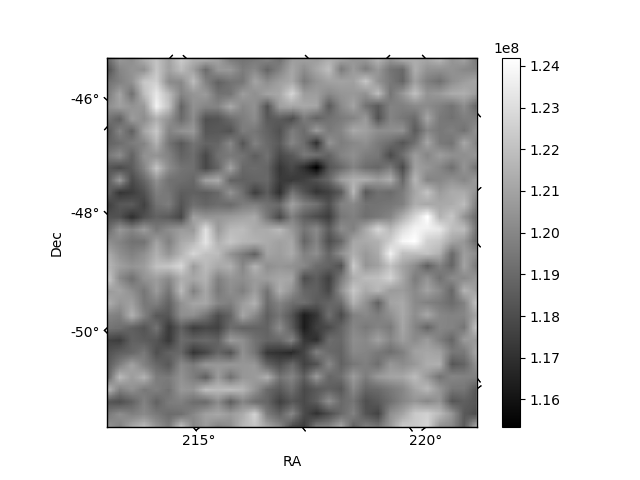
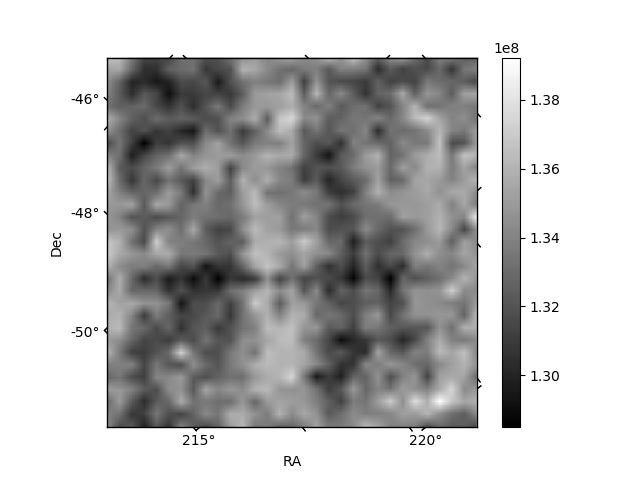
Histogram calculated using DETX and DETY for each event in the final _common_clean file
| Quadrant A | 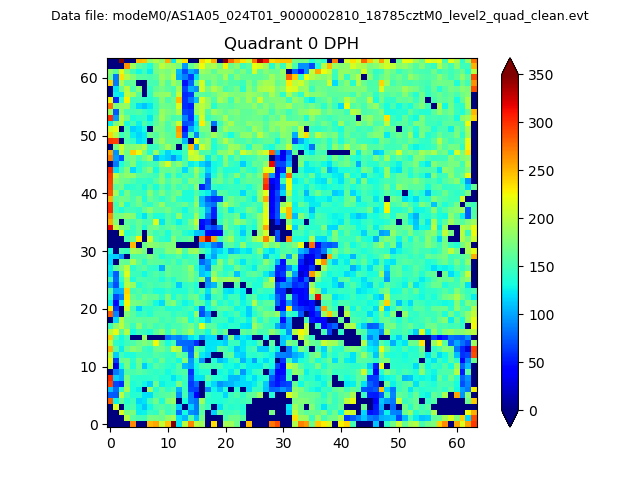 |
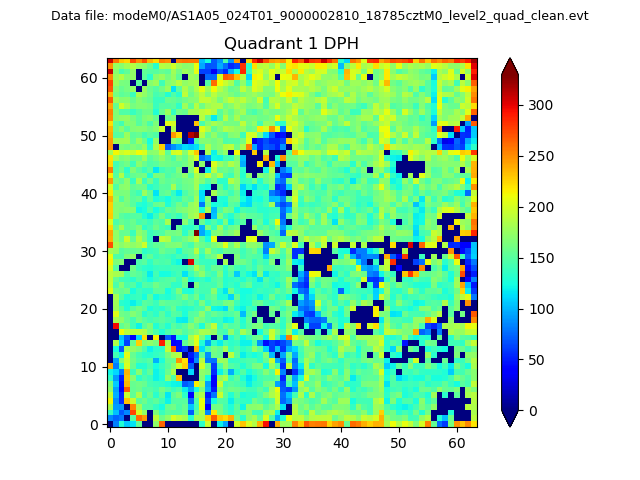 |
Quadrant B |
|---|---|---|---|
| Quadrant D | 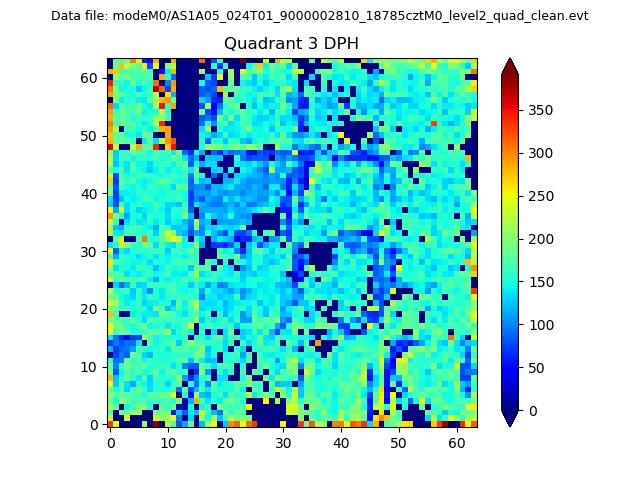 |
 |
Quadrant C |
| Plot type | Count rate plots | Images |
|---|---|---|
| Comparison with Poisson distribution Blue bars denote a histogram of data divided into 1 sec bins. Red curve is a Poisson curve with rate = median count rate of data. |
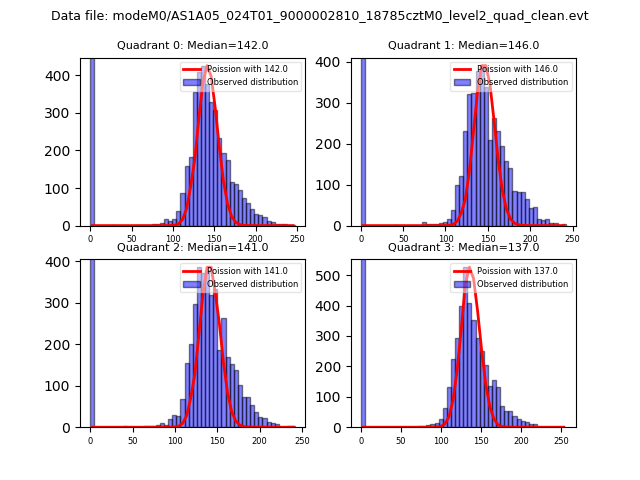 |
 |
| Quadrant-wise count rates Data is divided into 100 sec bins |
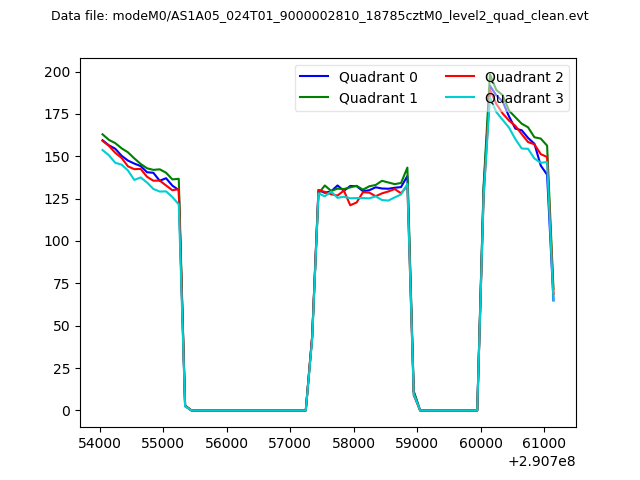 |
|
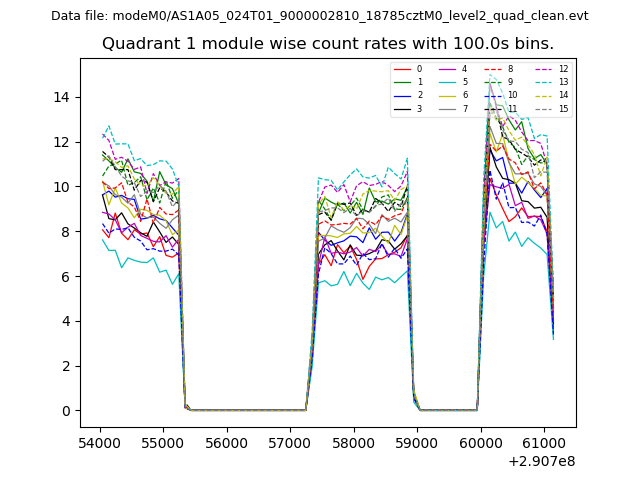
| Module-wise count rates for Quadrant A Data is divided into 100 sec bins |
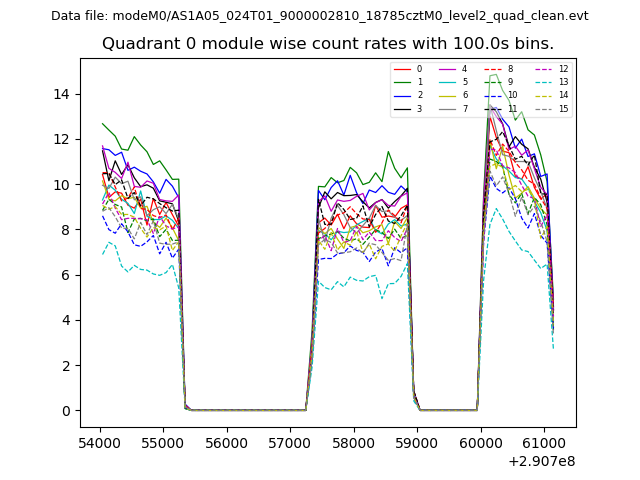 |
 |
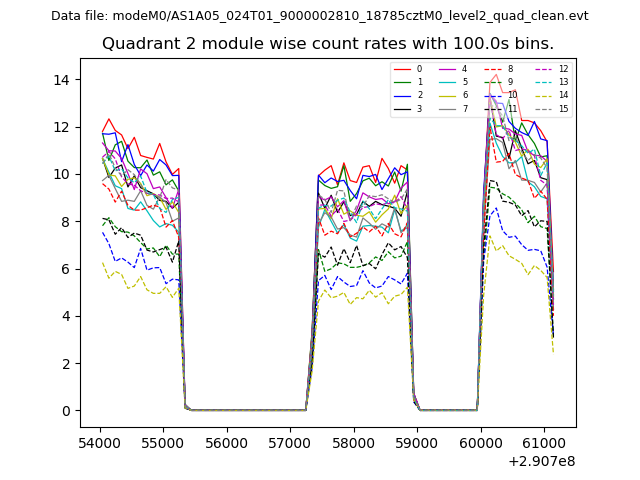
| Module-wise count rates for Quadrant B Data is divided into 100 sec bins |
 |
 |
| Module-wise count rates for Quadrant C Data is divided into 100 sec bins |
 |
 |
| Module-wise count rates for Quadrant D Data is divided into 100 sec bins |
 |
 |
| Parameter | Plot |
|---|---|
| CZT HV Monitor | 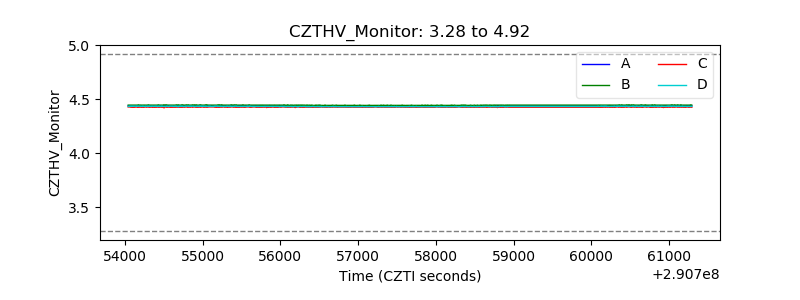 |
| D_VDD |  |
| Temperature 1 | 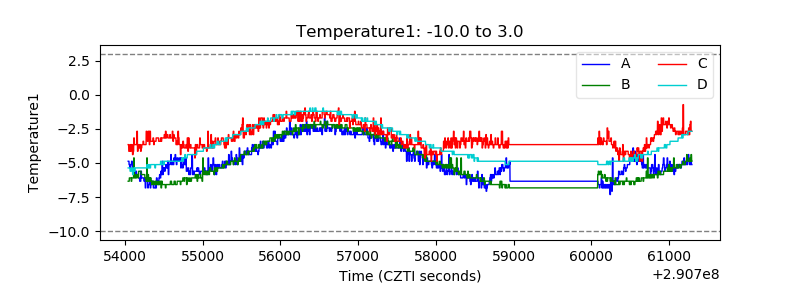 |
| Veto HV Monitor |  |
| Veto LLD |  |
| Alpha Counter | 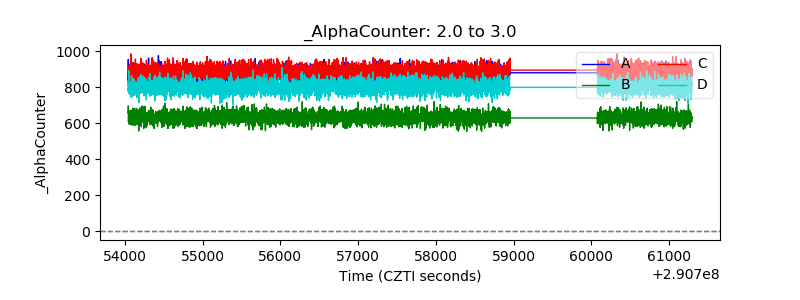 |
| _CPM_Rate | 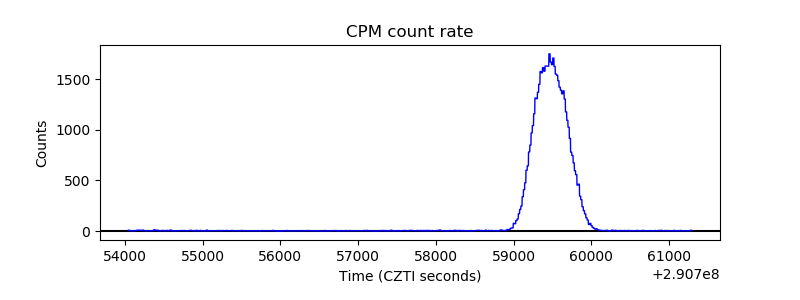 |
| CZT Counter | 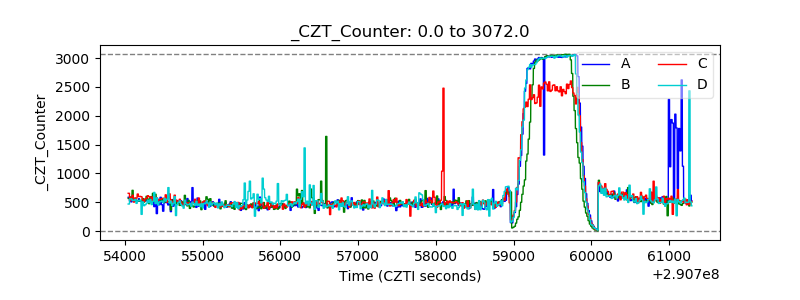 |
| +2.5 Volts monitor |  |
| +5 Volts monitor |  |
| _ROLL_ROT | 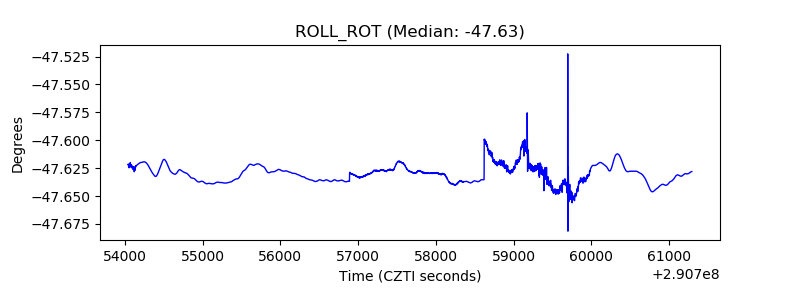 |
| _Roll_DEC | 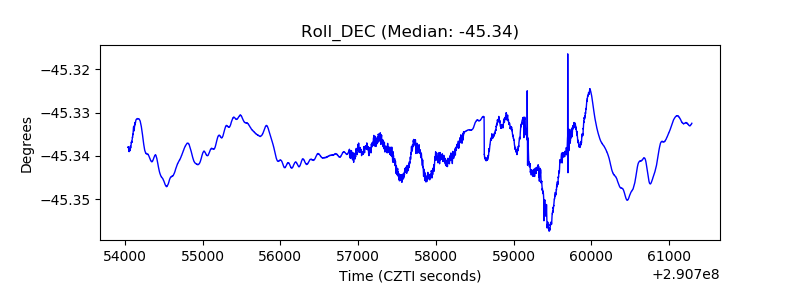 |
| _Roll_RA | 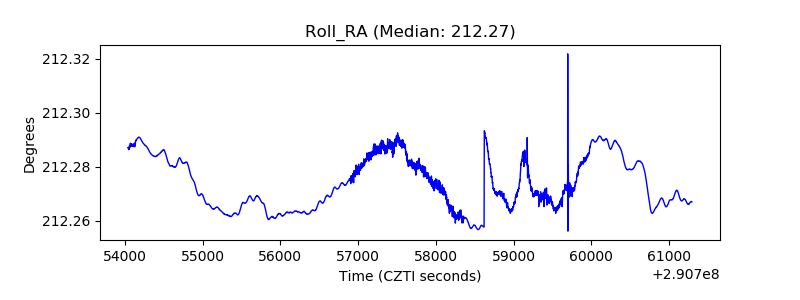 |
| Veto Counter |  |