| Param | Original file | Final file |
|---|---|---|
| Filename | modeM0/AS1A05_024T01_9000002810_18786cztM0_level2.evt | modeM0/AS1A05_024T01_9000002810_18786cztM0_level2_quad_clean.evt |
| Size (bytes) | 433,440,000 | 83,064,960 |
| Size | 413.4 MB | 79.2 MB |
| Events in quadrant A | 3,361,165 | 528,762 |
| Events in quadrant B | 3,153,923 | 541,765 |
| Events in quadrant C | 3,164,408 | 520,664 |
| Events in quadrant D | 3,041,149 | 506,887 |
| Mode SS | |||
|---|---|---|---|
| Quadrant | BADHDUFLAG | Total packets | Discarded packets |
| A | 0 | 122 | 0 |
| B | 0 | 122 | 0 |
| C | 0 | 122 | 0 |
| D | 0 | 122 | 0 |
| Mode M9 | |||
|---|---|---|---|
| Quadrant | BADHDUFLAG | Total packets | Discarded packets |
| A | 0 | 12 | 0 |
| B | 0 | 12 | 0 |
| C | 0 | 12 | 0 |
| D | 0 | 12 | 0 |
| Mode M0 | |||
|---|---|---|---|
| Quadrant | BADHDUFLAG | Total packets | Discarded packets |
| A | 0 | 13727 | 1 |
| B | 0 | 13009 | 1 |
| C | 0 | 13084 | 1 |
| D | 0 | 12750 | 1 |
| Quadrant | Total seconds | Saturated seconds | Saturation percentage |
|---|---|---|---|
| A | 5973 | 152 | 2.544785% |
| B | 5973 | 102 | 1.707685% |
| C | 5973 | 134 | 2.243429% |
| D | 5973 | 85 | 1.423070% |
Noise dominated data is calculated using 1-second bins in cleaned event files. If a bin has >2000 counts, and if more than 50% of those come from <1% of pixels, then it is considered to be noise-dominated and hence unusable.
| Quadrant | # 1 sec bins | Bins with >0 counts | Bins with >2000 counts | High rate bins dominated by noise | Noise dominated (total time) | Noise dominated (detector-on time) | Marked lightcurve |
|---|---|---|---|---|---|---|---|
| A | 7153 | 5974 | 50 | 50 | 0.70% | 0.84% | 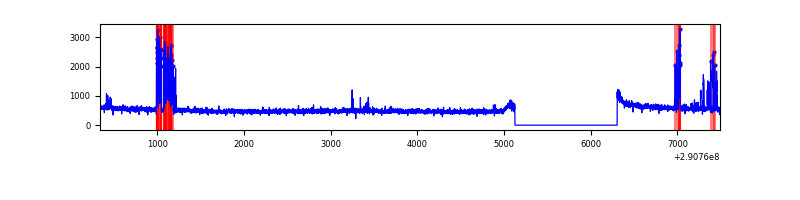 |
| B | 7153 | 5973 | 5 | 5 | 0.07% | 0.08% | 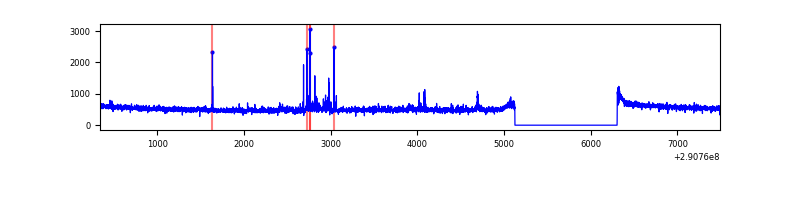 |
| C | 7153 | 5973 | 0 | 0 | 0.00% | 0.00% | 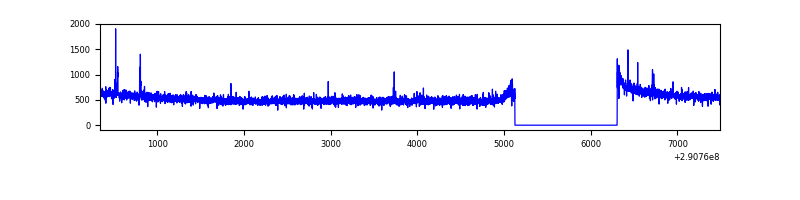 |
| D | 7153 | 5974 | 6 | 6 | 0.08% | 0.10% | 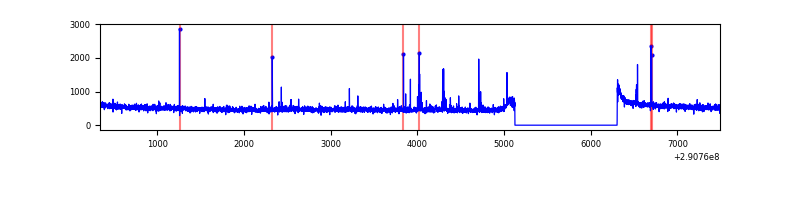 |
Top three noisy pixels from each quadrant. If the there are fewer than three noisy pixels in the level2.evt file, extra rows are filled as -1
| Pixel properties | Quadrant properties | ||||||
|---|---|---|---|---|---|---|---|
| Quadrant | DetID | PixID | Counts | Sigma | Mean | Median | Sigma |
| A | 6 | 16 | 278690 | 1749.41 | 795 | 782 | 158.9 |
| A | 12 | 96 | 15115 | 90.23 | 795 | 782 | 158.9 |
| A | 13 | 254 | 9131 | 52.56 | 795 | 782 | 158.9 |
| B | 7 | 220 | 34610 | 229.17 | 788 | 769 | 147.7 |
| B | 12 | 111 | 16985 | 109.81 | 788 | 769 | 147.7 |
| B | 11 | 111 | 14991 | 96.31 | 788 | 769 | 147.7 |
| C | 14 | 238 | 122790 | 685.35 | 772 | 777 | 178.0 |
| C | 6 | 96 | 13526 | 71.61 | 772 | 777 | 178.0 |
| C | 5 | 112 | 13410 | 70.96 | 772 | 777 | 178.0 |
| D | 2 | 234 | 23618 | 120.64 | 783 | 760 | 189.5 |
| D | 7 | 223 | 22723 | 115.92 | 783 | 760 | 189.5 |
| D | 7 | 238 | 21556 | 109.76 | 783 | 760 | 189.5 |
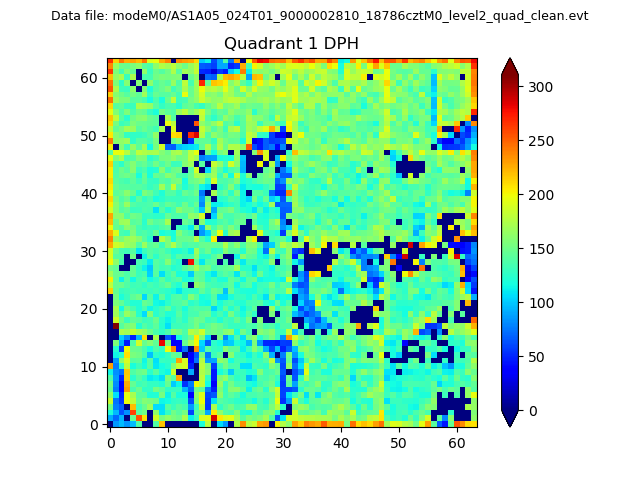
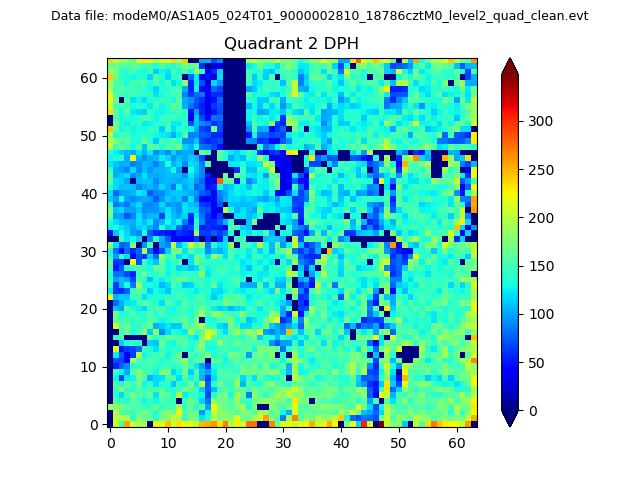
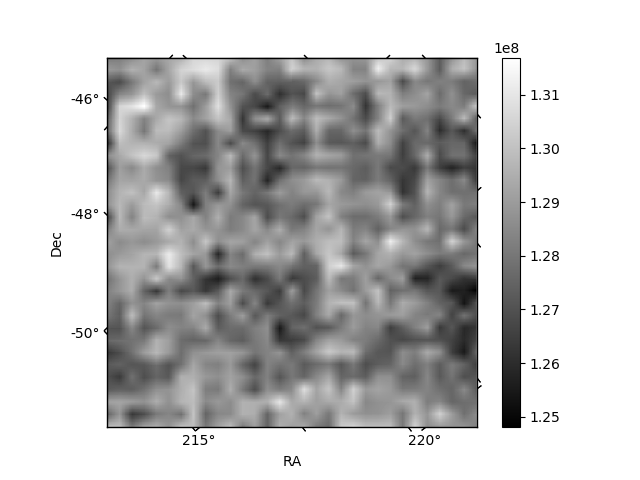
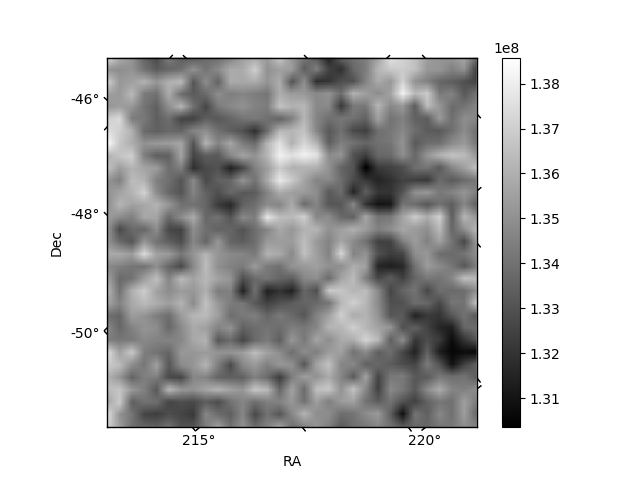
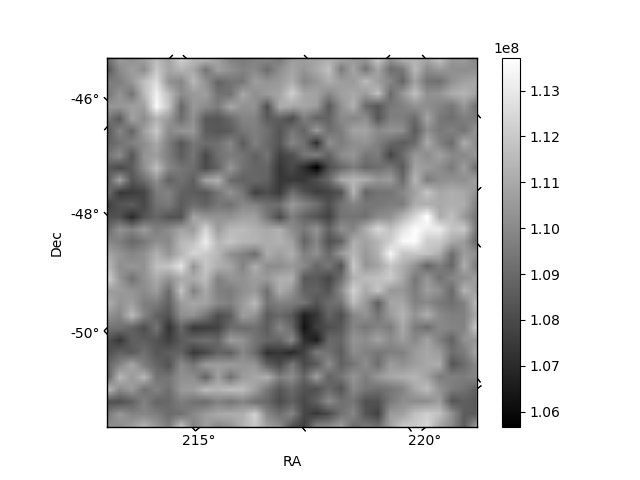
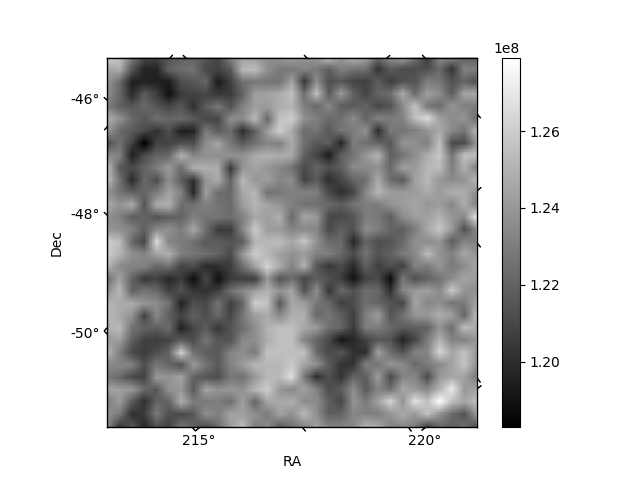
Histogram calculated using DETX and DETY for each event in the final _common_clean file
| Quadrant A |  |
 |
Quadrant B |
|---|---|---|---|
| Quadrant D |  |
 |
Quadrant C |
| Plot type | Count rate plots | Images |
|---|---|---|
| Comparison with Poisson distribution Blue bars denote a histogram of data divided into 1 sec bins. Red curve is a Poisson curve with rate = median count rate of data. |
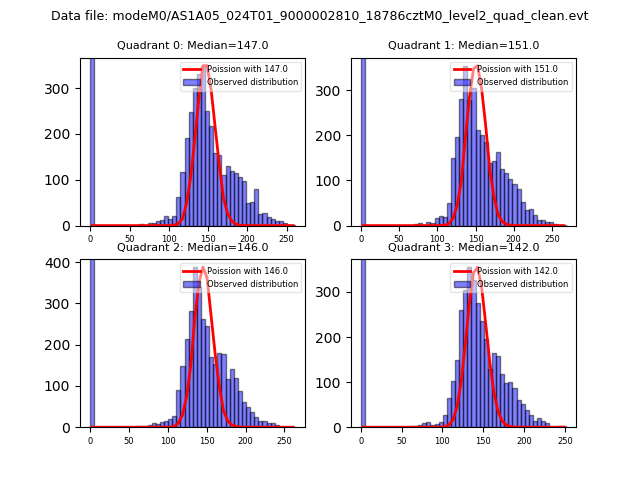 |
 |
| Quadrant-wise count rates Data is divided into 100 sec bins |
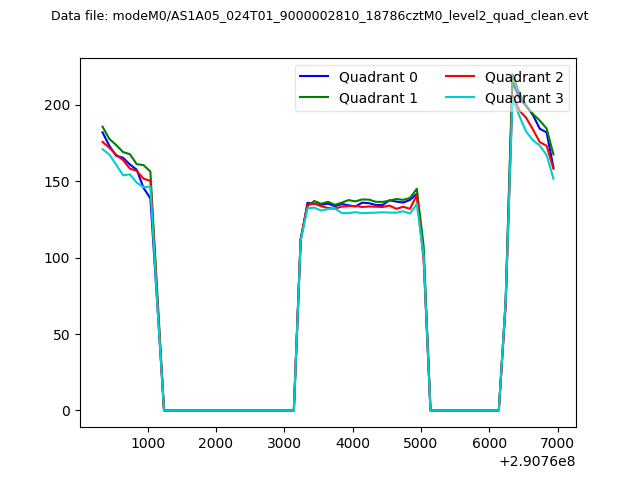 |
|
| Module-wise count rates for Quadrant A Data is divided into 100 sec bins |
 |
 |
| Module-wise count rates for Quadrant B Data is divided into 100 sec bins |
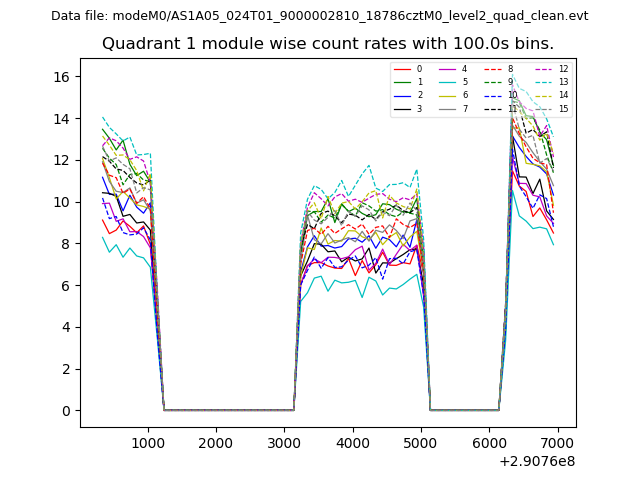 |
 |
| Module-wise count rates for Quadrant C Data is divided into 100 sec bins |
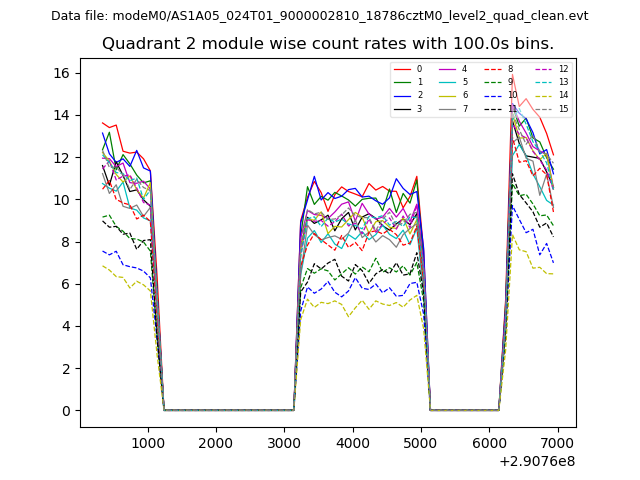 |
 |
| Module-wise count rates for Quadrant D Data is divided into 100 sec bins |
 |
 |
| Parameter | Plot |
|---|---|
| CZT HV Monitor | 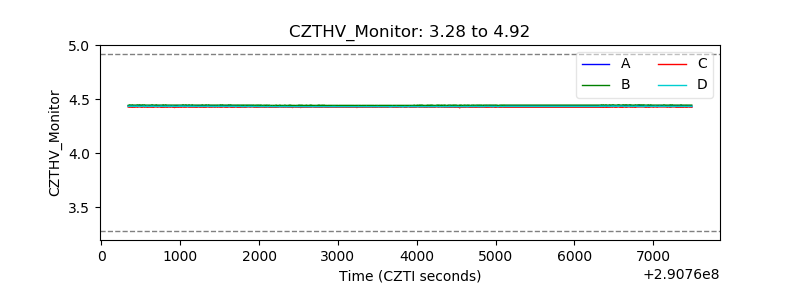 |
| D_VDD | 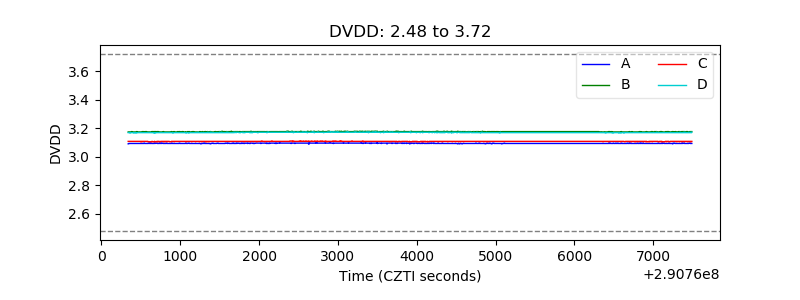 |
| Temperature 1 | 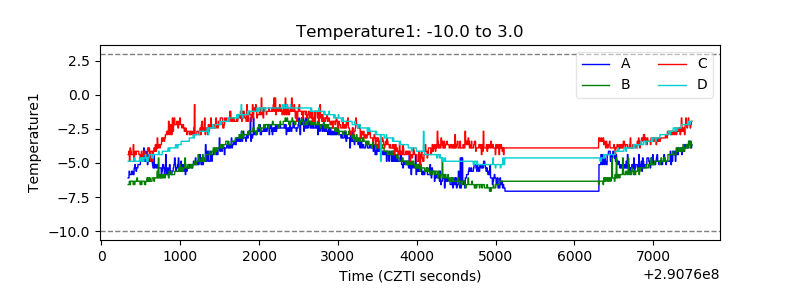 |
| Veto HV Monitor | 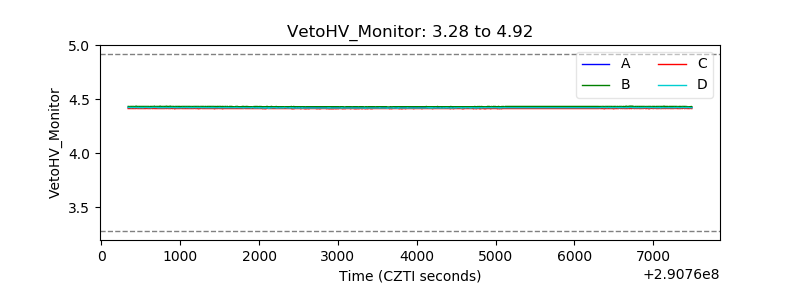 |
| Veto LLD |  |
| Alpha Counter | 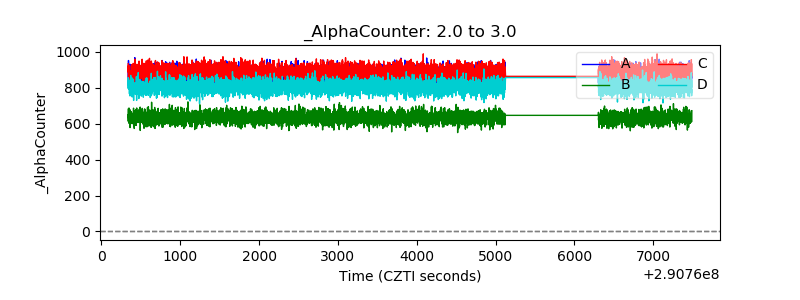 |
| _CPM_Rate | 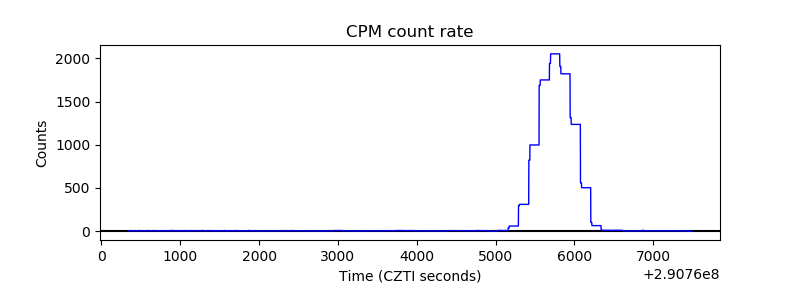 |
| CZT Counter | 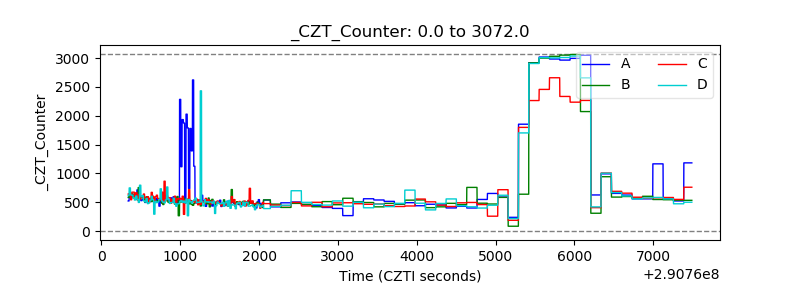 |
| +2.5 Volts monitor | 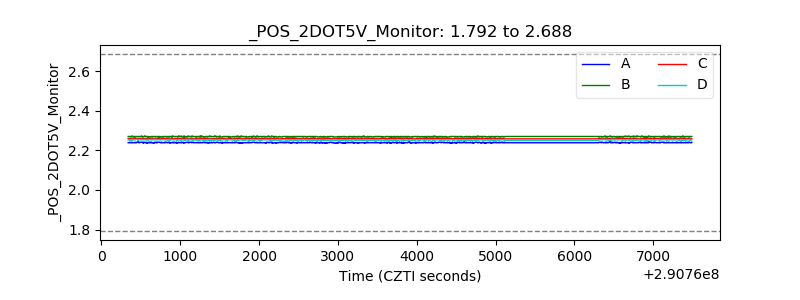 |
| +5 Volts monitor |  |
| _ROLL_ROT |  |
| _Roll_DEC | 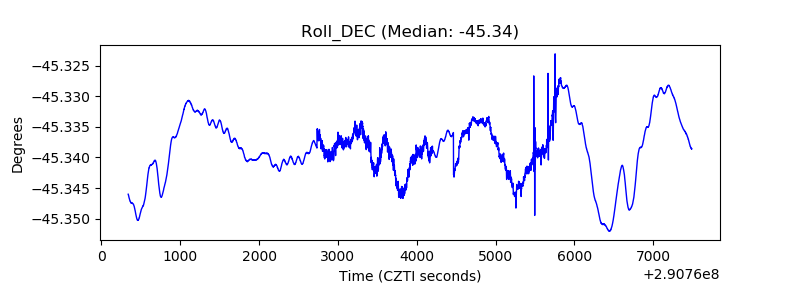 |
| _Roll_RA | 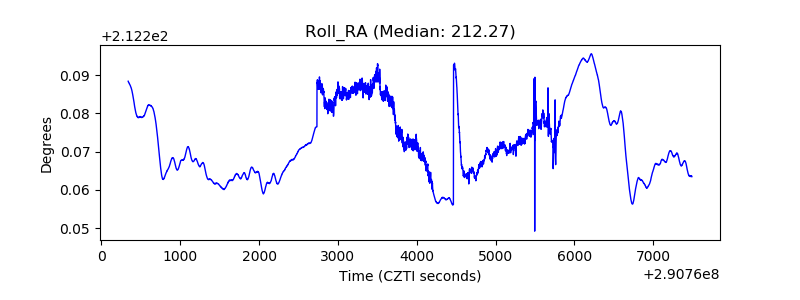 |
| Veto Counter | 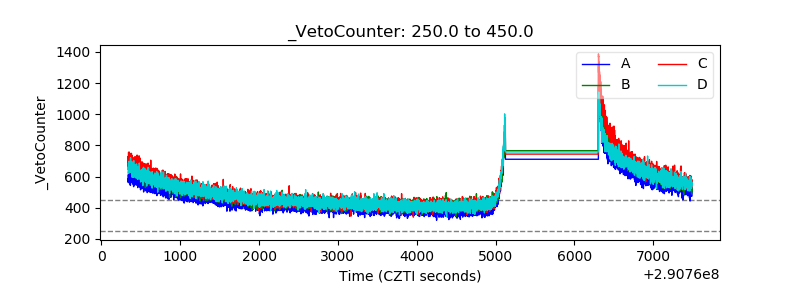 |