| Param | Original file | Final file |
|---|---|---|
| Filename | modeM0/AS1A05_024T01_9000002810_18787cztM0_level2.evt | modeM0/AS1A05_024T01_9000002810_18787cztM0_level2_quad_clean.evt |
| Size (bytes) | 438,739,200 | 74,381,760 |
| Size | 418.4 MB | 70.9 MB |
| Events in quadrant A | 3,228,687 | 468,093 |
| Events in quadrant B | 3,275,502 | 473,660 |
| Events in quadrant C | 3,212,272 | 453,143 |
| Events in quadrant D | 3,168,694 | 443,702 |
| Mode SS | |||
|---|---|---|---|
| Quadrant | BADHDUFLAG | Total packets | Discarded packets |
| A | 0 | 122 | 0 |
| B | 0 | 122 | 0 |
| C | 0 | 122 | 0 |
| D | 0 | 122 | 0 |
| Mode M9 | |||
|---|---|---|---|
| Quadrant | BADHDUFLAG | Total packets | Discarded packets |
| A | 0 | 12 | 0 |
| B | 0 | 12 | 0 |
| C | 0 | 12 | 0 |
| D | 0 | 12 | 0 |
| Mode M0 | |||
|---|---|---|---|
| Quadrant | BADHDUFLAG | Total packets | Discarded packets |
| A | 0 | 13256 | 1 |
| B | 0 | 13369 | 1 |
| C | 0 | 13207 | 1 |
| D | 0 | 12999 | 2 |
| Quadrant | Total seconds | Saturated seconds | Saturation percentage |
|---|---|---|---|
| A | 5914 | 94 | 1.589449% |
| B | 5915 | 96 | 1.622992% |
| C | 5915 | 117 | 1.978022% |
| D | 5914 | 77 | 1.301995% |
Noise dominated data is calculated using 1-second bins in cleaned event files. If a bin has >2000 counts, and if more than 50% of those come from <1% of pixels, then it is considered to be noise-dominated and hence unusable.
| Quadrant | # 1 sec bins | Bins with >0 counts | Bins with >2000 counts | High rate bins dominated by noise | Noise dominated (total time) | Noise dominated (detector-on time) | Marked lightcurve |
|---|---|---|---|---|---|---|---|
| A | 7189 | 5915 | 12 | 12 | 0.17% | 0.20% | 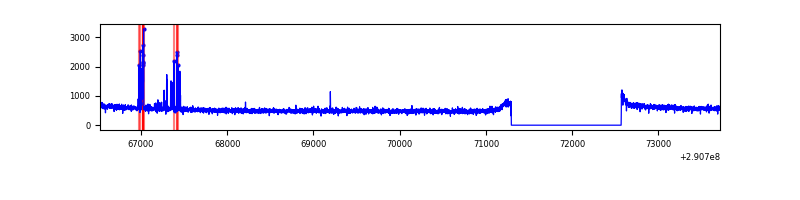 |
| B | 7190 | 5916 | 8 | 8 | 0.11% | 0.14% | 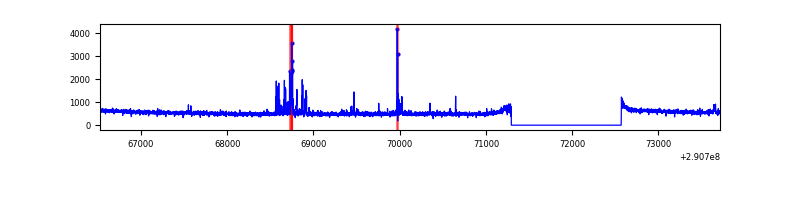 |
| C | 7190 | 5916 | 3 | 3 | 0.04% | 0.05% | 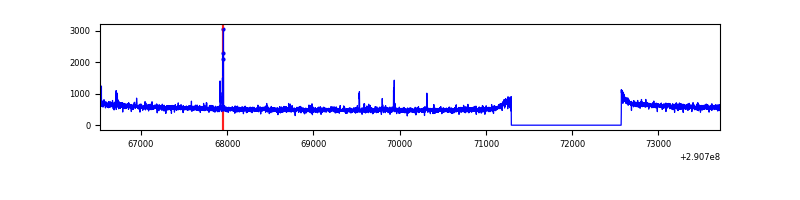 |
| D | 7189 | 5915 | 10 | 10 | 0.14% | 0.17% | 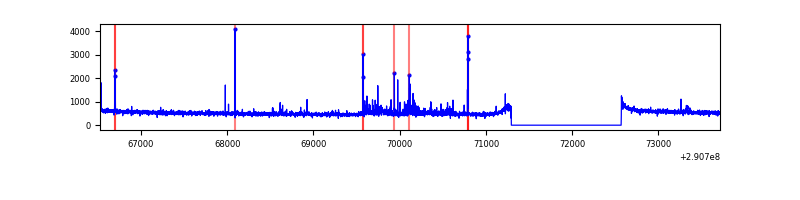 |
Top three noisy pixels from each quadrant. If the there are fewer than three noisy pixels in the level2.evt file, extra rows are filled as -1
| Pixel properties | Quadrant properties | ||||||
|---|---|---|---|---|---|---|---|
| Quadrant | DetID | PixID | Counts | Sigma | Mean | Median | Sigma |
| A | 6 | 16 | 88932 | 548.61 | 814 | 798 | 160.7 |
| A | 13 | 254 | 9317 | 53.03 | 814 | 798 | 160.7 |
| A | 0 | 226 | 7407 | 41.14 | 814 | 798 | 160.7 |
| B | 7 | 220 | 93845 | 625.7 | 803 | 785 | 148.7 |
| B | 0 | 197 | 24052 | 156.44 | 803 | 785 | 148.7 |
| B | 12 | 111 | 16724 | 107.17 | 803 | 785 | 148.7 |
| C | 14 | 238 | 123646 | 683.69 | 780 | 787 | 179.7 |
| C | 9 | 54 | 28377 | 153.53 | 780 | 787 | 179.7 |
| C | 6 | 96 | 11964 | 62.2 | 780 | 787 | 179.7 |
| D | 7 | 238 | 107058 | 555.73 | 793 | 769 | 191.3 |
| D | 7 | 96 | 32121 | 163.92 | 793 | 769 | 191.3 |
| D | 2 | 234 | 24559 | 124.38 | 793 | 769 | 191.3 |
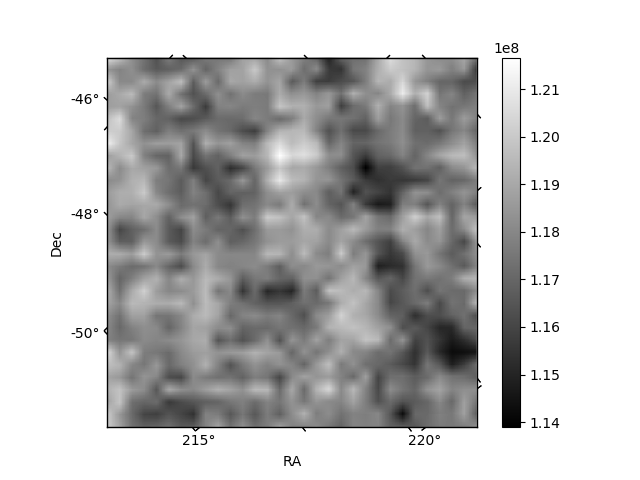
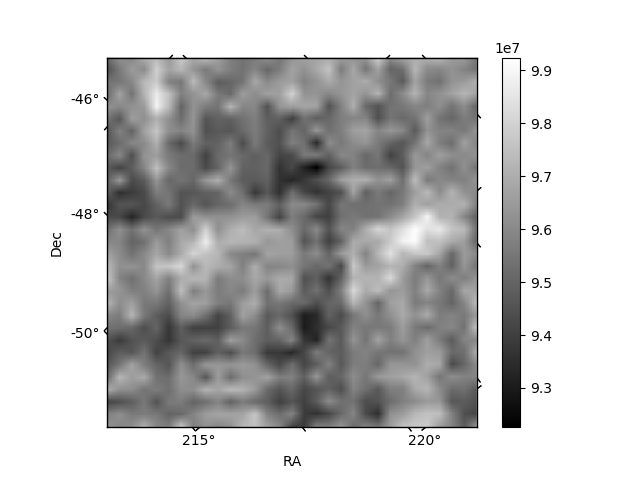
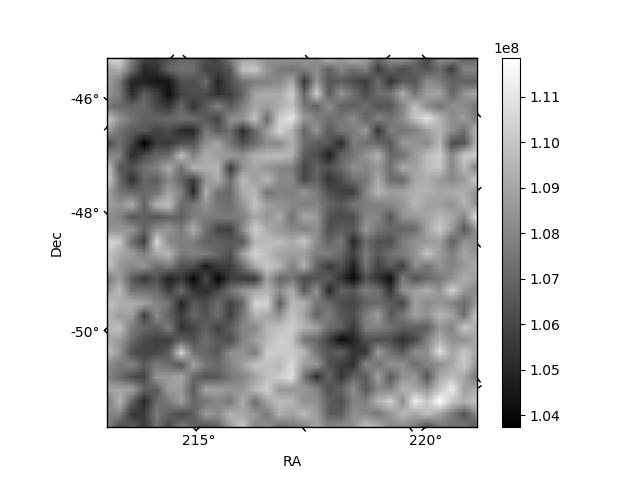
Histogram calculated using DETX and DETY for each event in the final _common_clean file
| Quadrant A | 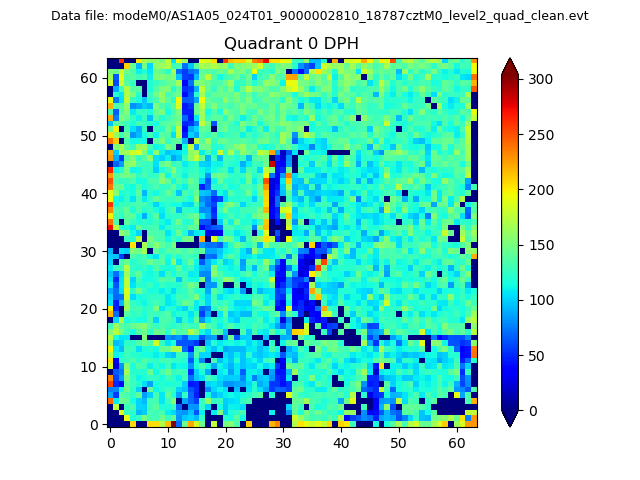 |
 |
Quadrant B |
|---|---|---|---|
| Quadrant D | 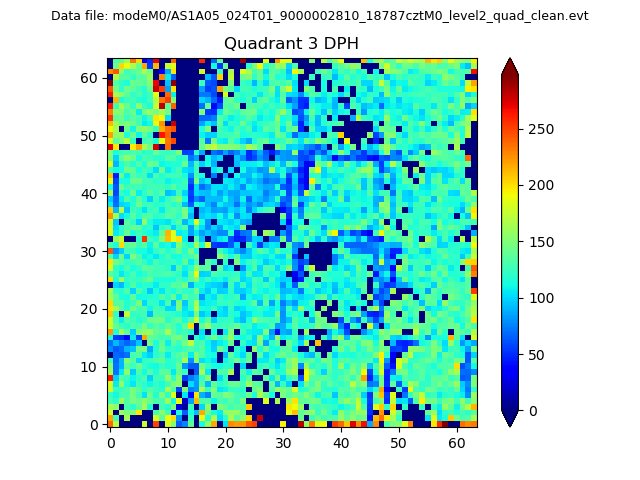 |
 |
Quadrant C |
| Plot type | Count rate plots | Images |
|---|---|---|
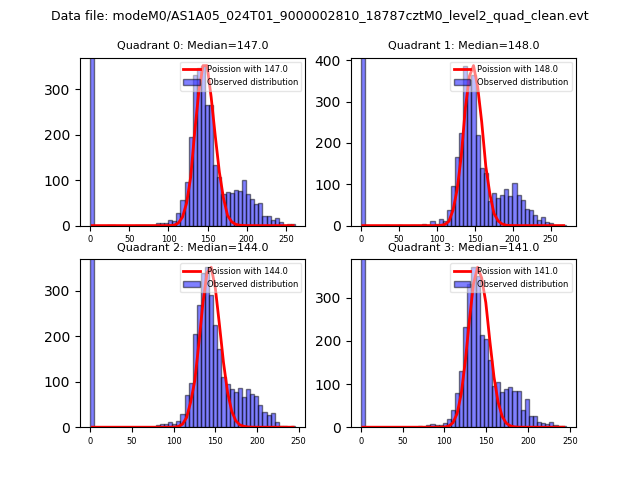
| Comparison with Poisson distribution Blue bars denote a histogram of data divided into 1 sec bins. Red curve is a Poisson curve with rate = median count rate of data. |
 |
 |
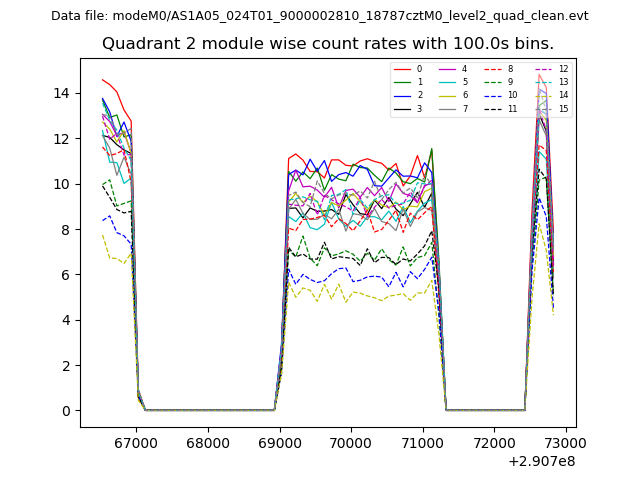
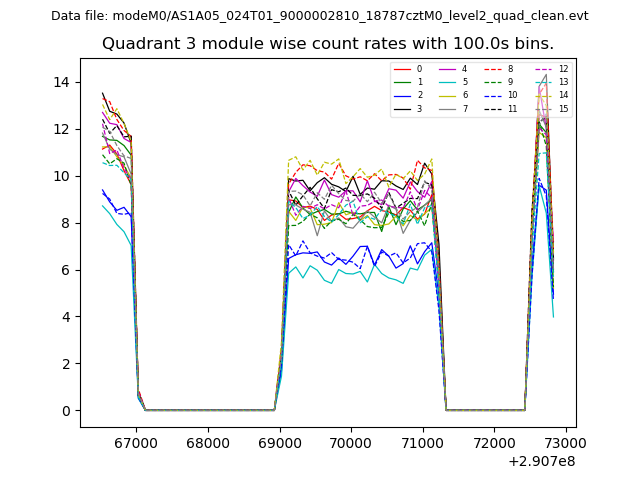
| Quadrant-wise count rates Data is divided into 100 sec bins |
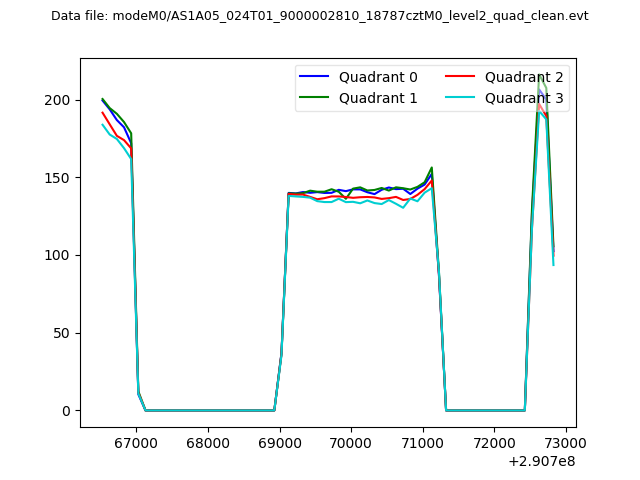 |
|
| Module-wise count rates for Quadrant A Data is divided into 100 sec bins |
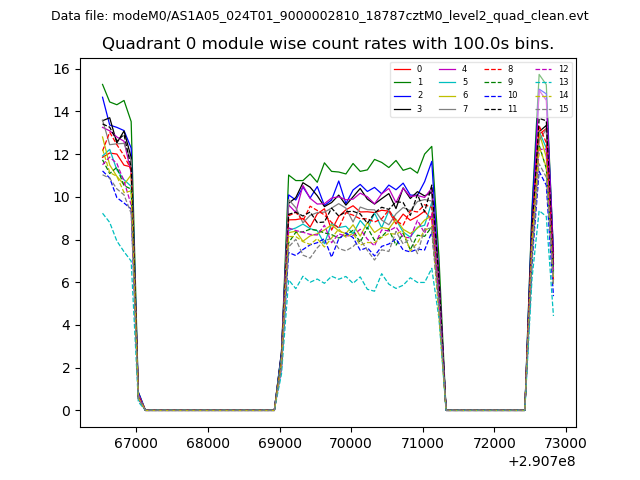 |
 |
| Module-wise count rates for Quadrant B Data is divided into 100 sec bins |
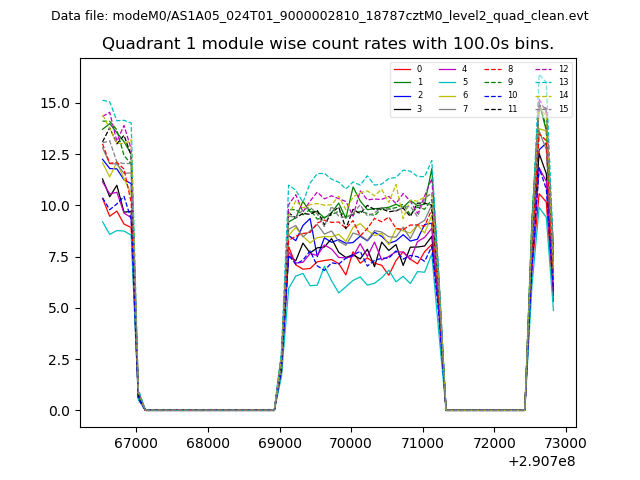 |
 |
| Module-wise count rates for Quadrant C Data is divided into 100 sec bins |
 |
 |
| Module-wise count rates for Quadrant D Data is divided into 100 sec bins |
 |
 |
| Parameter | Plot |
|---|---|
| CZT HV Monitor |  |
| D_VDD | 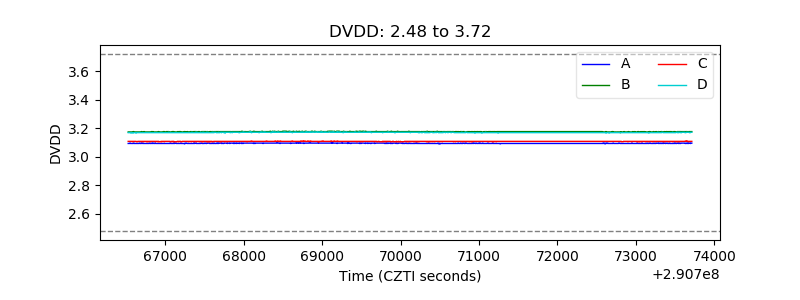 |
| Temperature 1 | 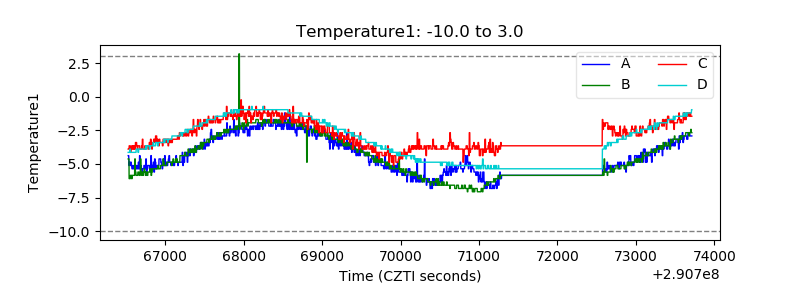 |
| Veto HV Monitor | 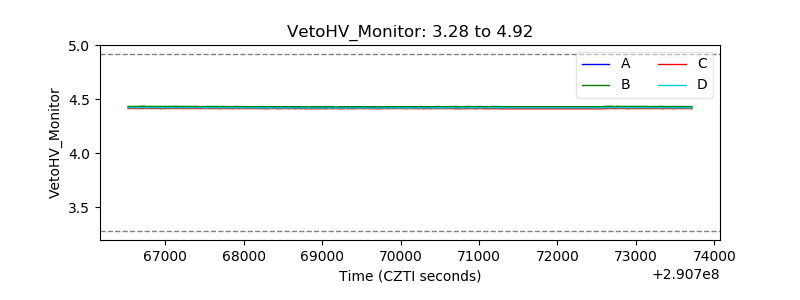 |
| Veto LLD | 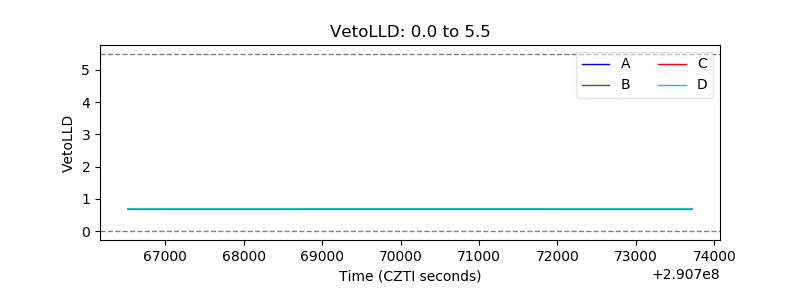 |
| Alpha Counter | 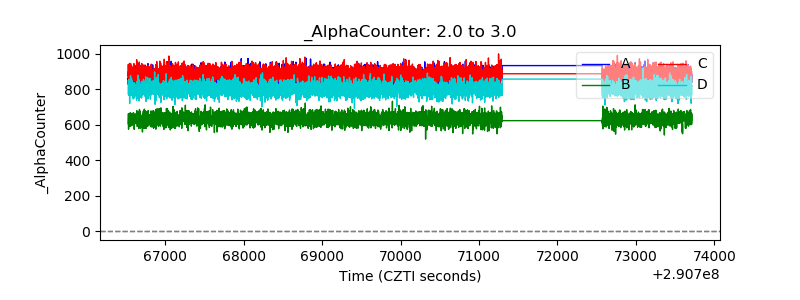 |
| _CPM_Rate | 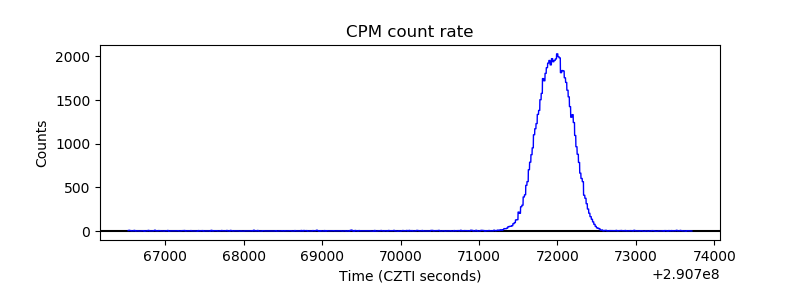 |
| CZT Counter |  |
| +2.5 Volts monitor |  |
| +5 Volts monitor | 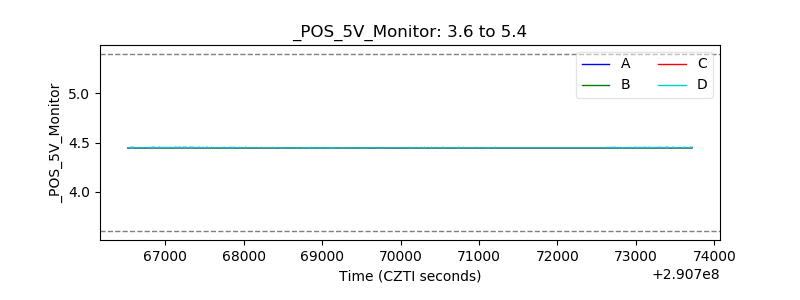 |
| _ROLL_ROT | 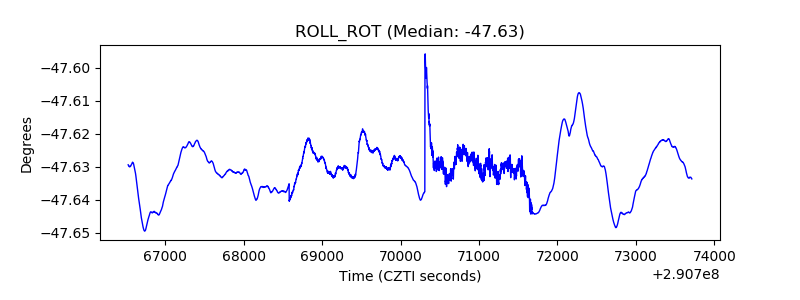 |
| _Roll_DEC | 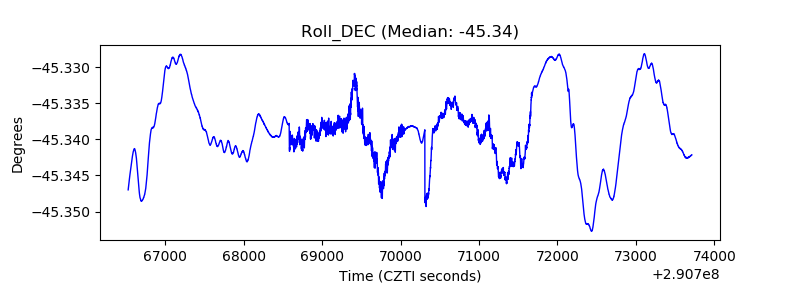 |
| _Roll_RA | 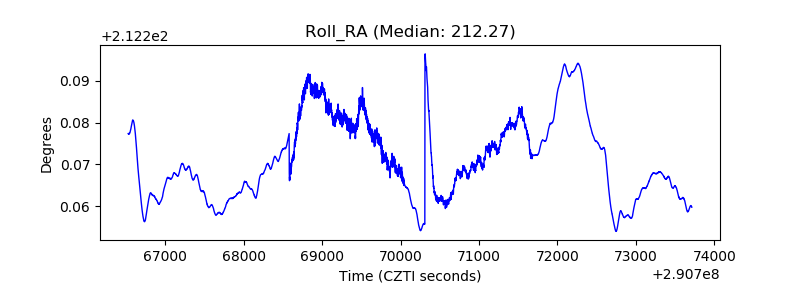 |
| Veto Counter | 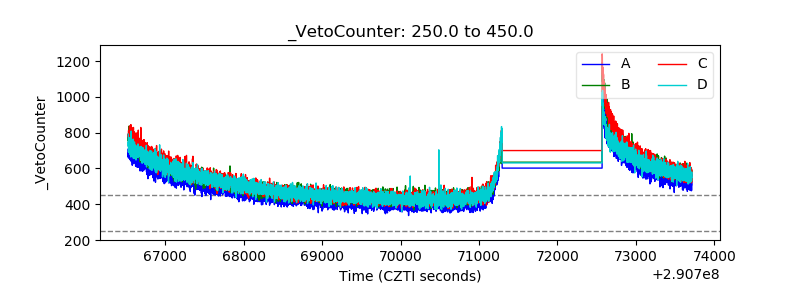 |