| Param | Original file | Final file |
|---|---|---|
| Filename | modeM0/AS1A05_024T01_9000002810_18788cztM0_level2.evt | modeM0/AS1A05_024T01_9000002810_18788cztM0_level2_quad_clean.evt |
| Size (bytes) | 493,738,560 | 71,579,520 |
| Size | 470.9 MB | 68.3 MB |
| Events in quadrant A | 3,570,122 | 434,481 |
| Events in quadrant B | 3,803,085 | 439,413 |
| Events in quadrant C | 3,675,508 | 419,944 |
| Events in quadrant D | 3,458,315 | 415,545 |
| Mode SS | |||
|---|---|---|---|
| Quadrant | BADHDUFLAG | Total packets | Discarded packets |
| A | 0 | 134 | 0 |
| B | 0 | 134 | 0 |
| C | 0 | 134 | 0 |
| D | 0 | 134 | 0 |
| Mode M9 | |||
|---|---|---|---|
| Quadrant | BADHDUFLAG | Total packets | Discarded packets |
| A | 0 | 17 | 0 |
| B | 0 | 18 | 0 |
| C | 0 | 18 | 0 |
| D | 0 | 18 | 0 |
| Mode M0 | |||
|---|---|---|---|
| Quadrant | BADHDUFLAG | Total packets | Discarded packets |
| A | 0 | 14601 | 2 |
| B | 0 | 15303 | 2 |
| C | 0 | 15077 | 2 |
| D | 0 | 14383 | 2 |
| Quadrant | Total seconds | Saturated seconds | Saturation percentage |
|---|---|---|---|
| A | 6565 | 139 | 2.117289% |
| B | 6565 | 173 | 2.635187% |
| C | 6565 | 154 | 2.345773% |
| D | 6565 | 110 | 1.675552% |
Noise dominated data is calculated using 1-second bins in cleaned event files. If a bin has >2000 counts, and if more than 50% of those come from <1% of pixels, then it is considered to be noise-dominated and hence unusable.
| Quadrant | # 1 sec bins | Bins with >0 counts | Bins with >2000 counts | High rate bins dominated by noise | Noise dominated (total time) | Noise dominated (detector-on time) | Marked lightcurve |
|---|---|---|---|---|---|---|---|
| A | 7860 | 6566 | 11 | 11 | 0.14% | 0.17% | 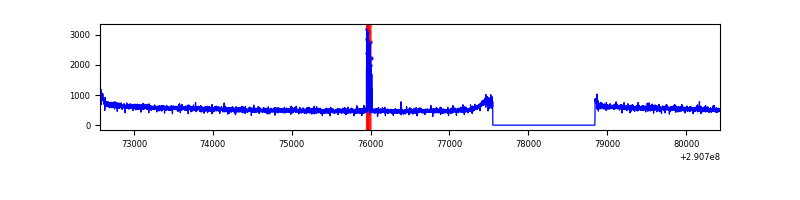 |
| B | 7860 | 6566 | 32 | 32 | 0.41% | 0.49% | 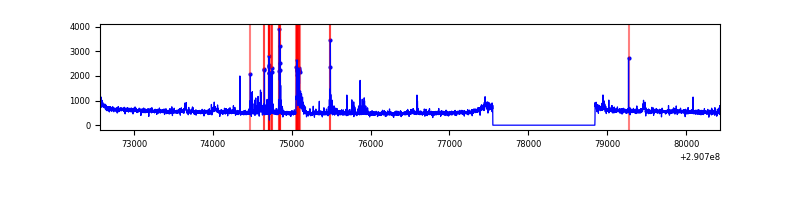 |
| C | 7860 | 6566 | 0 | 0 | 0.00% | 0.00% |  |
| D | 7860 | 6566 | 10 | 10 | 0.13% | 0.15% | 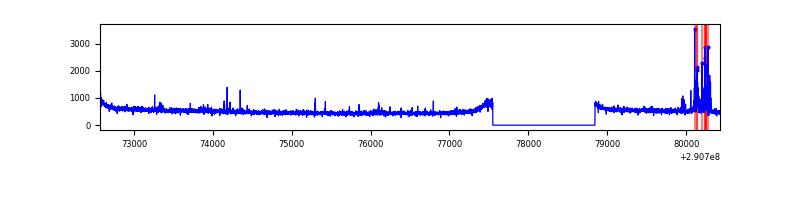 |
Top three noisy pixels from each quadrant. If the there are fewer than three noisy pixels in the level2.evt file, extra rows are filled as -1
| Pixel properties | Quadrant properties | ||||||
|---|---|---|---|---|---|---|---|
| Quadrant | DetID | PixID | Counts | Sigma | Mean | Median | Sigma |
| A | 6 | 16 | 56016 | 306.24 | 910 | 892 | 180.0 |
| A | 13 | 254 | 11294 | 57.79 | 910 | 892 | 180.0 |
| A | 0 | 226 | 8327 | 41.31 | 910 | 892 | 180.0 |
| B | 7 | 220 | 101908 | 608.24 | 897 | 877 | 166.1 |
| B | 12 | 18 | 56683 | 335.97 | 897 | 877 | 166.1 |
| B | 0 | 197 | 39462 | 232.29 | 897 | 877 | 166.1 |
| C | 3 | 233 | 150636 | 757.11 | 866 | 873 | 197.8 |
| C | 14 | 238 | 137953 | 693.0 | 866 | 873 | 197.8 |
| C | 9 | 54 | 11829 | 55.39 | 866 | 873 | 197.8 |
| D | 1 | 52 | 98589 | 459.58 | 883 | 859 | 212.7 |
| D | 2 | 234 | 28568 | 130.3 | 883 | 859 | 212.7 |
| D | 7 | 96 | 16159 | 71.95 | 883 | 859 | 212.7 |
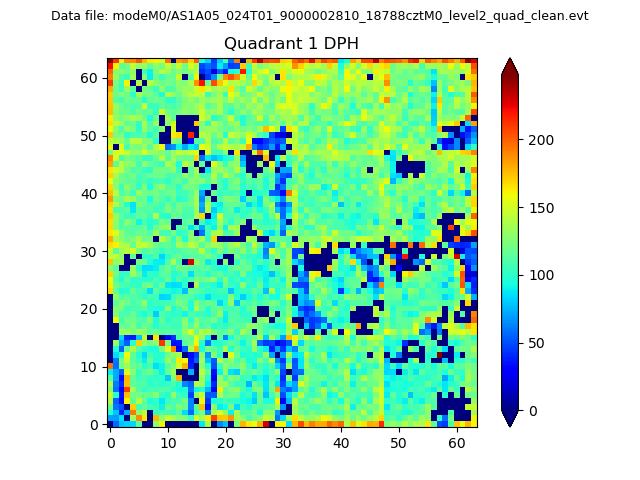
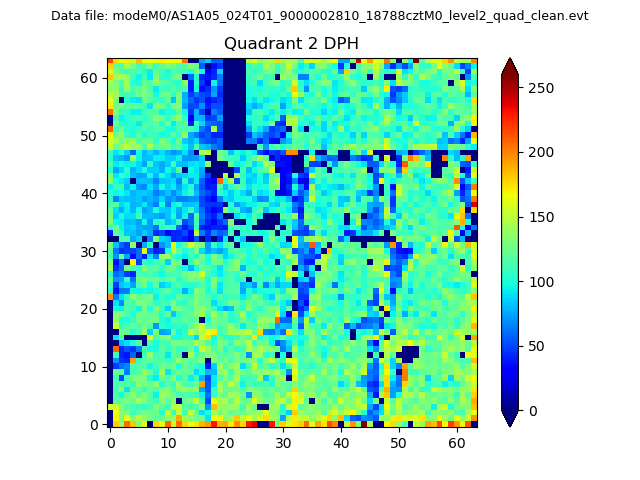
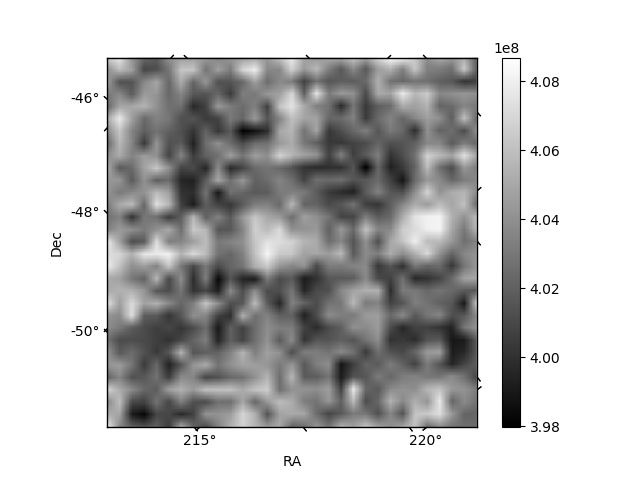
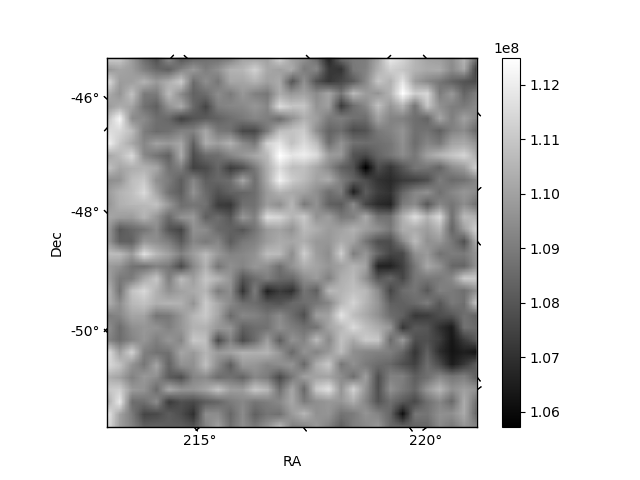
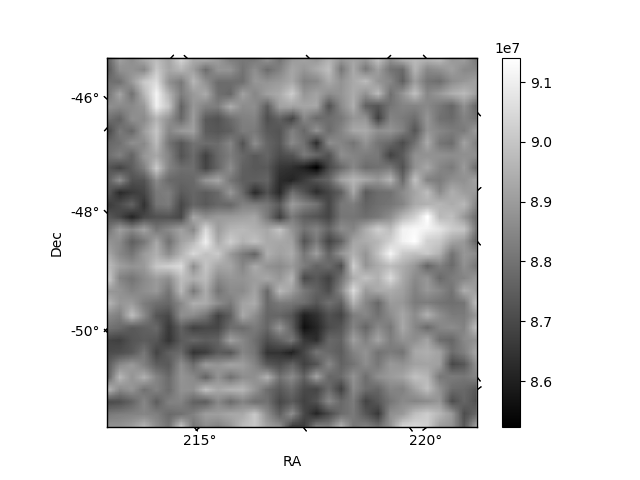
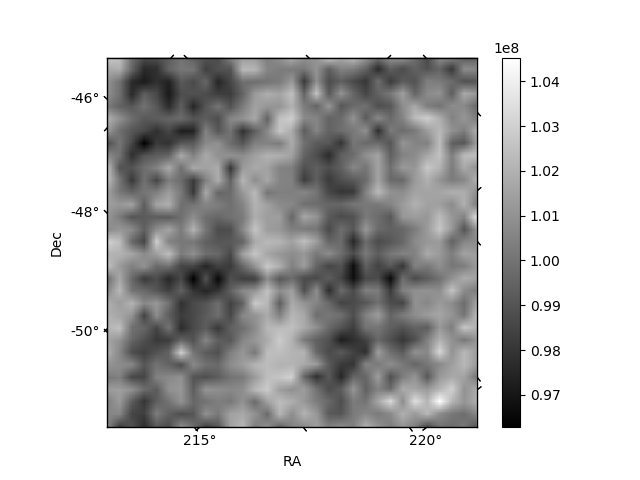
Histogram calculated using DETX and DETY for each event in the final _common_clean file
| Quadrant A | 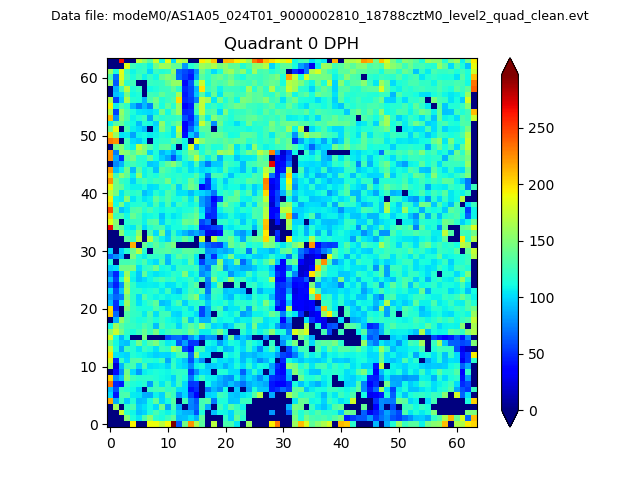 |
 |
Quadrant B |
|---|---|---|---|
| Quadrant D | 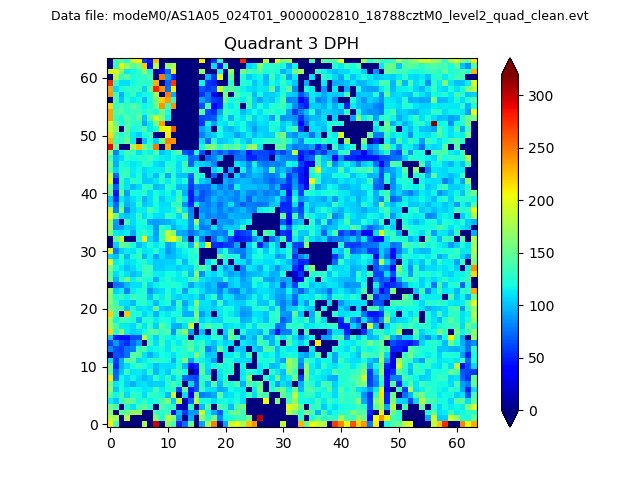 |
 |
Quadrant C |
| Plot type | Count rate plots | Images |
|---|---|---|
| Comparison with Poisson distribution Blue bars denote a histogram of data divided into 1 sec bins. Red curve is a Poisson curve with rate = median count rate of data. |
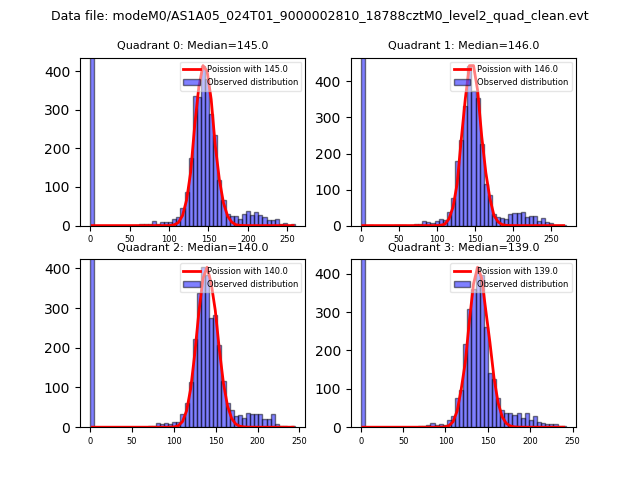 |
 |
| Quadrant-wise count rates Data is divided into 100 sec bins |
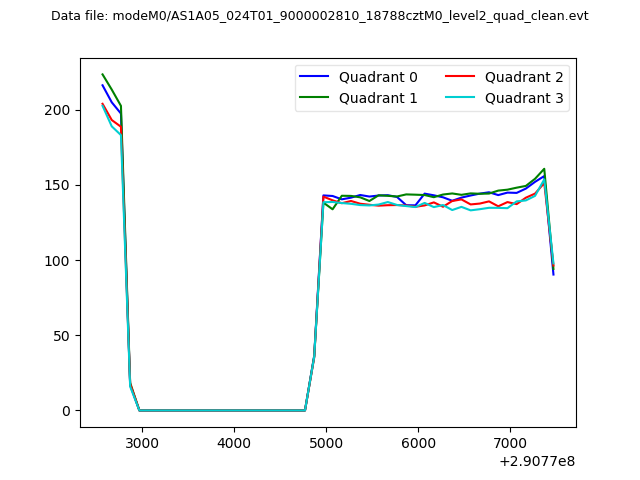 |
|
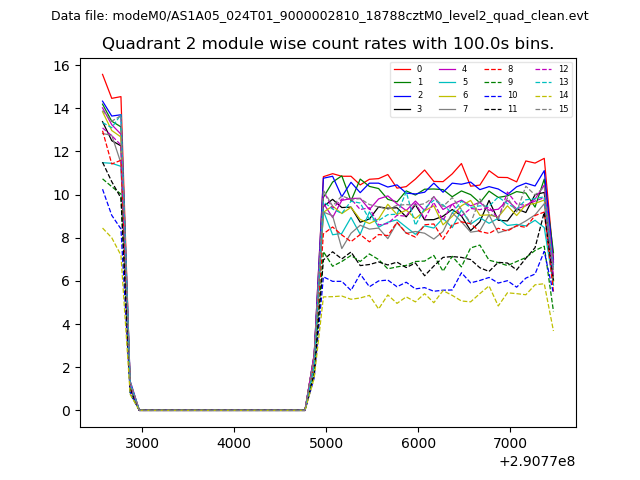
| Module-wise count rates for Quadrant A Data is divided into 100 sec bins |
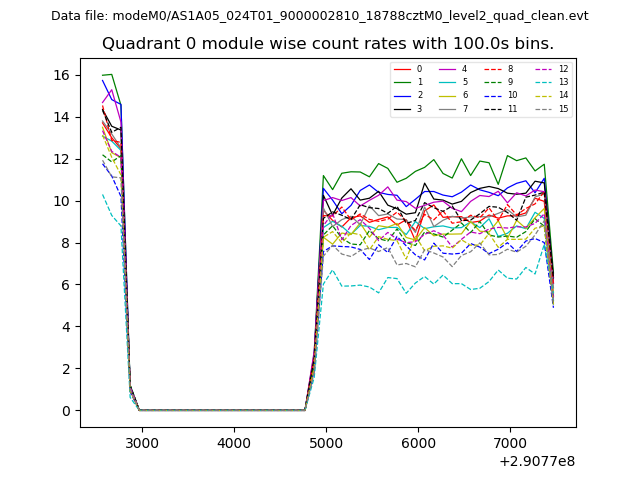 |
 |
| Module-wise count rates for Quadrant B Data is divided into 100 sec bins |
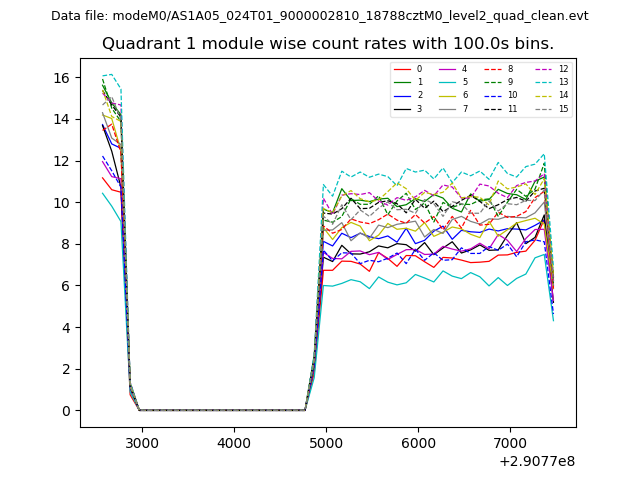 |
 |
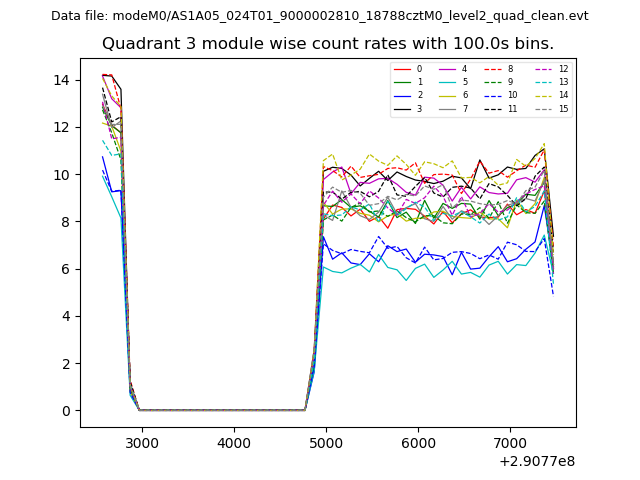
| Module-wise count rates for Quadrant C Data is divided into 100 sec bins |
 |
 |
| Module-wise count rates for Quadrant D Data is divided into 100 sec bins |
 |
 |
| Parameter | Plot |
|---|---|
| CZT HV Monitor | 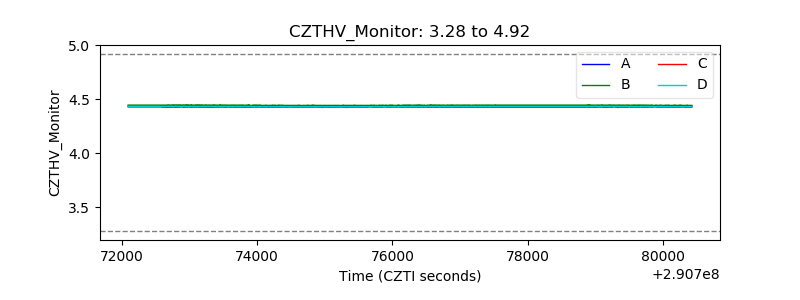 |
| D_VDD | 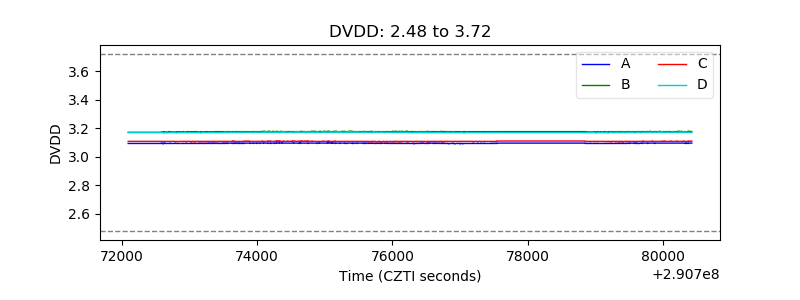 |
| Temperature 1 |  |
| Veto HV Monitor |  |
| Veto LLD | 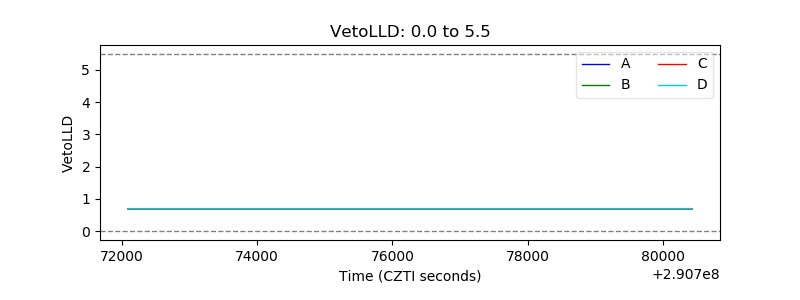 |
| Alpha Counter | 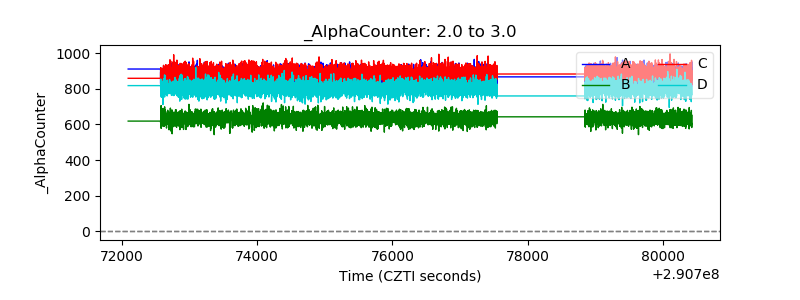 |
| _CPM_Rate | 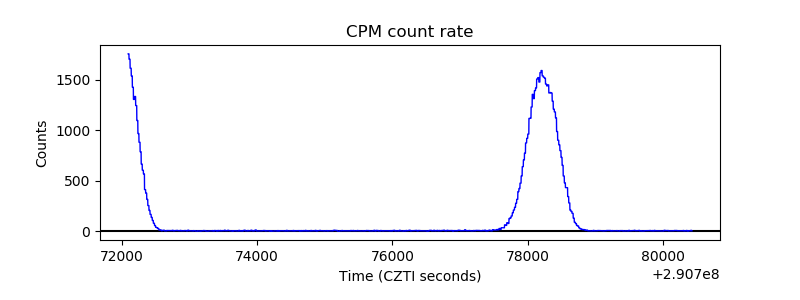 |
| CZT Counter | 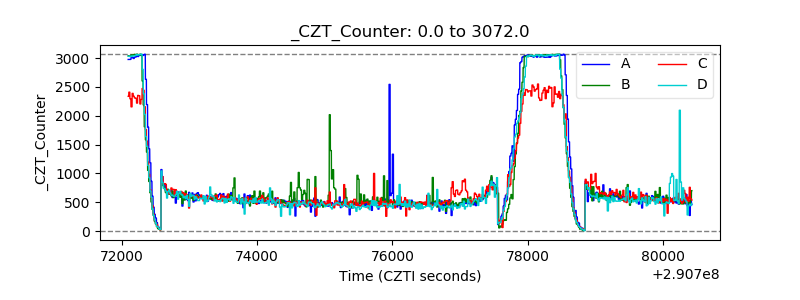 |
| +2.5 Volts monitor |  |
| +5 Volts monitor |  |
| _ROLL_ROT | 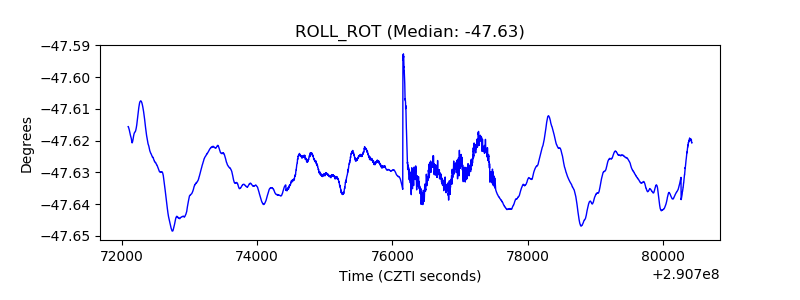 |
| _Roll_DEC | 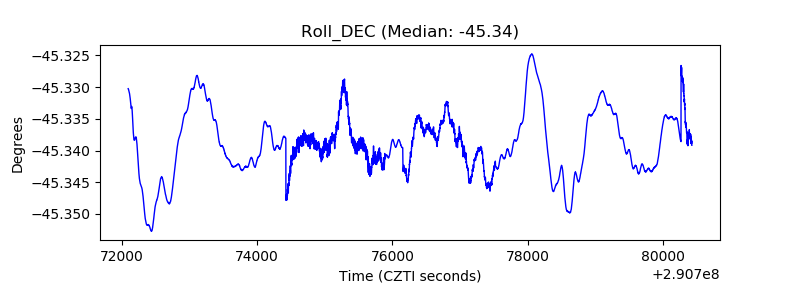 |
| _Roll_RA | 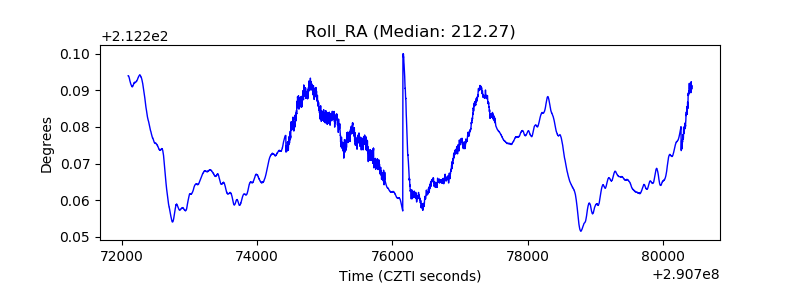 |
| Veto Counter | 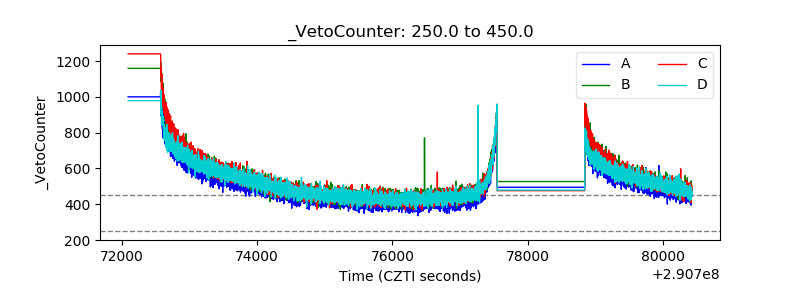 |