| Param | Original file | Final file |
|---|---|---|
| Filename | modeM0/AS1A05_024T01_9000002810_18789cztM0_level2.evt | modeM0/AS1A05_024T01_9000002810_18789cztM0_level2_quad_clean.evt |
| Size (bytes) | 500,970,240 | 74,191,680 |
| Size | 477.8 MB | 70.8 MB |
| Events in quadrant A | 3,523,128 | 452,300 |
| Events in quadrant B | 3,689,434 | 455,536 |
| Events in quadrant C | 3,587,887 | 438,590 |
| Events in quadrant D | 3,914,419 | 430,897 |
| Mode SS | |||
|---|---|---|---|
| Quadrant | BADHDUFLAG | Total packets | Discarded packets |
| A | 0 | 138 | 0 |
| B | 0 | 138 | 0 |
| C | 0 | 138 | 0 |
| D | 0 | 138 | 0 |
| Mode M9 | |||
|---|---|---|---|
| Quadrant | BADHDUFLAG | Total packets | Discarded packets |
| A | 0 | 12 | 0 |
| B | 0 | 13 | 0 |
| C | 0 | 13 | 0 |
| D | 0 | 13 | 0 |
| Mode M0 | |||
|---|---|---|---|
| Quadrant | BADHDUFLAG | Total packets | Discarded packets |
| A | 0 | 14538 | 2 |
| B | 0 | 14994 | 2 |
| C | 0 | 14834 | 2 |
| D | 0 | 15919 | 2 |
| Quadrant | Total seconds | Saturated seconds | Saturation percentage |
|---|---|---|---|
| A | 6726 | 158 | 2.349093% |
| B | 6726 | 158 | 2.349093% |
| C | 6726 | 178 | 2.646447% |
| D | 6726 | 239 | 3.553375% |
Noise dominated data is calculated using 1-second bins in cleaned event files. If a bin has >2000 counts, and if more than 50% of those come from <1% of pixels, then it is considered to be noise-dominated and hence unusable.
| Quadrant | # 1 sec bins | Bins with >0 counts | Bins with >2000 counts | High rate bins dominated by noise | Noise dominated (total time) | Noise dominated (detector-on time) | Marked lightcurve |
|---|---|---|---|---|---|---|---|
| A | 7901 | 6727 | 10 | 10 | 0.13% | 0.15% | 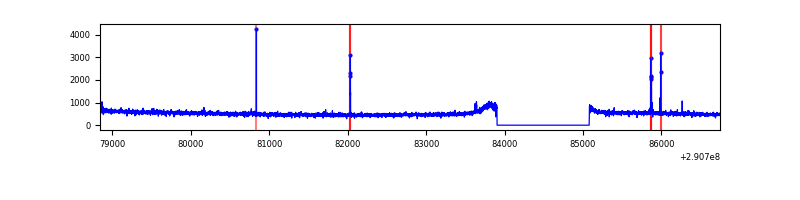 |
| B | 7901 | 6727 | 4 | 4 | 0.05% | 0.06% | 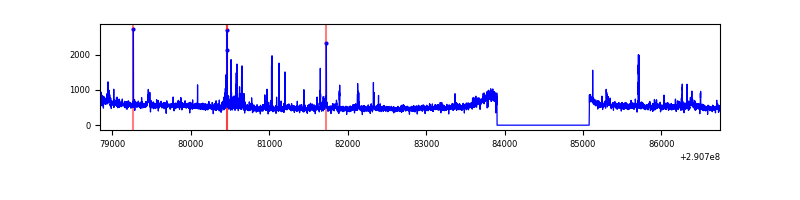 |
| C | 7901 | 6727 | 0 | 0 | 0.00% | 0.00% |  |
| D | 7901 | 6727 | 70 | 70 | 0.89% | 1.04% | 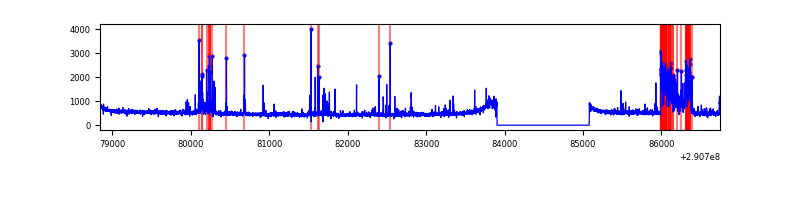 |
Top three noisy pixels from each quadrant. If the there are fewer than three noisy pixels in the level2.evt file, extra rows are filled as -1
| Pixel properties | Quadrant properties | ||||||
|---|---|---|---|---|---|---|---|
| Quadrant | DetID | PixID | Counts | Sigma | Mean | Median | Sigma |
| A | 12 | 96 | 30126 | 163.67 | 900 | 885 | 178.7 |
| A | 13 | 254 | 10905 | 56.08 | 900 | 885 | 178.7 |
| A | 6 | 16 | 10861 | 55.84 | 900 | 885 | 178.7 |
| B | 7 | 220 | 52510 | 309.82 | 891 | 869 | 166.7 |
| B | 0 | 229 | 39319 | 230.68 | 891 | 869 | 166.7 |
| B | 4 | 216 | 25178 | 145.84 | 891 | 869 | 166.7 |
| C | 14 | 238 | 136006 | 683.76 | 855 | 860 | 197.6 |
| C | 3 | 233 | 113258 | 568.67 | 855 | 860 | 197.6 |
| C | 9 | 54 | 6537 | 28.72 | 855 | 860 | 197.6 |
| D | 1 | 52 | 596598 | 2838.63 | 869 | 844 | 209.9 |
| D | 2 | 234 | 28018 | 129.48 | 869 | 844 | 209.9 |
| D | 5 | 222 | 15933 | 71.9 | 869 | 844 | 209.9 |
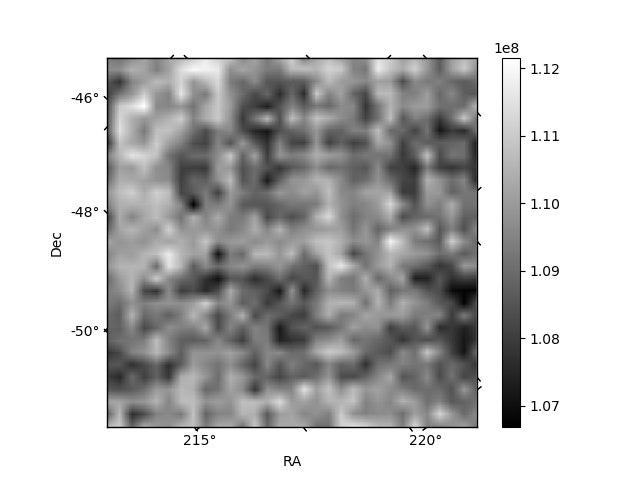
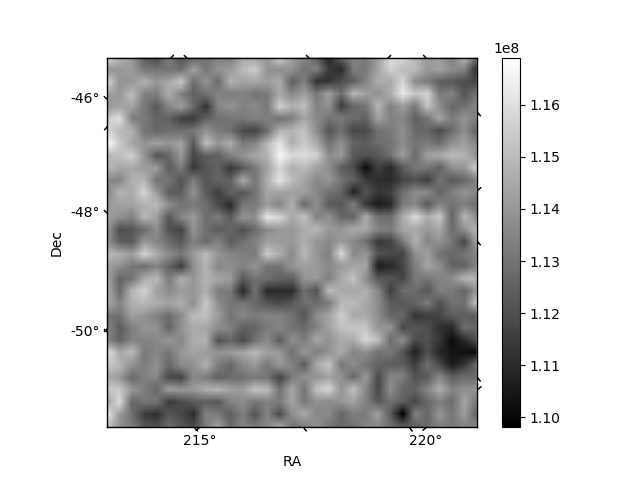
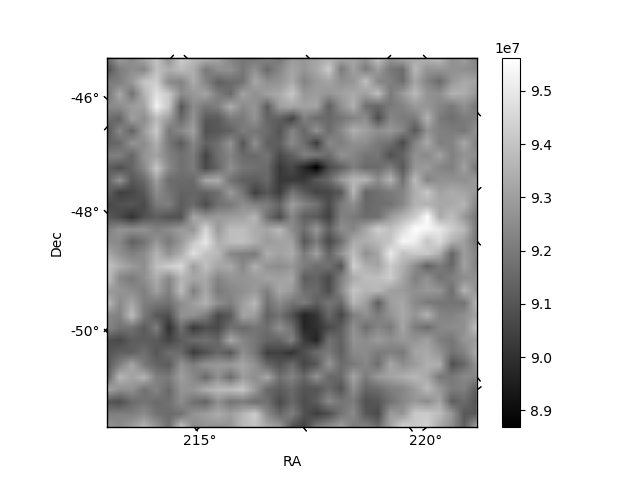
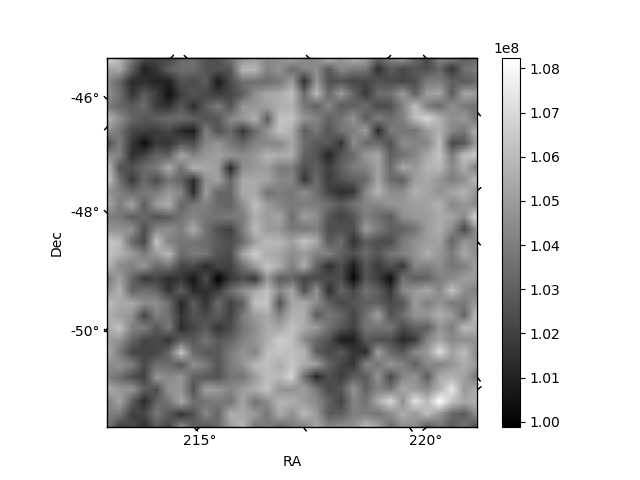
Histogram calculated using DETX and DETY for each event in the final _common_clean file
| Quadrant A | 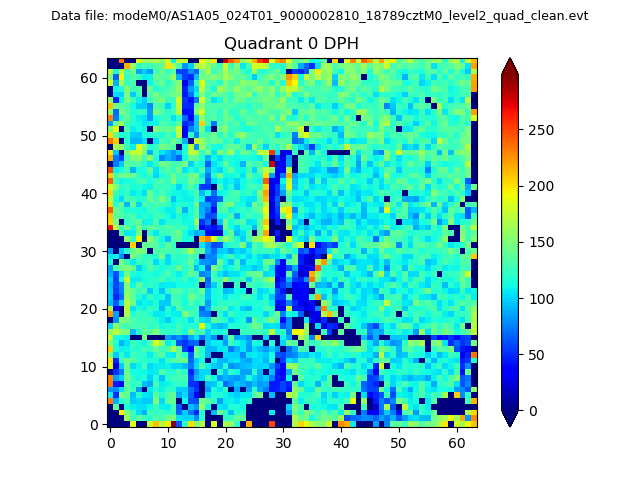 |
 |
Quadrant B |
|---|---|---|---|
| Quadrant D |  |
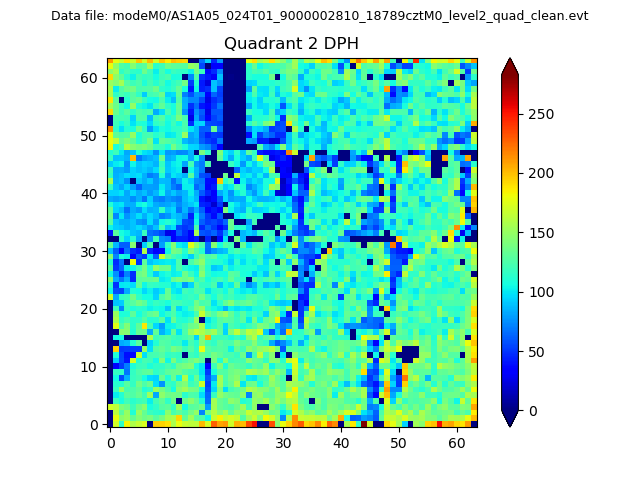 |
Quadrant C |
| Plot type | Count rate plots | Images |
|---|---|---|
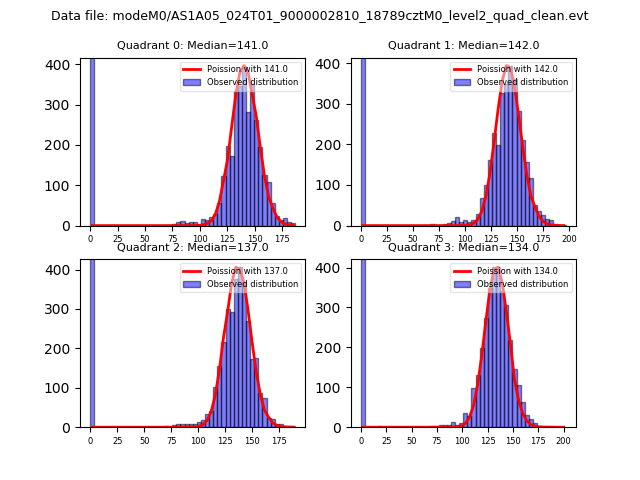
| Comparison with Poisson distribution Blue bars denote a histogram of data divided into 1 sec bins. Red curve is a Poisson curve with rate = median count rate of data. |
 |
 |
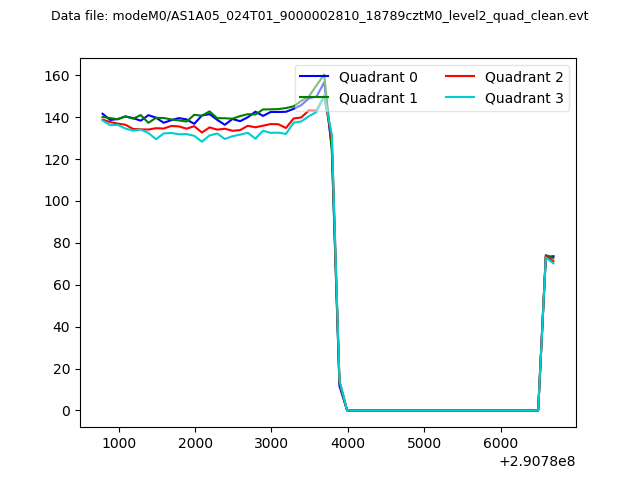
| Quadrant-wise count rates Data is divided into 100 sec bins |
 |
|
| Module-wise count rates for Quadrant A Data is divided into 100 sec bins |
 |
 |
| Module-wise count rates for Quadrant B Data is divided into 100 sec bins |
 |
 |
| Module-wise count rates for Quadrant C Data is divided into 100 sec bins |
 |
 |
| Module-wise count rates for Quadrant D Data is divided into 100 sec bins |
 |
 |
| Parameter | Plot |
|---|---|
| CZT HV Monitor |  |
| D_VDD | 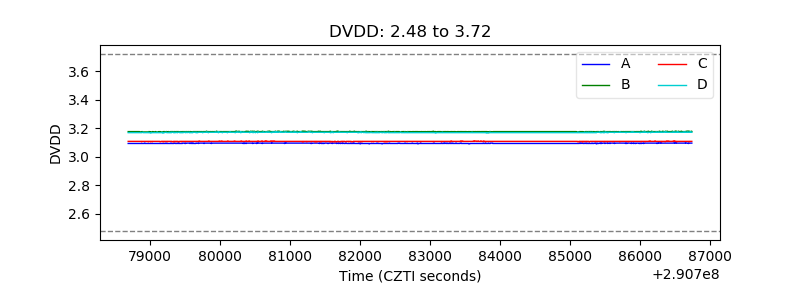 |
| Temperature 1 | 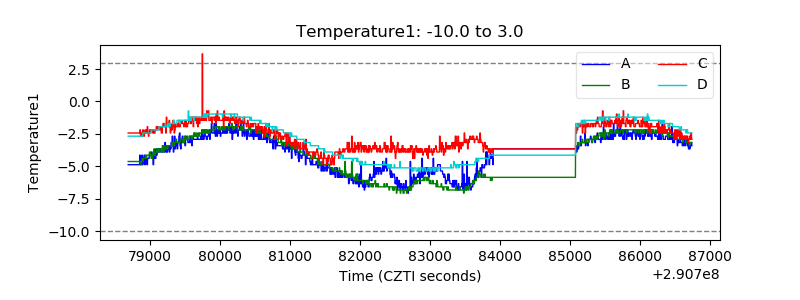 |
| Veto HV Monitor | 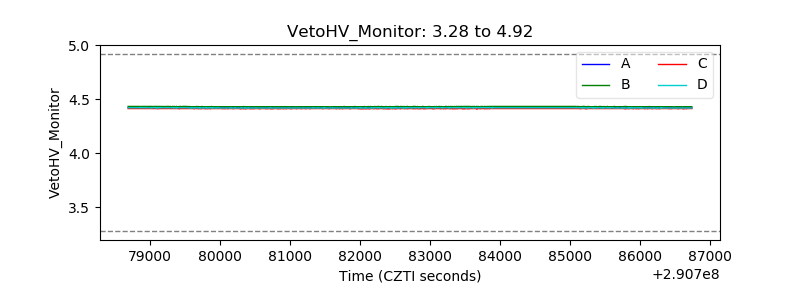 |
| Veto LLD | 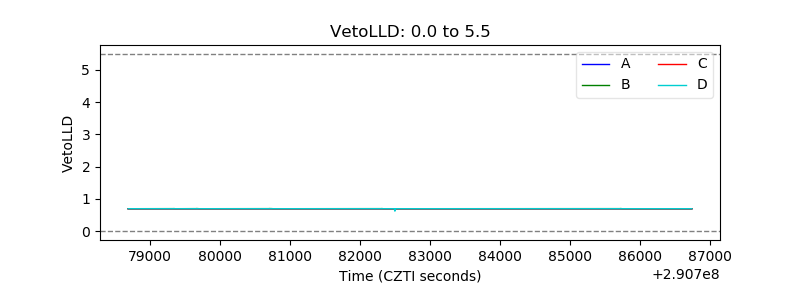 |
| Alpha Counter | 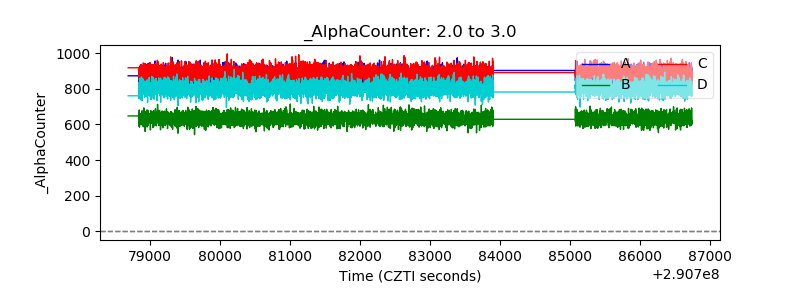 |
| _CPM_Rate | 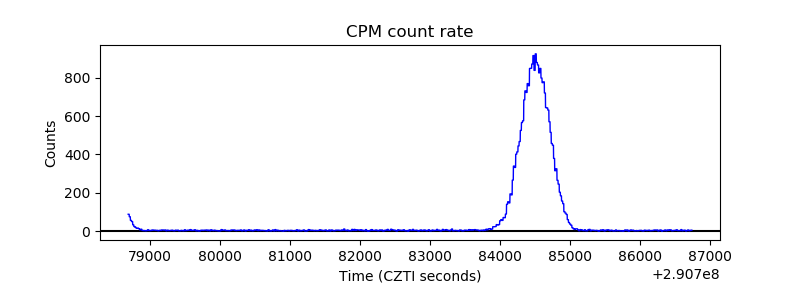 |
| CZT Counter | 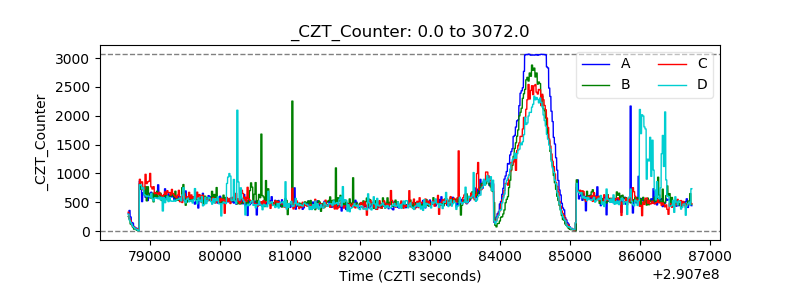 |
| +2.5 Volts monitor |  |
| +5 Volts monitor | 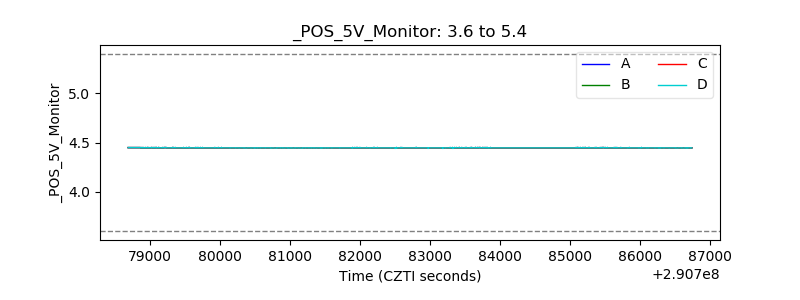 |
| _ROLL_ROT | 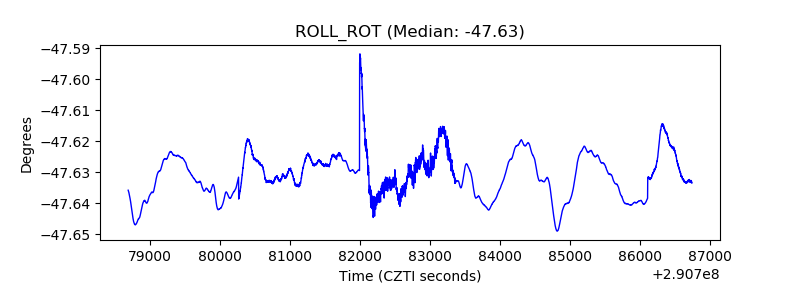 |
| _Roll_DEC | 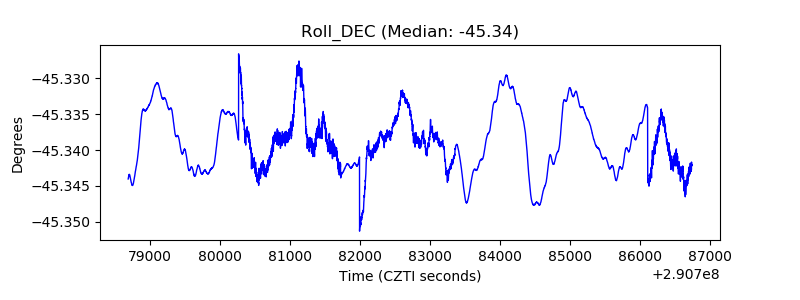 |
| _Roll_RA | 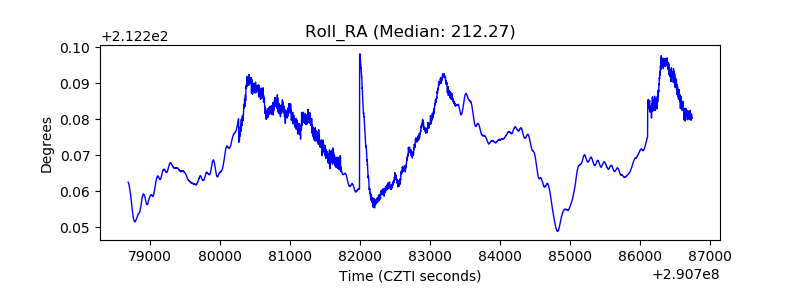 |
| Veto Counter | 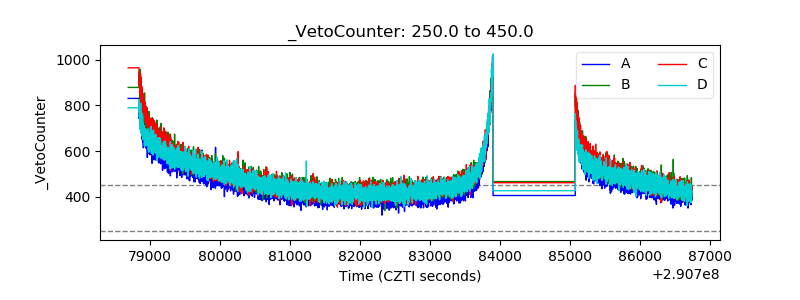 |