| Param | Original file | Final file |
|---|---|---|
| Filename | modeM0/AS1A05_024T01_9000002810_18790cztM0_level2.evt | modeM0/AS1A05_024T01_9000002810_18790cztM0_level2_quad_clean.evt |
| Size (bytes) | 547,107,840 | 86,774,400 |
| Size | 521.8 MB | 82.8 MB |
| Events in quadrant A | 3,403,442 | 551,715 |
| Events in quadrant B | 3,568,270 | 560,234 |
| Events in quadrant C | 3,375,278 | 536,399 |
| Events in quadrant D | 5,758,807 | 502,913 |
| Mode SS | |||
|---|---|---|---|
| Quadrant | BADHDUFLAG | Total packets | Discarded packets |
| A | 0 | 138 | 0 |
| B | 0 | 138 | 0 |
| C | 0 | 138 | 0 |
| D | 0 | 138 | 0 |
| Mode M9 | |||
|---|---|---|---|
| Quadrant | BADHDUFLAG | Total packets | Discarded packets |
| A | 0 | 18 | 0 |
| B | 0 | 19 | 0 |
| C | 0 | 19 | 0 |
| D | 0 | 19 | 0 |
| Mode M0 | |||
|---|---|---|---|
| Quadrant | BADHDUFLAG | Total packets | Discarded packets |
| A | 0 | 14352 | 2 |
| B | 0 | 14802 | 2 |
| C | 0 | 14241 | 2 |
| D | 0 | 21771 | 2 |
| Quadrant | Total seconds | Saturated seconds | Saturation percentage |
|---|---|---|---|
| A | 6837 | 83 | 1.213983% |
| B | 6837 | 129 | 1.886792% |
| C | 6837 | 85 | 1.243235% |
| D | 6837 | 454 | 6.640339% |
Noise dominated data is calculated using 1-second bins in cleaned event files. If a bin has >2000 counts, and if more than 50% of those come from <1% of pixels, then it is considered to be noise-dominated and hence unusable.
| Quadrant | # 1 sec bins | Bins with >0 counts | Bins with >2000 counts | High rate bins dominated by noise | Noise dominated (total time) | Noise dominated (detector-on time) | Marked lightcurve |
|---|---|---|---|---|---|---|---|
| A | 7797 | 6839 | 7 | 7 | 0.09% | 0.10% | 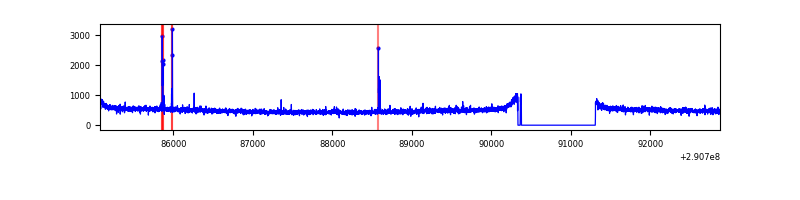 |
| B | 7797 | 6839 | 16 | 16 | 0.21% | 0.23% | 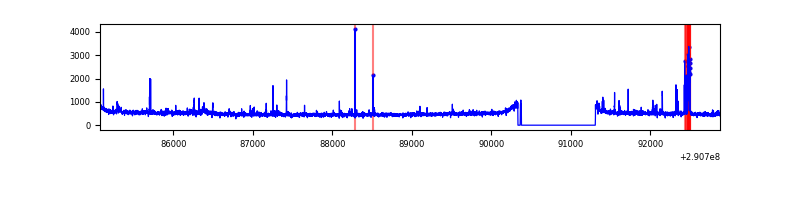 |
| C | 7797 | 6839 | 0 | 0 | 0.00% | 0.00% | 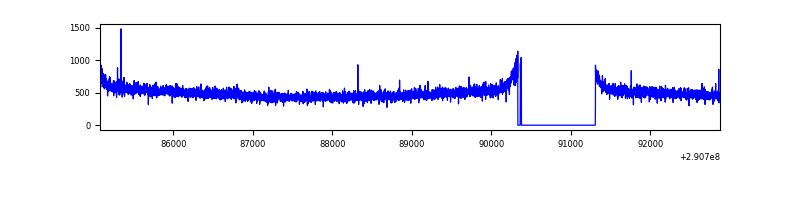 |
| D | 7797 | 6839 | 303 | 303 | 3.89% | 4.43% | 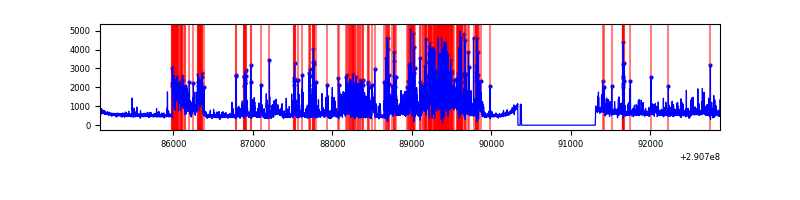 |
Top three noisy pixels from each quadrant. If the there are fewer than three noisy pixels in the level2.evt file, extra rows are filled as -1
| Pixel properties | Quadrant properties | ||||||
|---|---|---|---|---|---|---|---|
| Quadrant | DetID | PixID | Counts | Sigma | Mean | Median | Sigma |
| A | 12 | 96 | 29591 | 164.68 | 867 | 851 | 174.5 |
| A | 4 | 2 | 14441 | 77.87 | 867 | 851 | 174.5 |
| A | 13 | 254 | 11028 | 58.32 | 867 | 851 | 174.5 |
| B | 7 | 220 | 84753 | 518.36 | 862 | 841 | 161.9 |
| B | 0 | 229 | 37102 | 224.0 | 862 | 841 | 161.9 |
| B | 12 | 111 | 19212 | 113.49 | 862 | 841 | 161.9 |
| C | 14 | 238 | 132076 | 682.68 | 828 | 833 | 192.2 |
| C | 3 | 233 | 8123 | 37.92 | 828 | 833 | 192.2 |
| C | 9 | 54 | 7618 | 35.29 | 828 | 833 | 192.2 |
| D | 5 | 222 | 1149912 | 5761.62 | 823 | 800 | 199.4 |
| D | 1 | 52 | 1082066 | 5421.44 | 823 | 800 | 199.4 |
| D | 7 | 223 | 401654 | 2009.87 | 823 | 800 | 199.4 |
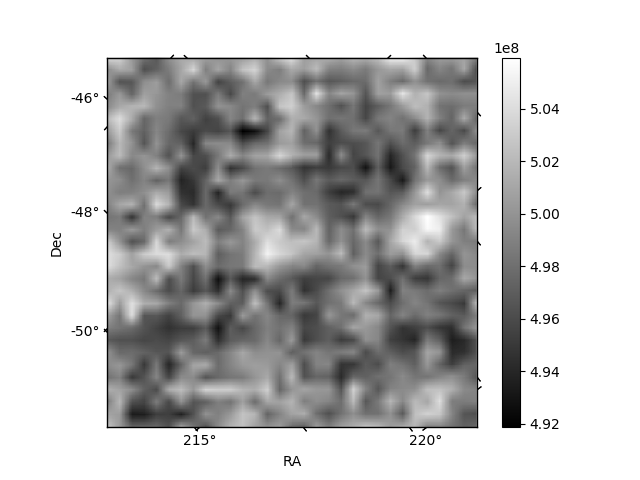
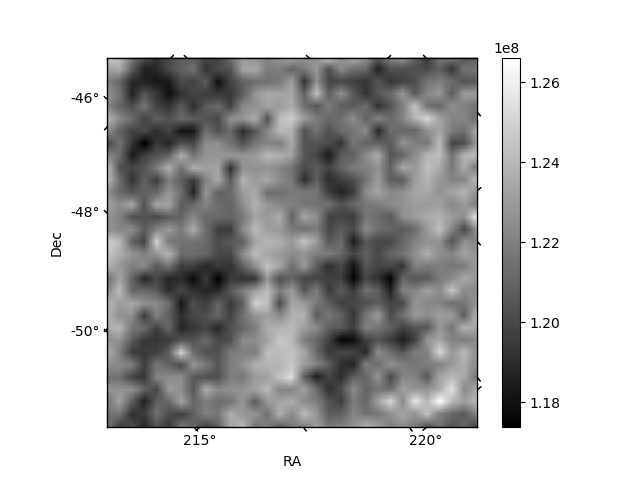
Histogram calculated using DETX and DETY for each event in the final _common_clean file
| Quadrant A | 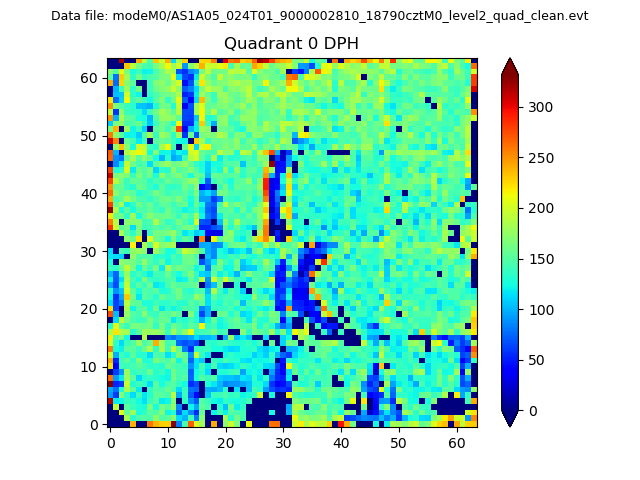 |
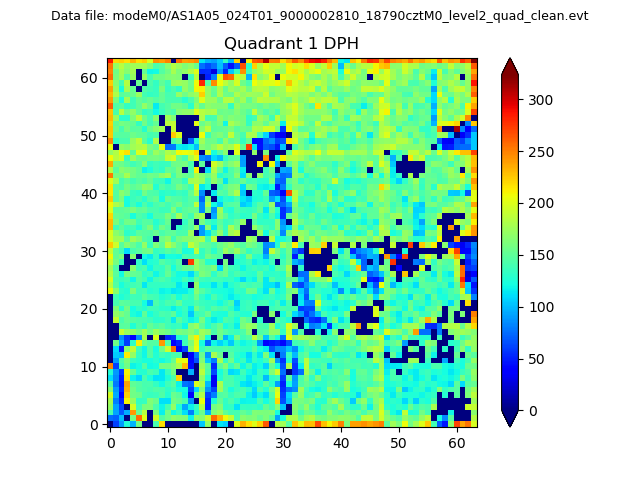 |
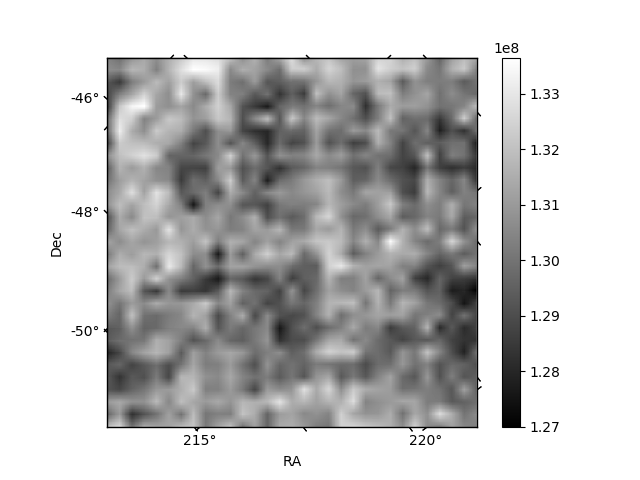
Quadrant B |
|---|---|---|---|
| Quadrant D | 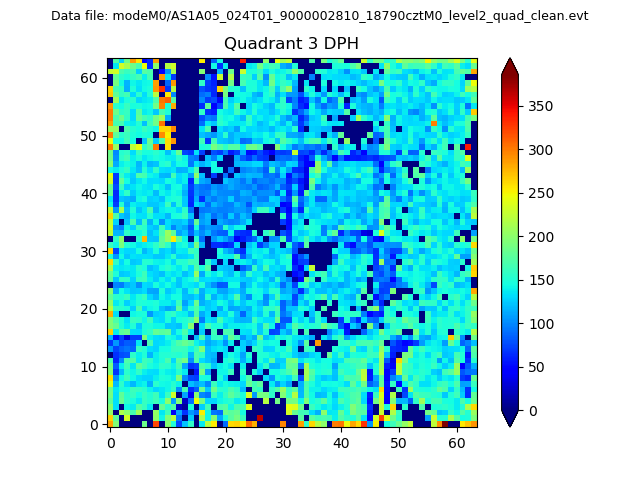 |
 |
Quadrant C |
| Plot type | Count rate plots | Images |
|---|---|---|
| Comparison with Poisson distribution Blue bars denote a histogram of data divided into 1 sec bins. Red curve is a Poisson curve with rate = median count rate of data. |
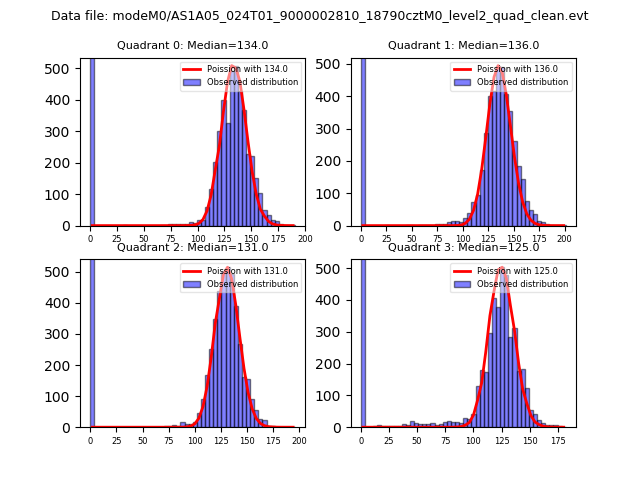 |
 |
| Quadrant-wise count rates Data is divided into 100 sec bins |
 |
|
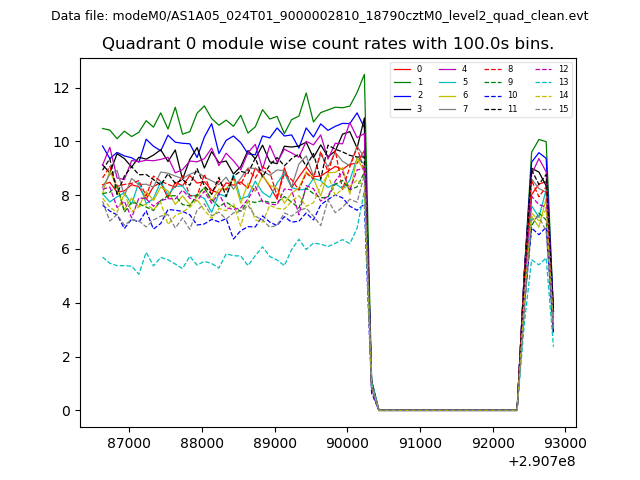
| Module-wise count rates for Quadrant A Data is divided into 100 sec bins |
 |
 |
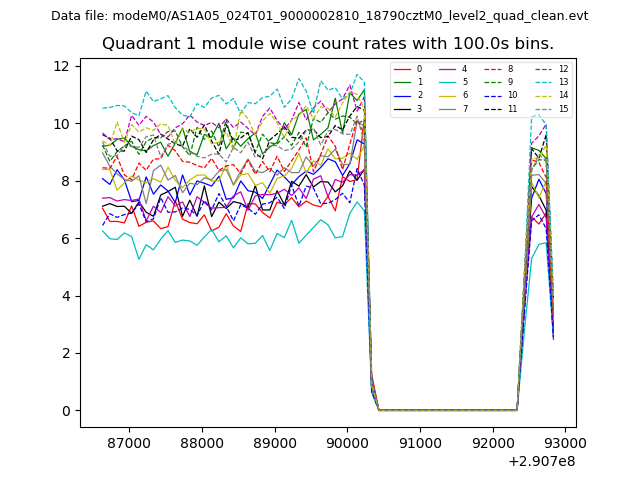
| Module-wise count rates for Quadrant B Data is divided into 100 sec bins |
 |
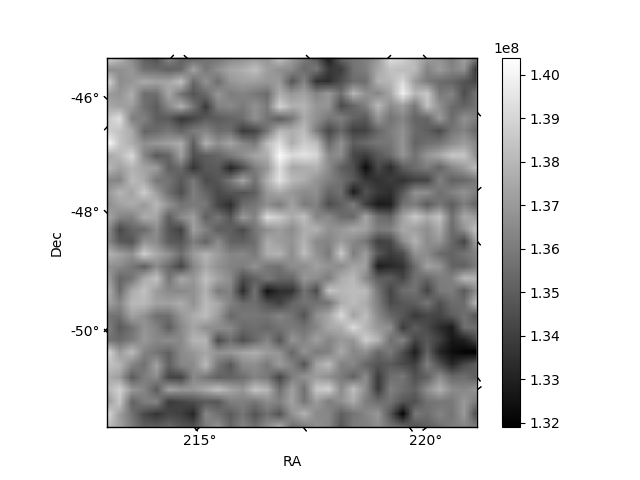 |
| Module-wise count rates for Quadrant C Data is divided into 100 sec bins |
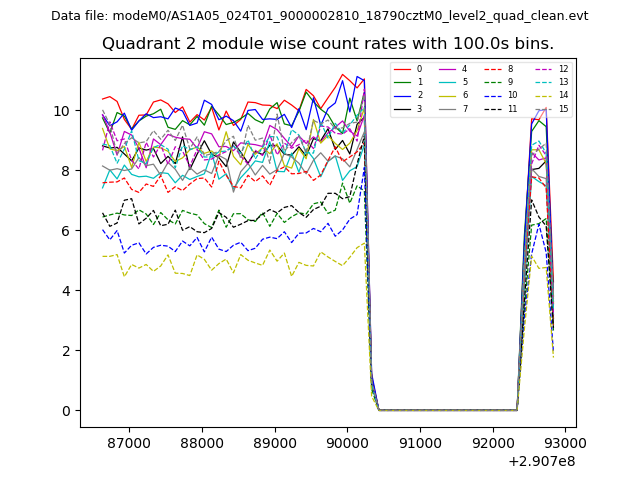 |
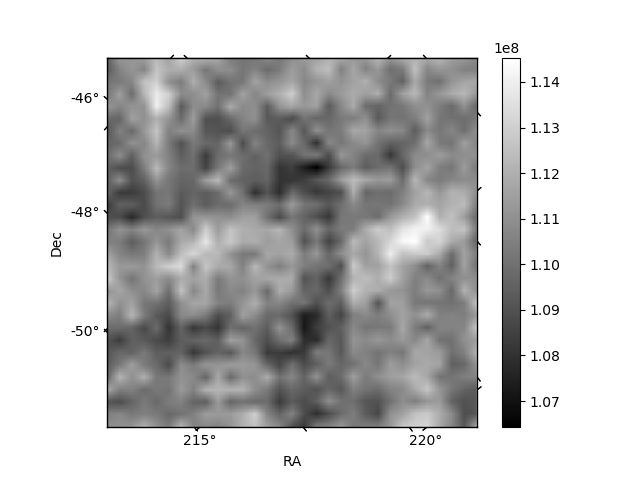 |
| Module-wise count rates for Quadrant D Data is divided into 100 sec bins |
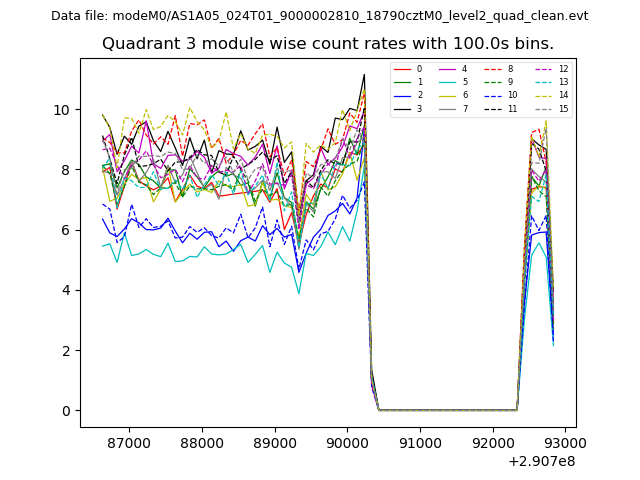 |
 |
| Parameter | Plot |
|---|---|
| CZT HV Monitor | 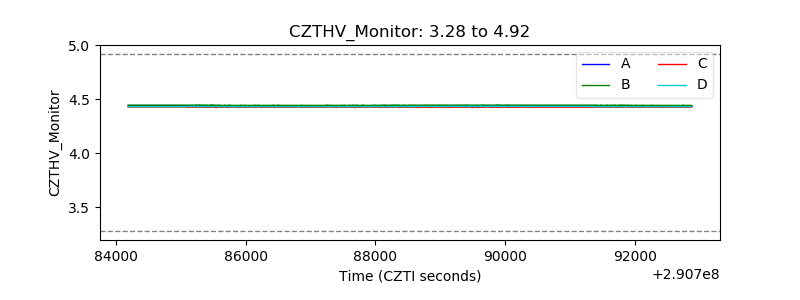 |
| D_VDD | 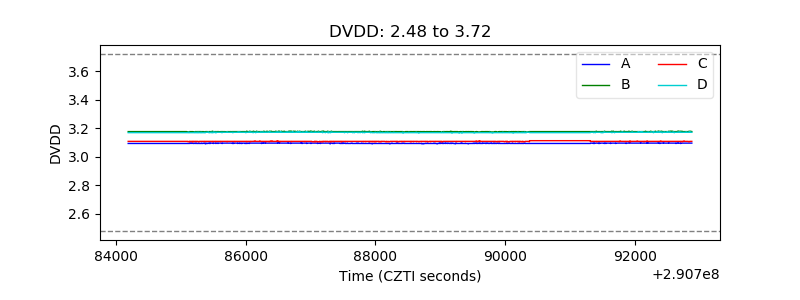 |
| Temperature 1 | 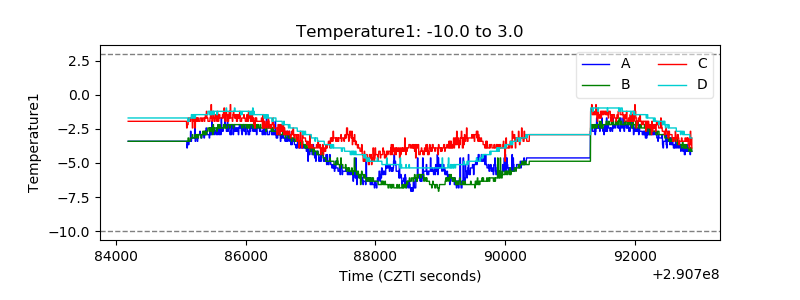 |
| Veto HV Monitor |  |
| Veto LLD |  |
| Alpha Counter |  |
| _CPM_Rate | 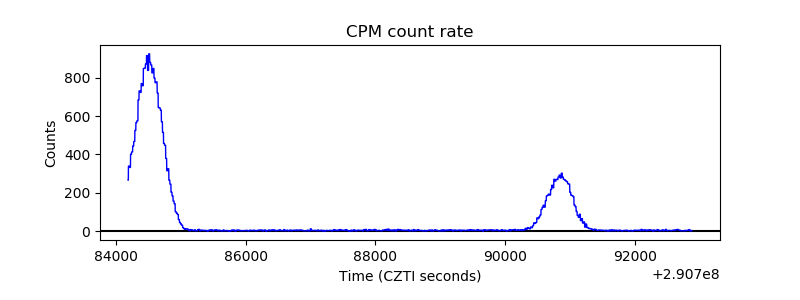 |
| CZT Counter | 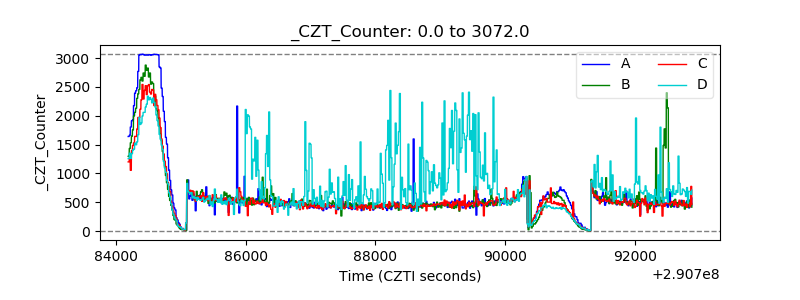 |
| +2.5 Volts monitor | 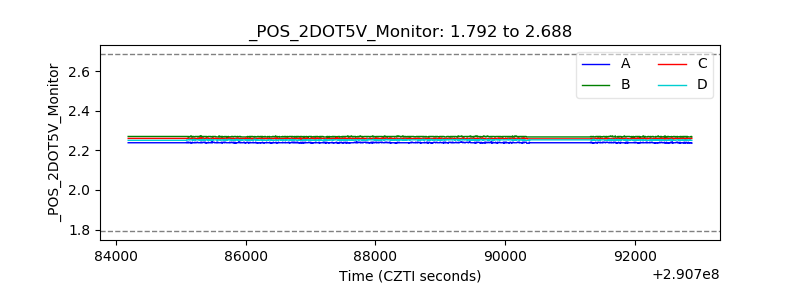 |
| +5 Volts monitor |  |
| _ROLL_ROT | 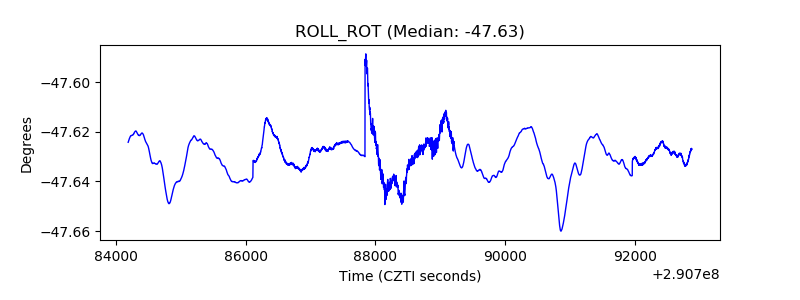 |
| _Roll_DEC | 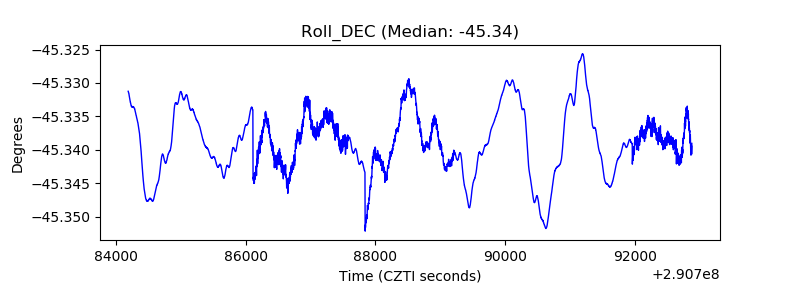 |
| _Roll_RA | 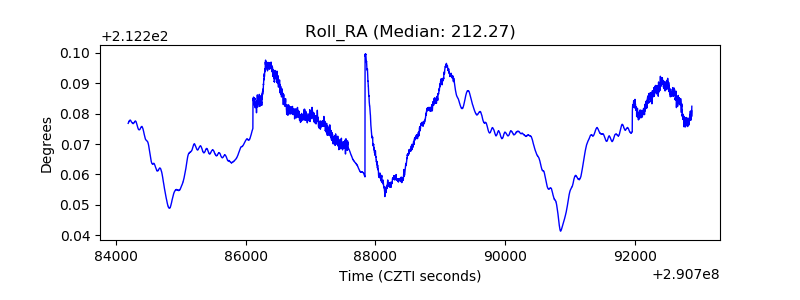 |
| Veto Counter | 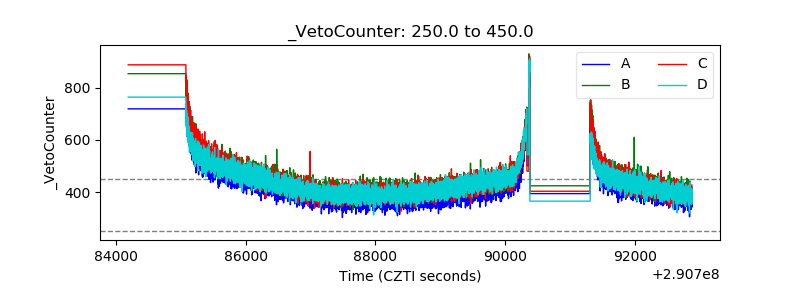 |