| Param | Original file | Final file |
|---|---|---|
| Filename | modeM0/AS1A05_024T01_9000002810_18792cztM0_level2.evt | modeM0/AS1A05_024T01_9000002810_18792cztM0_level2_quad_clean.evt |
| Size (bytes) | 907,145,280 | 172,120,320 |
| Size | 865.1 MB | 164.1 MB |
| Events in quadrant A | 6,300,903 | 1,096,233 |
| Events in quadrant B | 6,707,923 | 1,108,264 |
| Events in quadrant C | 6,305,871 | 1,061,433 |
| Events in quadrant D | 7,268,631 | 1,039,139 |
| Mode SS | |||
|---|---|---|---|
| Quadrant | BADHDUFLAG | Total packets | Discarded packets |
| A | 0 | 264 | 0 |
| B | 0 | 264 | 0 |
| C | 0 | 264 | 0 |
| D | 0 | 264 | 0 |
| Mode M9 | |||
|---|---|---|---|
| Quadrant | BADHDUFLAG | Total packets | Discarded packets |
| A | 0 | 11 | 0 |
| B | 0 | 12 | 0 |
| C | 0 | 12 | 0 |
| D | 0 | 12 | 0 |
| Mode M0 | |||
|---|---|---|---|
| Quadrant | BADHDUFLAG | Total packets | Discarded packets |
| A | 0 | 27326 | 4 |
| B | 0 | 28458 | 3 |
| C | 0 | 27256 | 3 |
| D | 0 | 30592 | 3 |
| Quadrant | Total seconds | Saturated seconds | Saturation percentage |
|---|---|---|---|
| A | 13146 | 159 | 1.209493% |
| B | 13146 | 306 | 2.327704% |
| C | 13146 | 223 | 1.696333% |
| D | 13146 | 178 | 1.354024% |
Noise dominated data is calculated using 1-second bins in cleaned event files. If a bin has >2000 counts, and if more than 50% of those come from <1% of pixels, then it is considered to be noise-dominated and hence unusable.
| Quadrant | # 1 sec bins | Bins with >0 counts | Bins with >2000 counts | High rate bins dominated by noise | Noise dominated (total time) | Noise dominated (detector-on time) | Marked lightcurve |
|---|---|---|---|---|---|---|---|
| A | 13966 | 13148 | 0 | 0 | 0.00% | 0.00% | 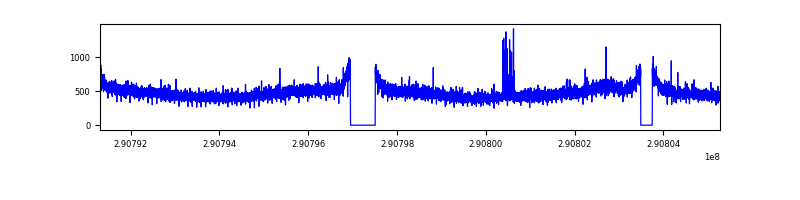 |
| B | 13966 | 13148 | 45 | 45 | 0.32% | 0.34% | 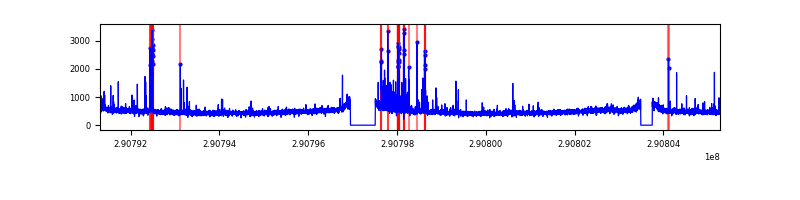 |
| C | 13966 | 13148 | 2 | 2 | 0.01% | 0.02% | 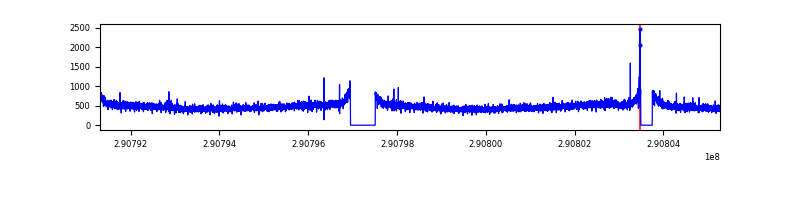 |
| D | 13966 | 13148 | 55 | 55 | 0.39% | 0.42% |  |
Top three noisy pixels from each quadrant. If the there are fewer than three noisy pixels in the level2.evt file, extra rows are filled as -1
| Pixel properties | Quadrant properties | ||||||
|---|---|---|---|---|---|---|---|
| Quadrant | DetID | PixID | Counts | Sigma | Mean | Median | Sigma |
| A | 8 | 205 | 52470 | 157.51 | 1606 | 1573 | 323.1 |
| A | 6 | 16 | 34409 | 101.61 | 1606 | 1573 | 323.1 |
| A | 13 | 254 | 21310 | 61.08 | 1606 | 1573 | 323.1 |
| B | 7 | 220 | 287849 | 949.84 | 1599 | 1559 | 301.4 |
| B | 4 | 216 | 38714 | 123.27 | 1599 | 1559 | 301.4 |
| B | 12 | 111 | 36423 | 115.67 | 1599 | 1559 | 301.4 |
| C | 14 | 238 | 239140 | 661.64 | 1541 | 1549 | 359.1 |
| C | 0 | 207 | 27873 | 73.31 | 1541 | 1549 | 359.1 |
| C | 8 | 128 | 11862 | 28.72 | 1541 | 1549 | 359.1 |
| D | 5 | 222 | 797389 | 2118.07 | 1554 | 1506 | 375.8 |
| D | 7 | 223 | 210942 | 557.37 | 1554 | 1506 | 375.8 |
| D | 12 | 110 | 179931 | 474.84 | 1554 | 1506 | 375.8 |
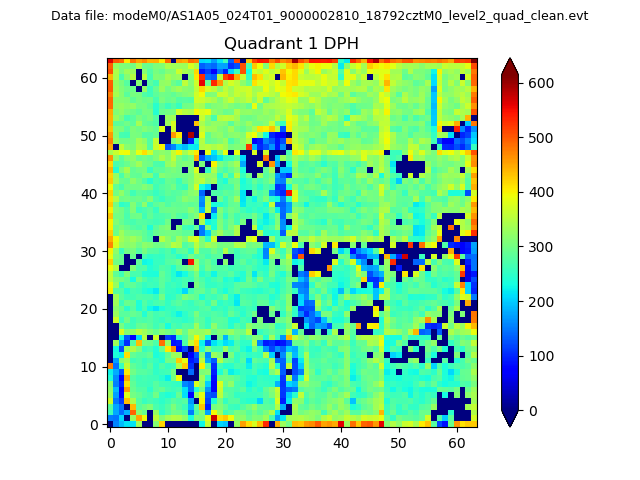
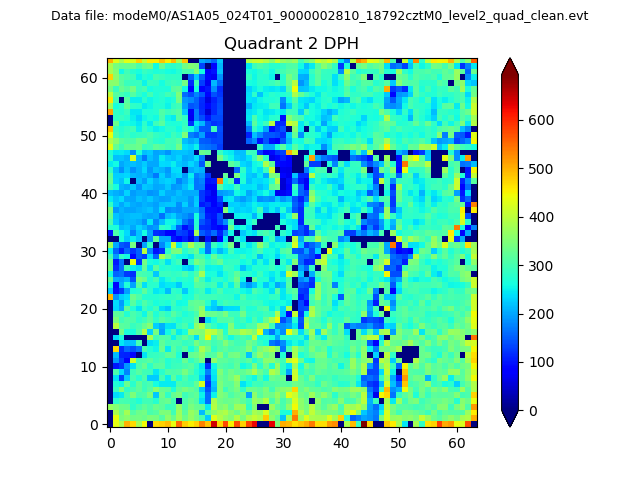
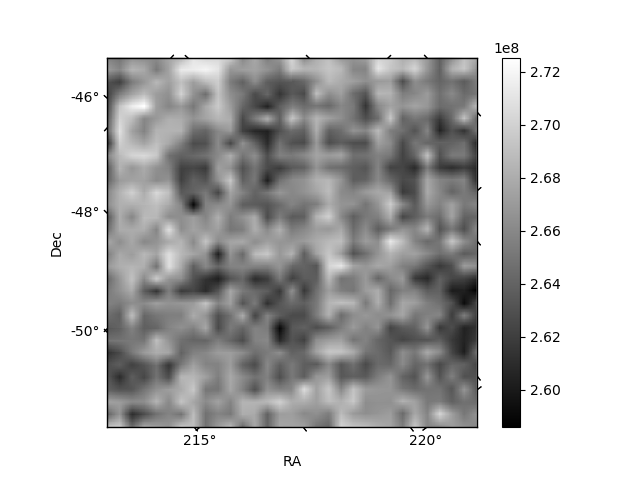
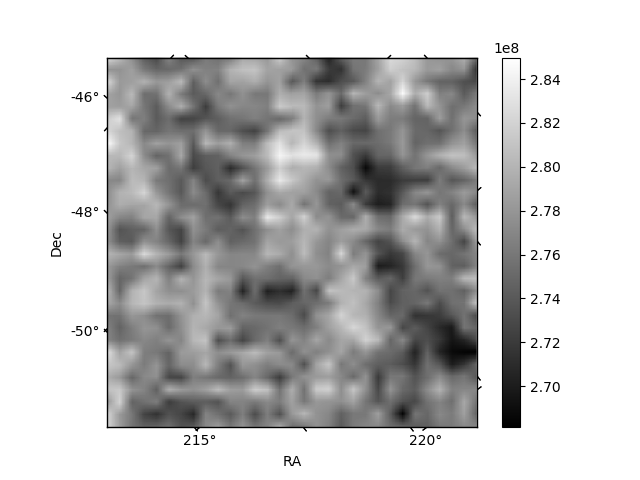
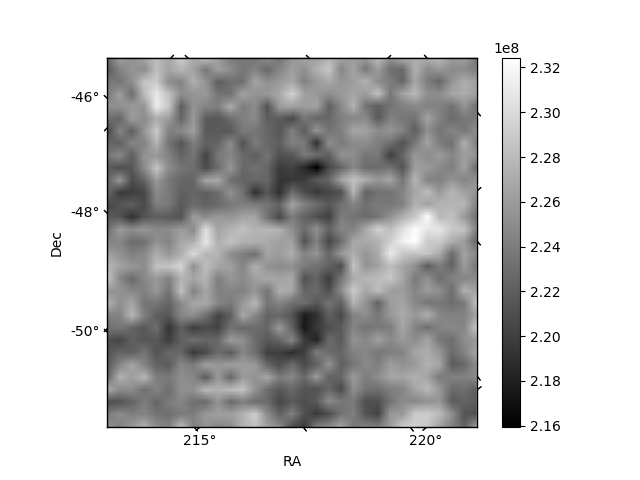
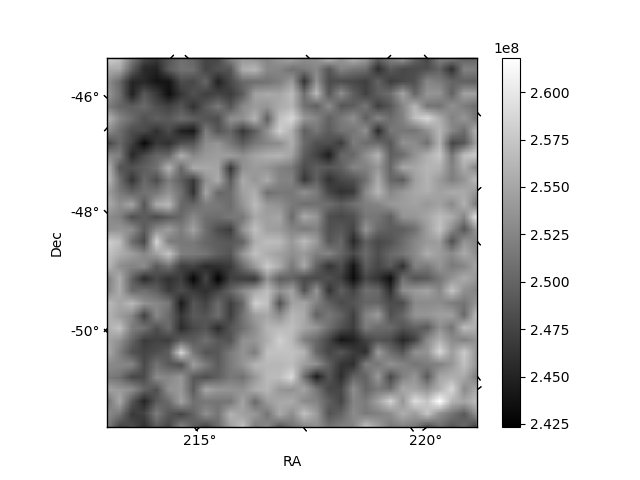
Histogram calculated using DETX and DETY for each event in the final _common_clean file
| Quadrant A |  |
 |
Quadrant B |
|---|---|---|---|
| Quadrant D | 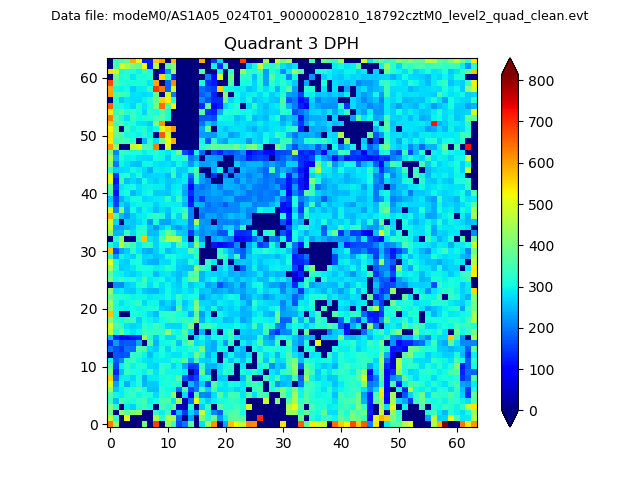 |
 |
Quadrant C |
| Plot type | Count rate plots | Images |
|---|---|---|
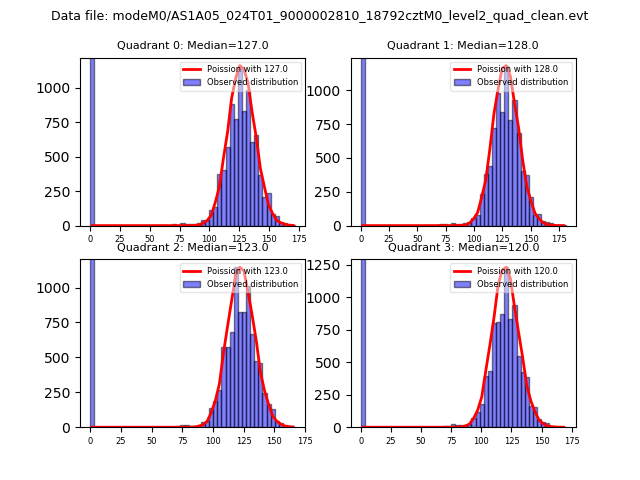
| Comparison with Poisson distribution Blue bars denote a histogram of data divided into 1 sec bins. Red curve is a Poisson curve with rate = median count rate of data. |
 |
 |
| Quadrant-wise count rates Data is divided into 100 sec bins |
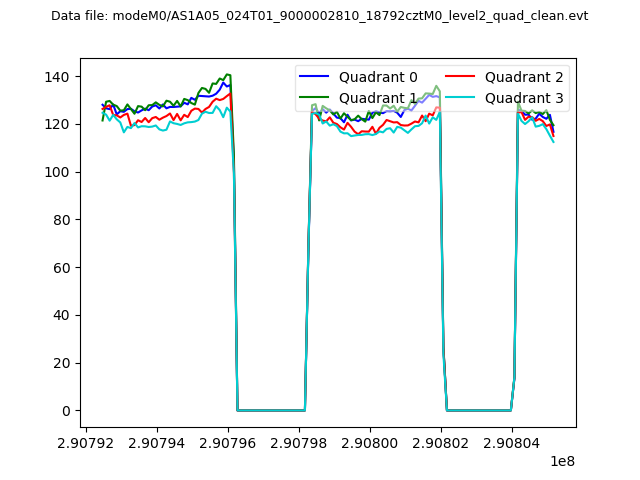 |
|
| Module-wise count rates for Quadrant A Data is divided into 100 sec bins |
 |
 |
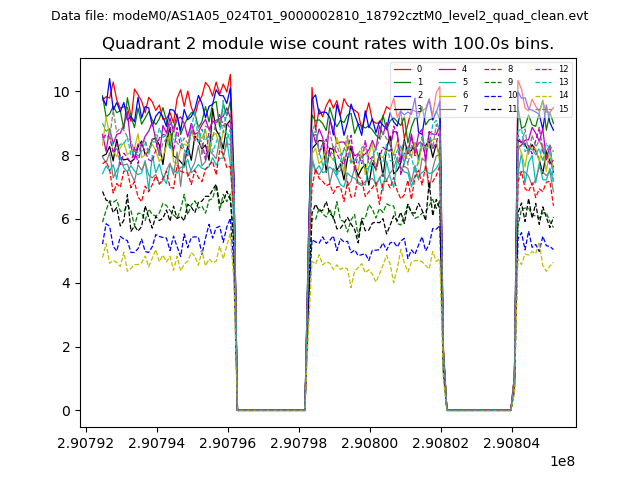
| Module-wise count rates for Quadrant B Data is divided into 100 sec bins |
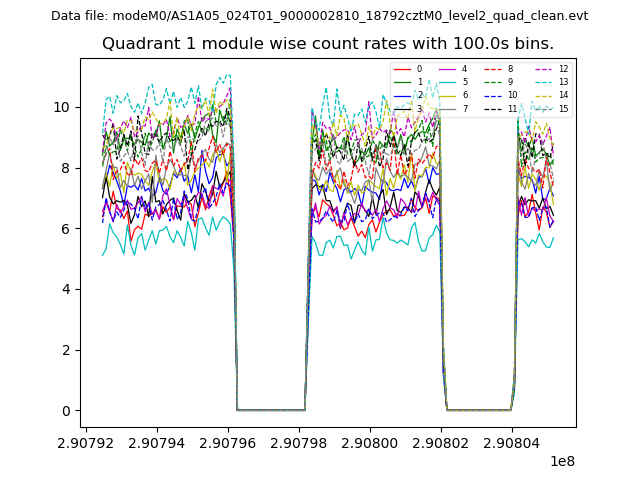 |
 |
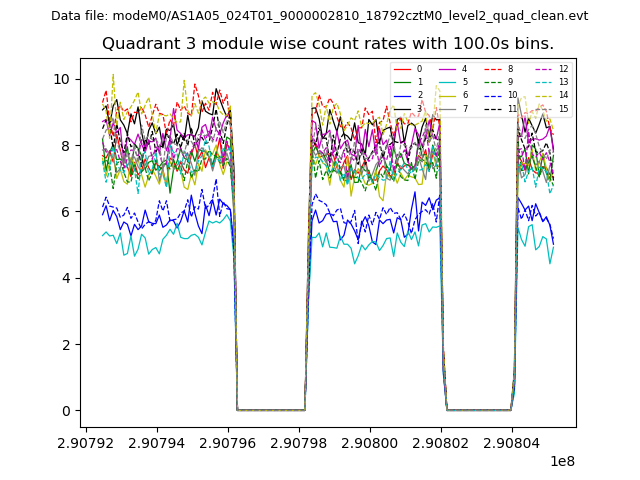
| Module-wise count rates for Quadrant C Data is divided into 100 sec bins |
 |
 |
| Module-wise count rates for Quadrant D Data is divided into 100 sec bins |
 |
 |
| Parameter | Plot |
|---|---|
| CZT HV Monitor | 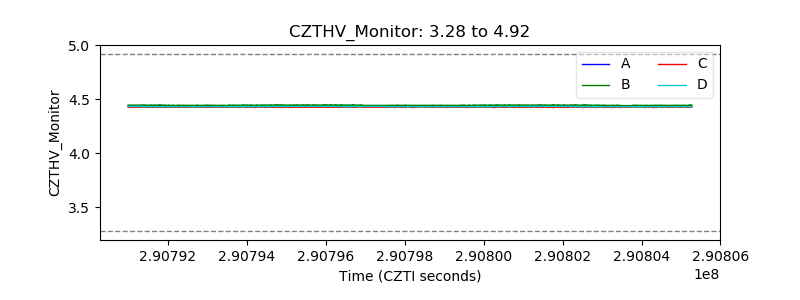 |
| D_VDD | 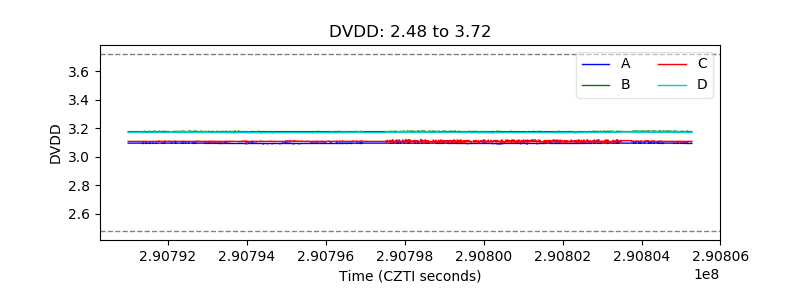 |
| Temperature 1 | 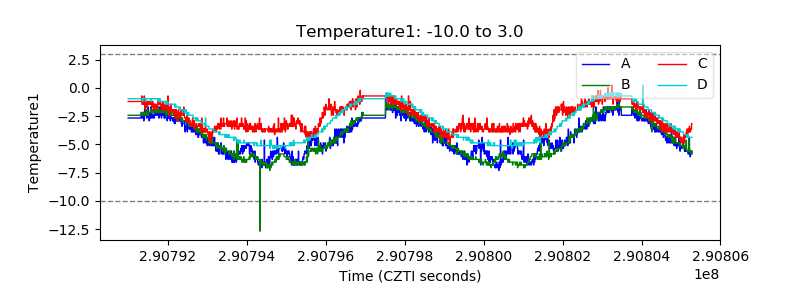 |
| Veto HV Monitor |  |
| Veto LLD | 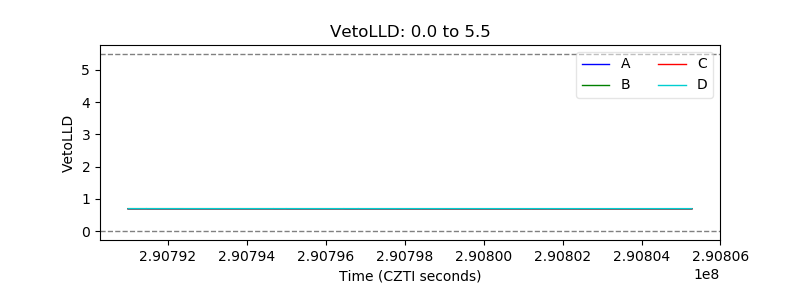 |
| Alpha Counter | 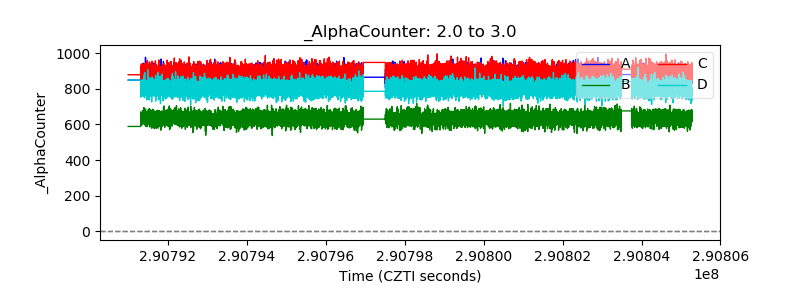 |
| _CPM_Rate | 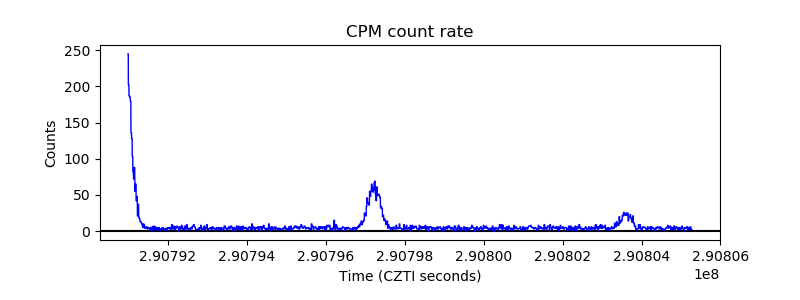 |
| CZT Counter | 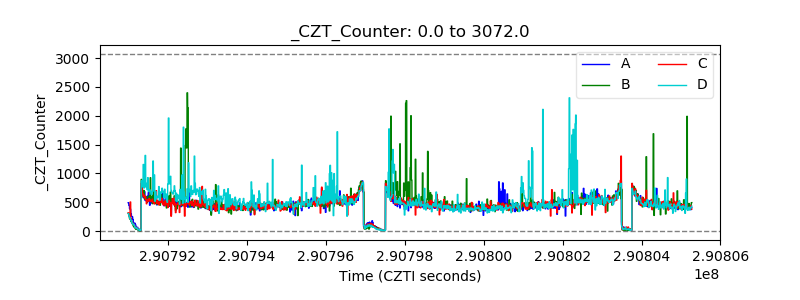 |
| +2.5 Volts monitor |  |
| +5 Volts monitor |  |
| _ROLL_ROT | 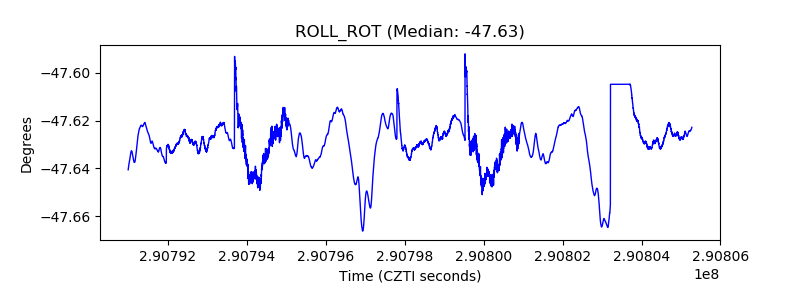 |
| _Roll_DEC | 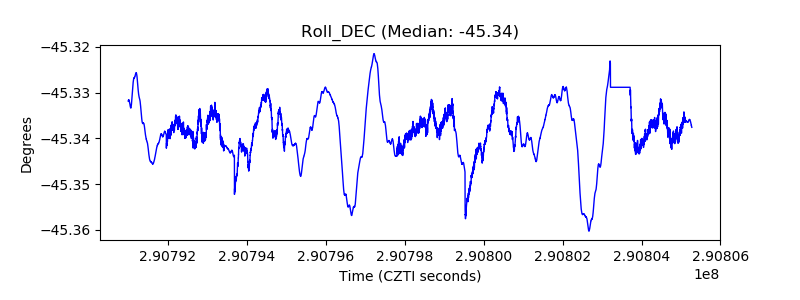 |
| _Roll_RA | 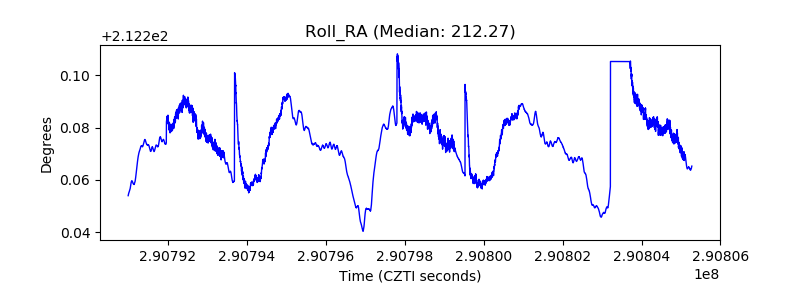 |
| Veto Counter | 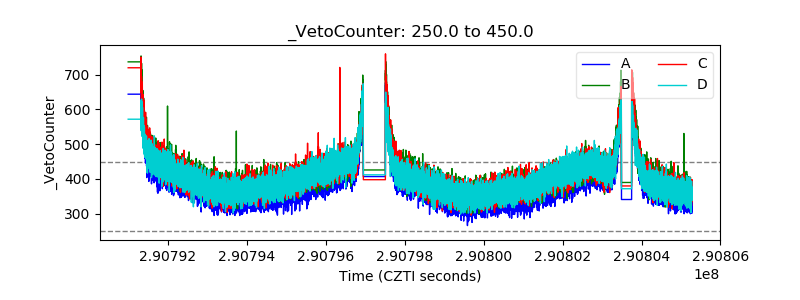 |