| Param | Original file | Final file |
|---|---|---|
| Filename | modeM0/AS1A05_024T01_9000002810_18796cztM0_level2.evt | modeM0/AS1A05_024T01_9000002810_18796cztM0_level2_quad_clean.evt |
| Size (bytes) | 1,706,595,840 | 313,280,640 |
| Size | 1.6 GB | 298.8 MB |
| Events in quadrant A | 11,615,306 | 1,975,114 |
| Events in quadrant B | 11,996,957 | 2,017,118 |
| Events in quadrant C | 11,813,649 | 1,927,738 |
| Events in quadrant D | 14,581,995 | 1,862,031 |
| Mode SS | |||
|---|---|---|---|
| Quadrant | BADHDUFLAG | Total packets | Discarded packets |
| A | 0 | 506 | 0 |
| B | 0 | 506 | 0 |
| C | 0 | 506 | 0 |
| D | 0 | 506 | 0 |
| Mode M9 | |||
|---|---|---|---|
| Quadrant | BADHDUFLAG | Total packets | Discarded packets |
| A | 0 | 26 | 0 |
| B | 0 | 26 | 0 |
| C | 0 | 26 | 0 |
| D | 0 | 26 | 0 |
| Mode M0 | |||
|---|---|---|---|
| Quadrant | BADHDUFLAG | Total packets | Discarded packets |
| A | 0 | 51106 | 5 |
| B | 0 | 51855 | 5 |
| C | 0 | 51037 | 5 |
| D | 0 | 60581 | 5 |
| Quadrant | Total seconds | Saturated seconds | Saturation percentage |
|---|---|---|---|
| A | 24803 | 158 | 0.637020% |
| B | 24804 | 280 | 1.128850% |
| C | 24804 | 301 | 1.213514% |
| D | 24804 | 607 | 2.447186% |
Noise dominated data is calculated using 1-second bins in cleaned event files. If a bin has >2000 counts, and if more than 50% of those come from <1% of pixels, then it is considered to be noise-dominated and hence unusable.
| Quadrant | # 1 sec bins | Bins with >0 counts | Bins with >2000 counts | High rate bins dominated by noise | Noise dominated (total time) | Noise dominated (detector-on time) | Marked lightcurve |
|---|---|---|---|---|---|---|---|
| A | 27433 | 24809 | 2 | 2 | 0.01% | 0.01% | 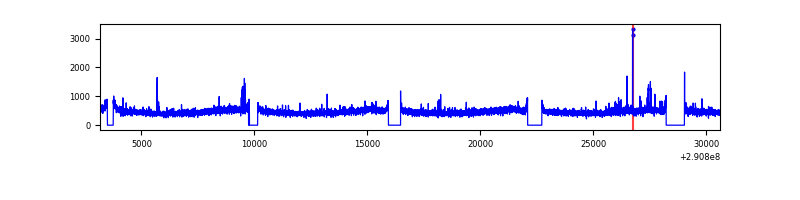 |
| B | 27434 | 24810 | 25 | 25 | 0.09% | 0.10% | 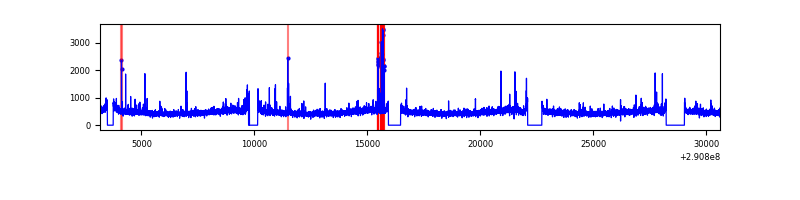 |
| C | 27434 | 24810 | 2 | 2 | 0.01% | 0.01% |  |
| D | 27434 | 24810 | 385 | 385 | 1.40% | 1.55% | 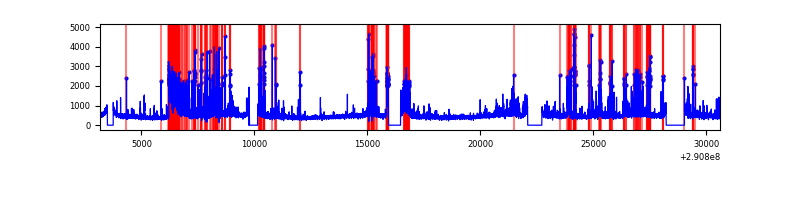 |
Top three noisy pixels from each quadrant. If the there are fewer than three noisy pixels in the level2.evt file, extra rows are filled as -1
| Pixel properties | Quadrant properties | ||||||
|---|---|---|---|---|---|---|---|
| Quadrant | DetID | PixID | Counts | Sigma | Mean | Median | Sigma |
| A | 6 | 16 | 61349 | 97.68 | 2967 | 2902 | 598.3 |
| A | 12 | 96 | 46333 | 72.58 | 2967 | 2902 | 598.3 |
| A | 13 | 254 | 39485 | 61.14 | 2967 | 2902 | 598.3 |
| B | 7 | 220 | 124027 | 214.75 | 2967 | 2888 | 564.1 |
| B | 12 | 111 | 69129 | 117.43 | 2967 | 2888 | 564.1 |
| B | 11 | 111 | 60018 | 101.28 | 2967 | 2888 | 564.1 |
| C | 14 | 238 | 444258 | 658.38 | 2865 | 2876 | 670.4 |
| C | 3 | 233 | 151606 | 221.85 | 2865 | 2876 | 670.4 |
| C | 0 | 207 | 26008 | 34.5 | 2865 | 2876 | 670.4 |
| D | 1 | 52 | 2564539 | 3682.16 | 2873 | 2788 | 695.7 |
| D | 5 | 222 | 1026897 | 1472.02 | 2873 | 2788 | 695.7 |
| D | 2 | 234 | 107972 | 151.19 | 2873 | 2788 | 695.7 |
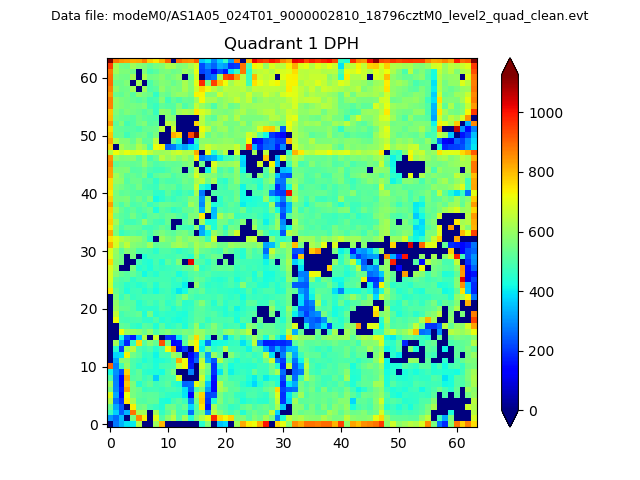
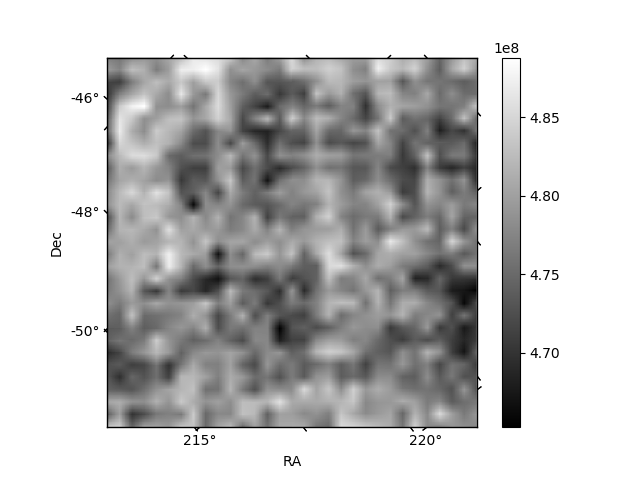
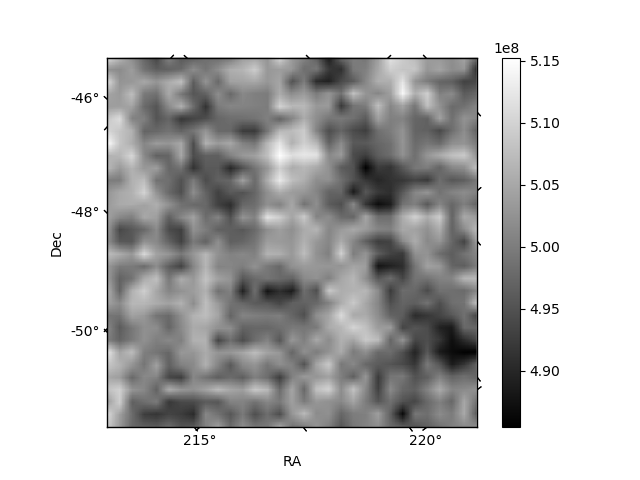
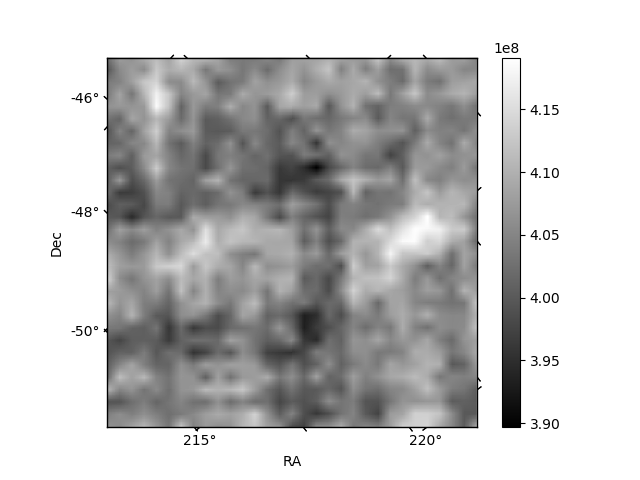
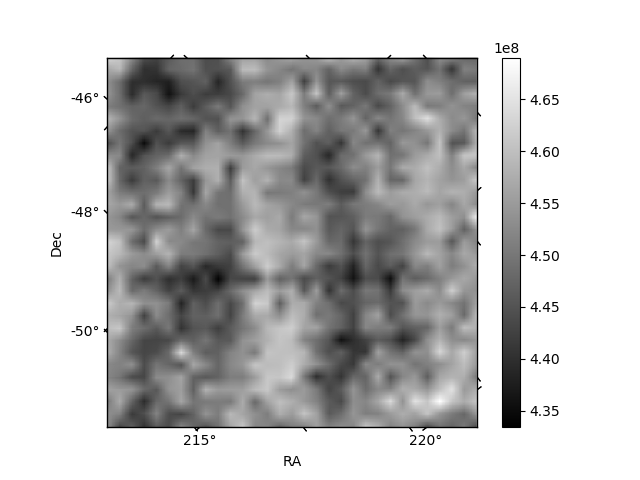
Histogram calculated using DETX and DETY for each event in the final _common_clean file
| Quadrant A | 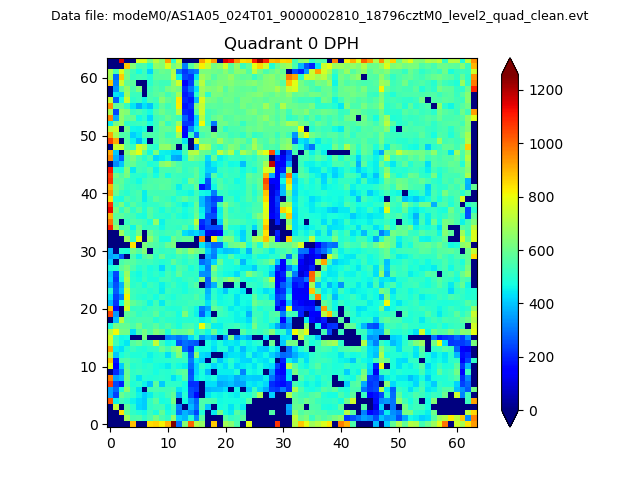 |
 |
Quadrant B |
|---|---|---|---|
| Quadrant D | 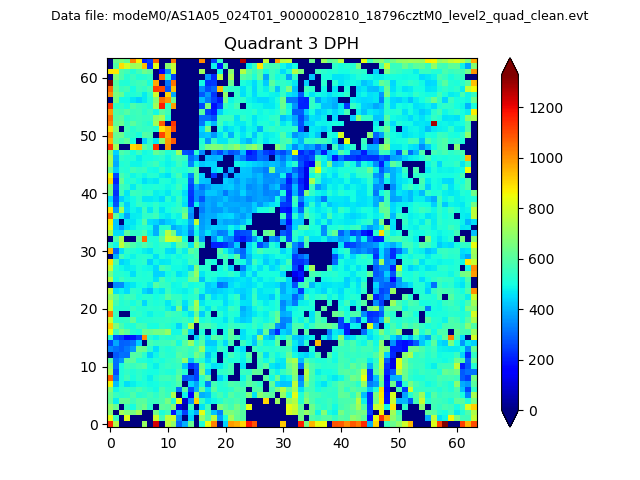 |
 |
Quadrant C |
| Plot type | Count rate plots | Images |
|---|---|---|
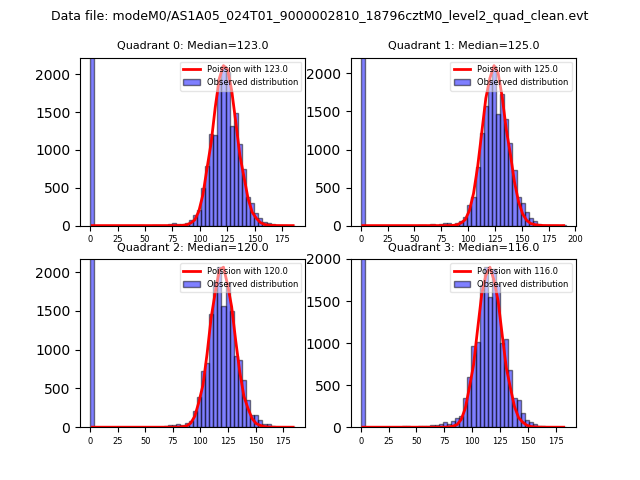
| Comparison with Poisson distribution Blue bars denote a histogram of data divided into 1 sec bins. Red curve is a Poisson curve with rate = median count rate of data. |
 |
 |
| Quadrant-wise count rates Data is divided into 100 sec bins |
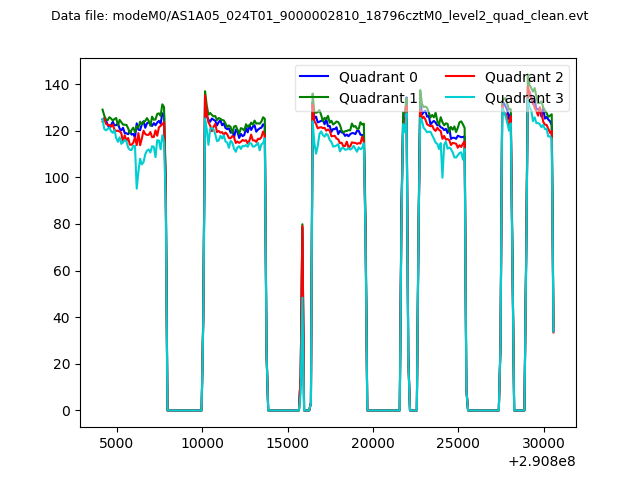 |
|
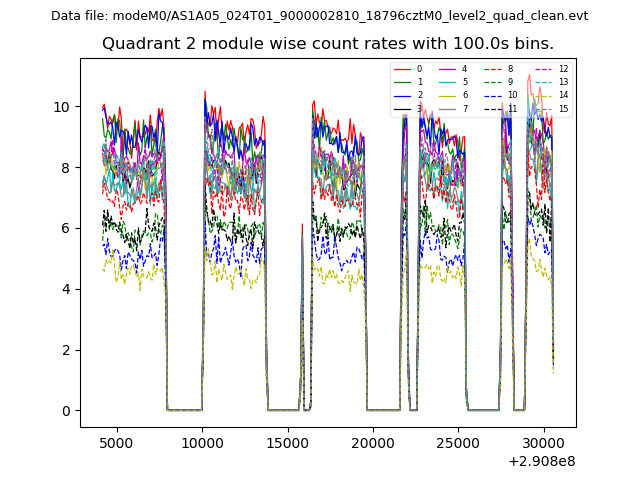
| Module-wise count rates for Quadrant A Data is divided into 100 sec bins |
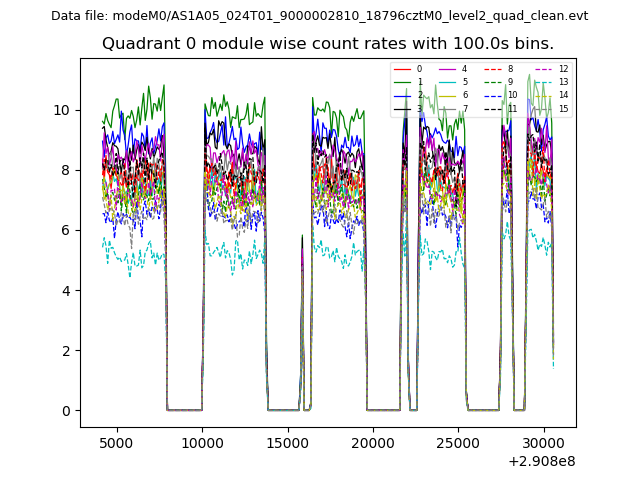 |
 |
| Module-wise count rates for Quadrant B Data is divided into 100 sec bins |
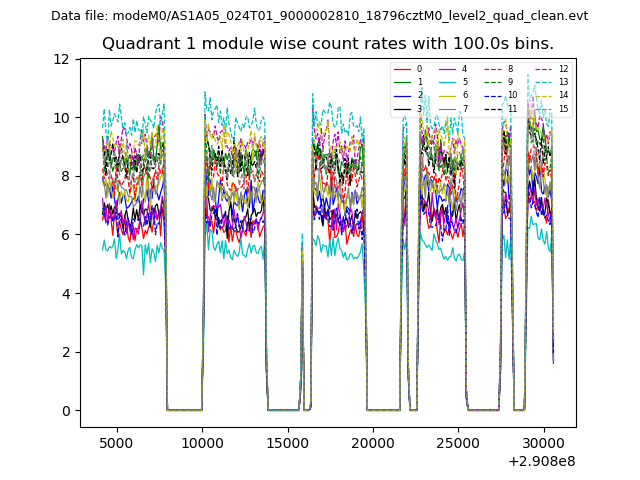 |
 |
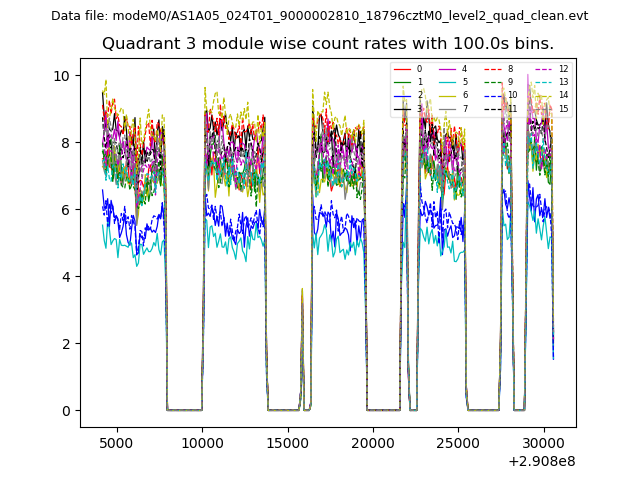
| Module-wise count rates for Quadrant C Data is divided into 100 sec bins |
 |
 |
| Module-wise count rates for Quadrant D Data is divided into 100 sec bins |
 |
 |
| Parameter | Plot |
|---|---|
| CZT HV Monitor | 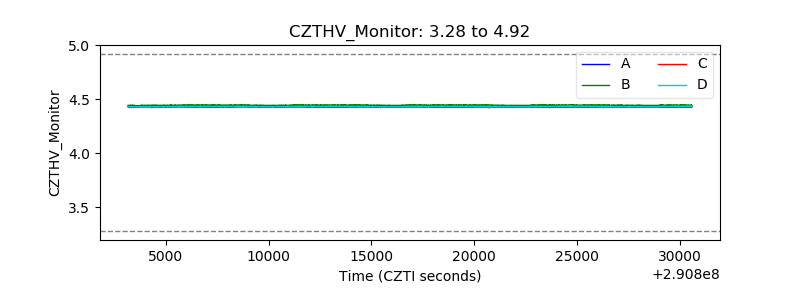 |
| D_VDD | 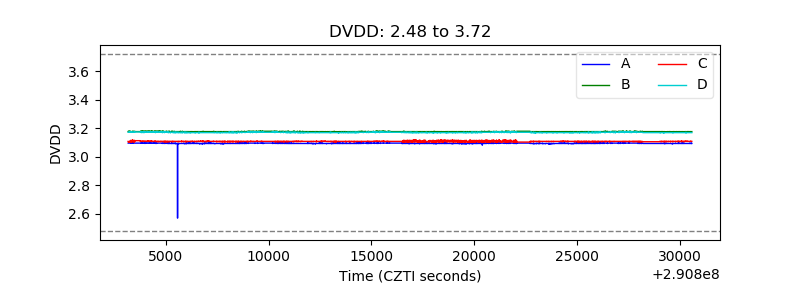 |
| Temperature 1 | 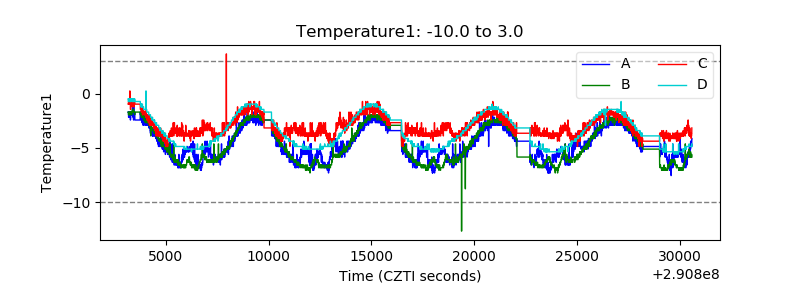 |
| Veto HV Monitor | 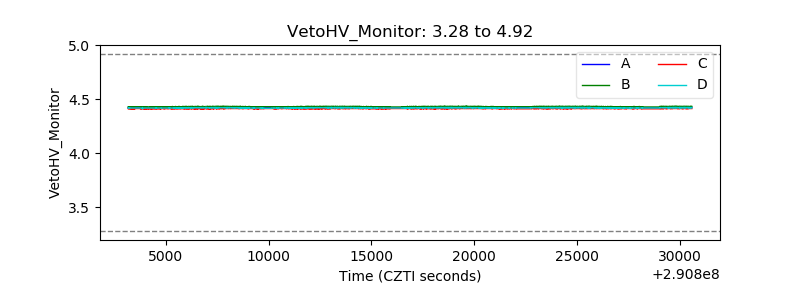 |
| Veto LLD | 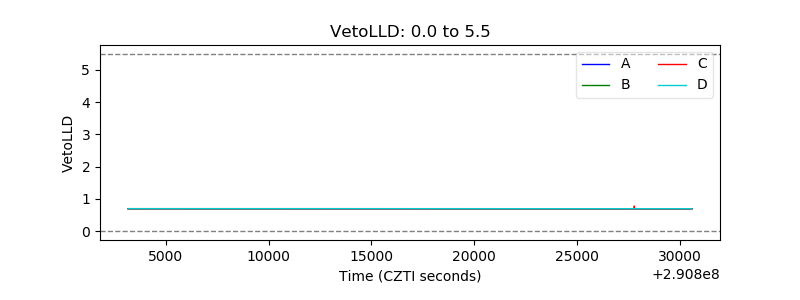 |
| Alpha Counter |  |
| _CPM_Rate | 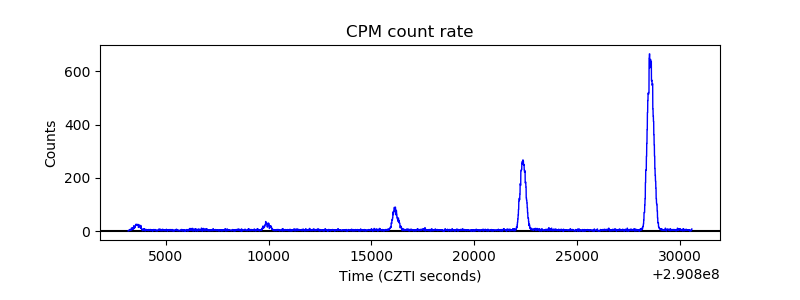 |
| CZT Counter |  |
| +2.5 Volts monitor |  |
| +5 Volts monitor |  |
| _ROLL_ROT | 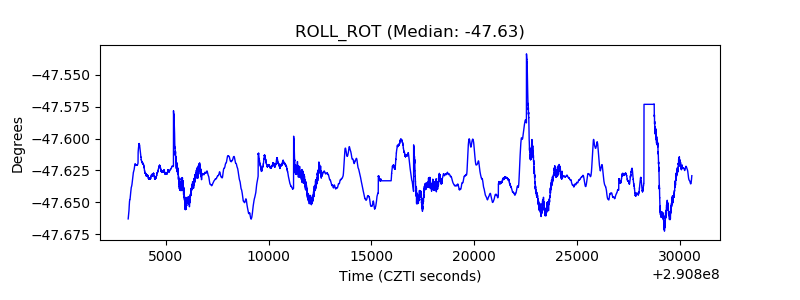 |
| _Roll_DEC | 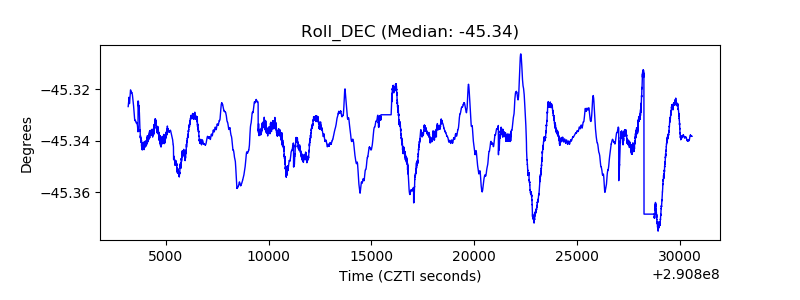 |
| _Roll_RA |  |
| Veto Counter | 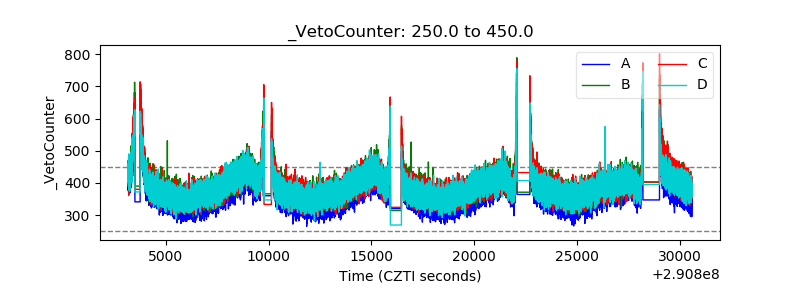 |