| Param | Original file | Final file |
|---|---|---|
| Filename | modeM0/AS1A05_024T01_9000002810_18799cztM0_level2.evt | modeM0/AS1A05_024T01_9000002810_18799cztM0_level2_quad_clean.evt |
| Size (bytes) | 378,843,840 | 75,407,040 |
| Size | 361.3 MB | 71.9 MB |
| Events in quadrant A | 2,581,130 | 481,844 |
| Events in quadrant B | 2,658,934 | 494,405 |
| Events in quadrant C | 3,048,142 | 471,659 |
| Events in quadrant D | 2,816,755 | 456,456 |
| Mode SS | |||
|---|---|---|---|
| Quadrant | BADHDUFLAG | Total packets | Discarded packets |
| A | 0 | 116 | 8 |
| B | 0 | 114 | 6 |
| C | 0 | 115 | 7 |
| D | 0 | 117 | 9 |
| Mode M9 | |||
|---|---|---|---|
| Quadrant | BADHDUFLAG | Total packets | Discarded packets |
| A | 0 | 11 | 3 |
| B | 0 | 10 | 2 |
| C | 0 | 9 | 2 |
| D | 0 | 9 | 1 |
| Mode M0 | |||
|---|---|---|---|
| Quadrant | BADHDUFLAG | Total packets | Discarded packets |
| A | 0 | 11648 | 606 |
| B | 0 | 11900 | 671 |
| C | 0 | 13342 | 609 |
| D | 0 | 12345 | 625 |
| Quadrant | Total seconds | Saturated seconds | Saturation percentage |
|---|---|---|---|
| A | 5410 | 2 | 0.036969% |
| B | 5415 | 6 | 0.110803% |
| C | 5422 | 35 | 0.645518% |
| D | 5407 | 17 | 0.314407% |
Noise dominated data is calculated using 1-second bins in cleaned event files. If a bin has >2000 counts, and if more than 50% of those come from <1% of pixels, then it is considered to be noise-dominated and hence unusable.
| Quadrant | # 1 sec bins | Bins with >0 counts | Bins with >2000 counts | High rate bins dominated by noise | Noise dominated (total time) | Noise dominated (detector-on time) | Marked lightcurve |
|---|---|---|---|---|---|---|---|
| A | 7306 | 5431 | 0 | 0 | 0.00% | 0.00% | 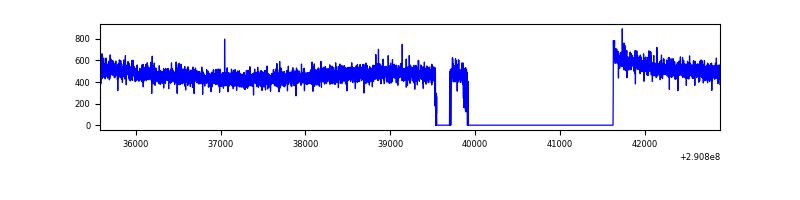 |
| B | 7306 | 5439 | 1 | 1 | 0.01% | 0.02% | 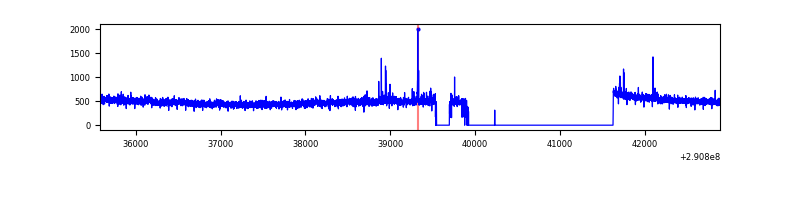 |
| C | 7306 | 5436 | 0 | 0 | 0.00% | 0.00% | 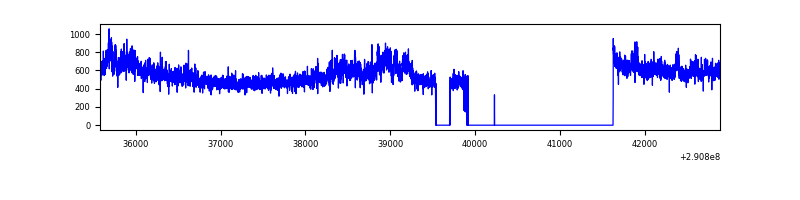 |
| D | 7306 | 5426 | 17 | 17 | 0.23% | 0.31% | 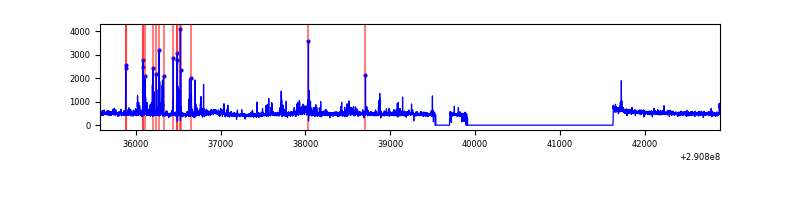 |
Top three noisy pixels from each quadrant. If the there are fewer than three noisy pixels in the level2.evt file, extra rows are filled as -1
| Pixel properties | Quadrant properties | ||||||
|---|---|---|---|---|---|---|---|
| Quadrant | DetID | PixID | Counts | Sigma | Mean | Median | Sigma |
| A | 13 | 254 | 8986 | 62.19 | 669 | 655 | 134.0 |
| A | 0 | 226 | 5712 | 37.75 | 669 | 655 | 134.0 |
| A | 3 | 137 | 4970 | 32.21 | 669 | 655 | 134.0 |
| B | 12 | 111 | 14742 | 111.14 | 667 | 650 | 126.8 |
| B | 0 | 198 | 13086 | 98.08 | 667 | 650 | 126.8 |
| B | 11 | 111 | 12988 | 97.31 | 667 | 650 | 126.8 |
| C | 3 | 233 | 383518 | 2501.59 | 656 | 663 | 153.0 |
| C | 14 | 238 | 102515 | 665.5 | 656 | 663 | 153.0 |
| C | 13 | 61 | 4683 | 26.27 | 656 | 663 | 153.0 |
| D | 5 | 222 | 244026 | 1532.94 | 659 | 643 | 158.8 |
| D | 1 | 52 | 60055 | 374.2 | 659 | 643 | 158.8 |
| D | 2 | 234 | 22856 | 139.91 | 659 | 643 | 158.8 |
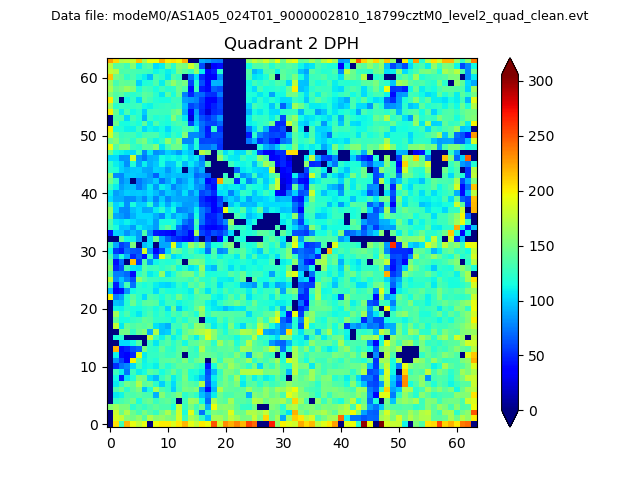
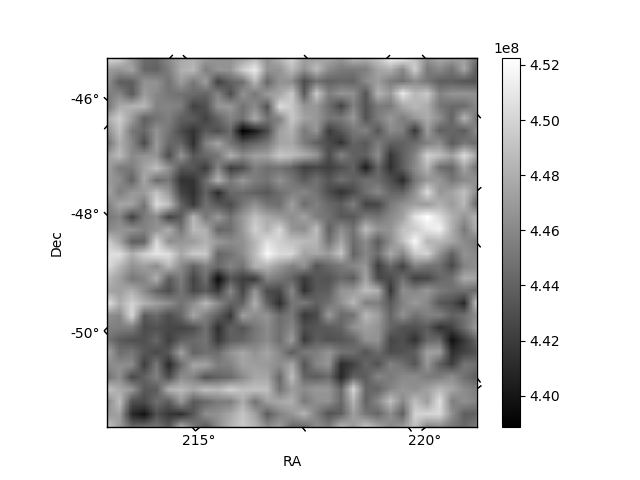
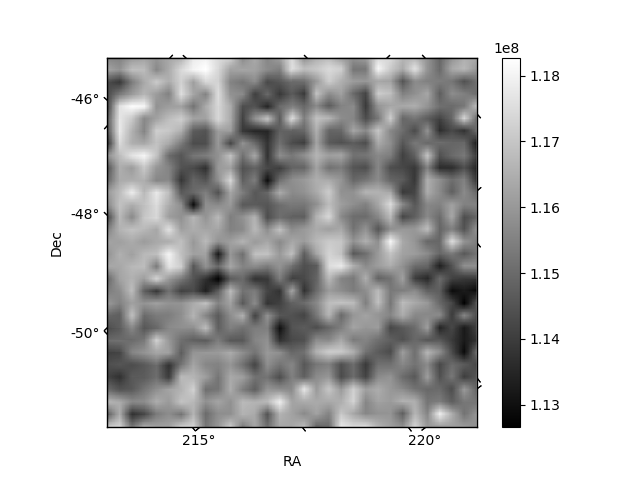
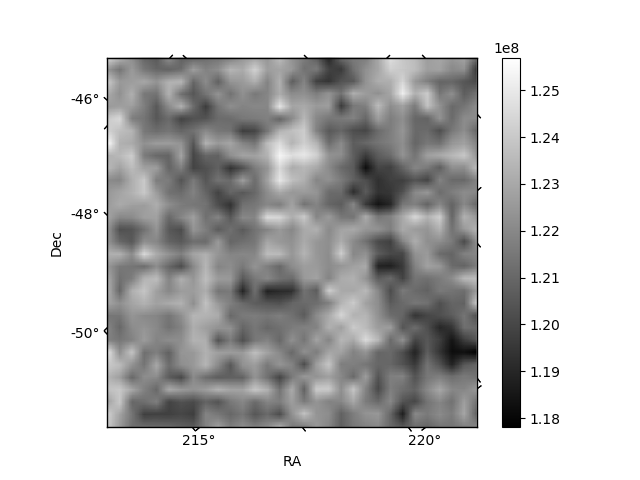
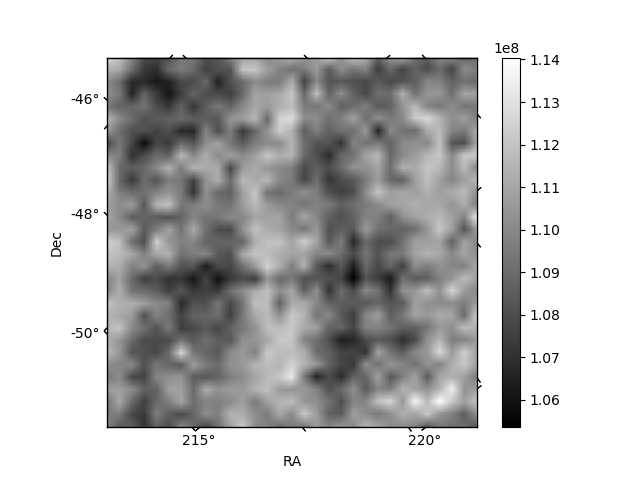
Histogram calculated using DETX and DETY for each event in the final _common_clean file
| Quadrant A | 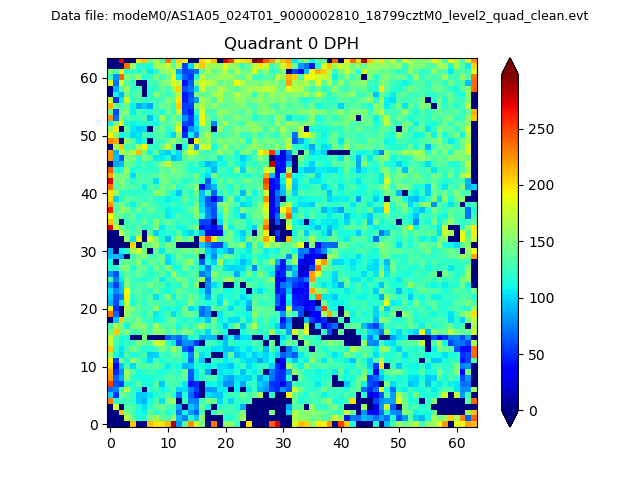 |
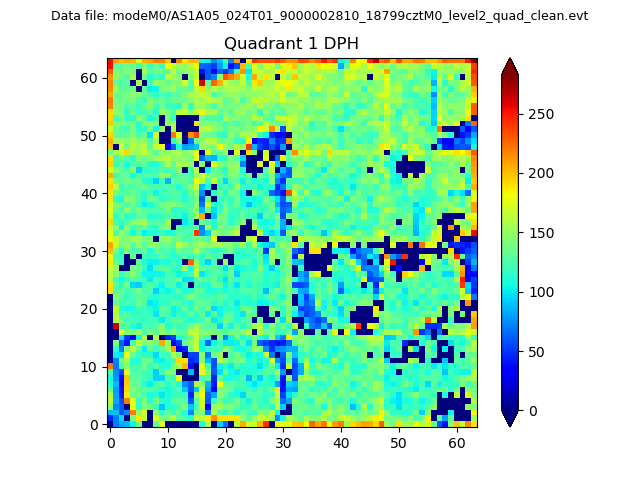 |
Quadrant B |
|---|---|---|---|
| Quadrant D | 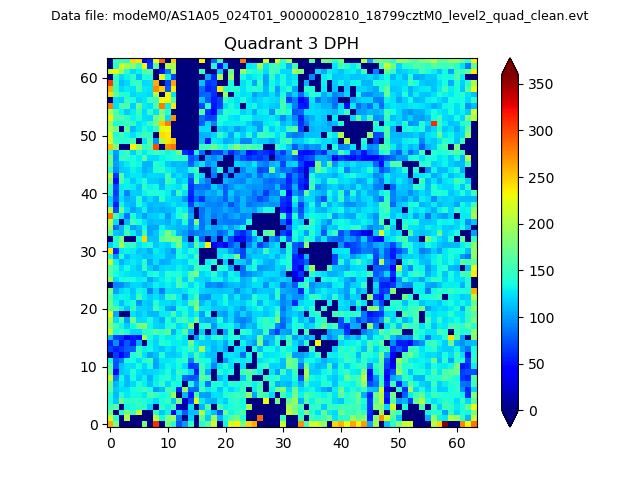 |
 |
Quadrant C |
| Plot type | Count rate plots | Images |
|---|---|---|
| Comparison with Poisson distribution Blue bars denote a histogram of data divided into 1 sec bins. Red curve is a Poisson curve with rate = median count rate of data. |
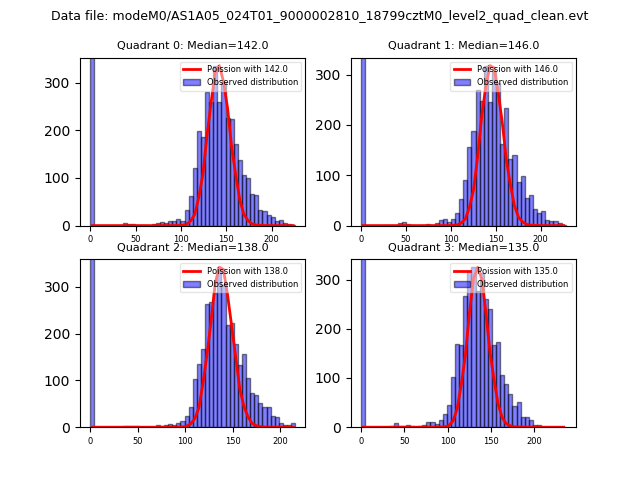 |
 |
| Quadrant-wise count rates Data is divided into 100 sec bins |
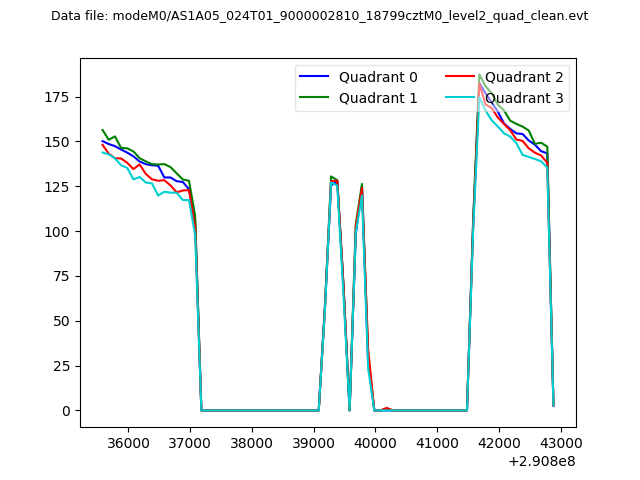 |
|
| Module-wise count rates for Quadrant A Data is divided into 100 sec bins |
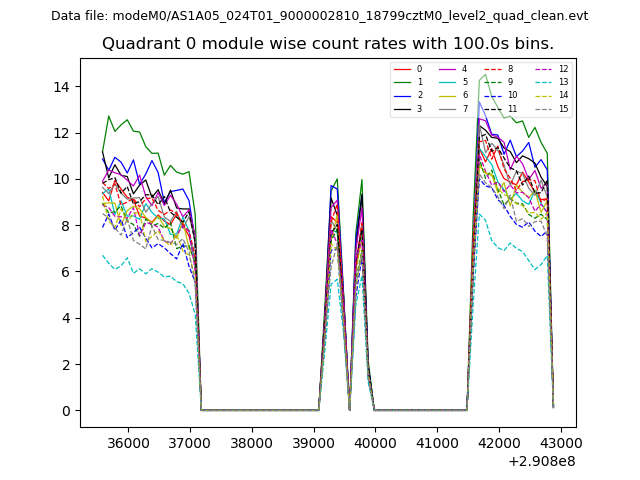 |
 |
| Module-wise count rates for Quadrant B Data is divided into 100 sec bins |
 |
 |
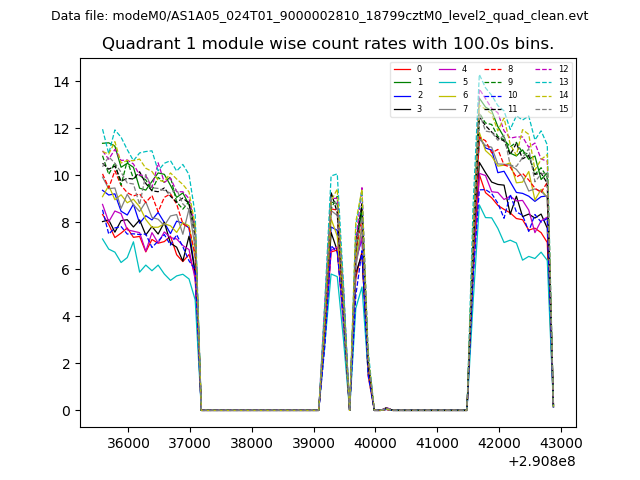
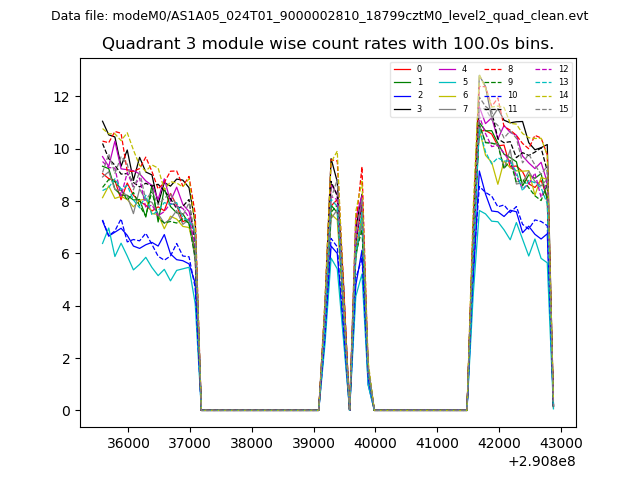
| Module-wise count rates for Quadrant C Data is divided into 100 sec bins |
 |
 |
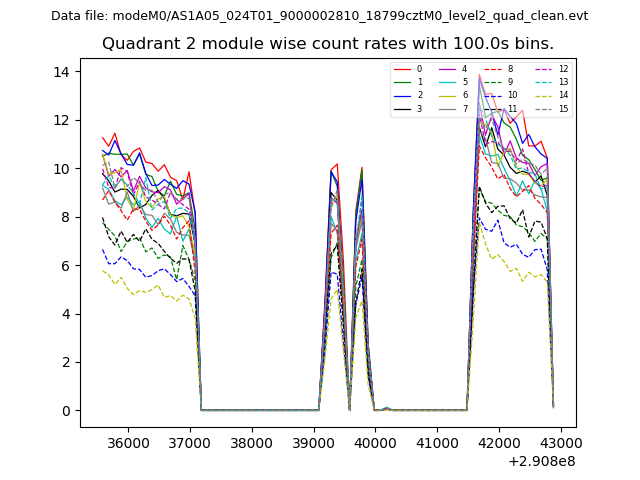
| Module-wise count rates for Quadrant D Data is divided into 100 sec bins |
 |
 |
| Parameter | Plot |
|---|---|
| CZT HV Monitor | 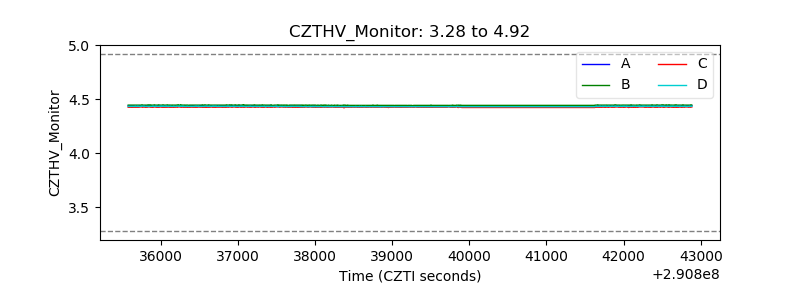 |
| D_VDD | 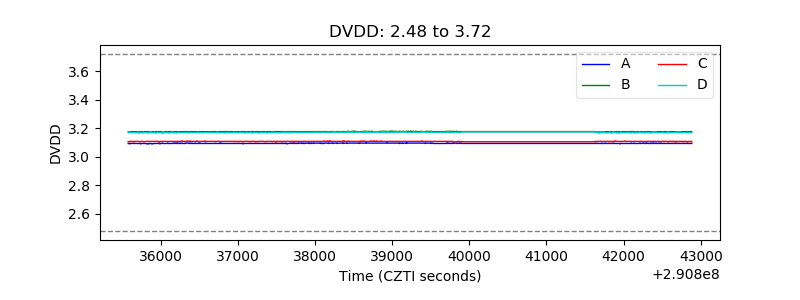 |
| Temperature 1 | 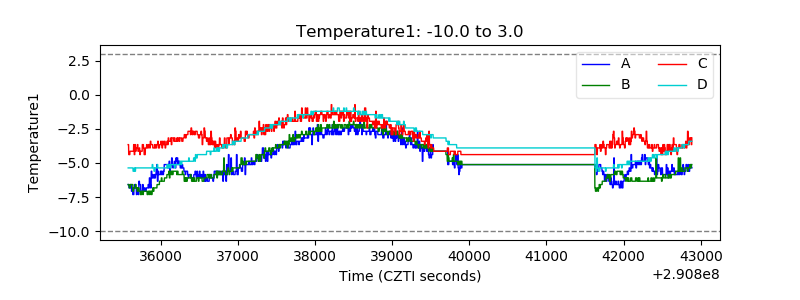 |
| Veto HV Monitor |  |
| Veto LLD | 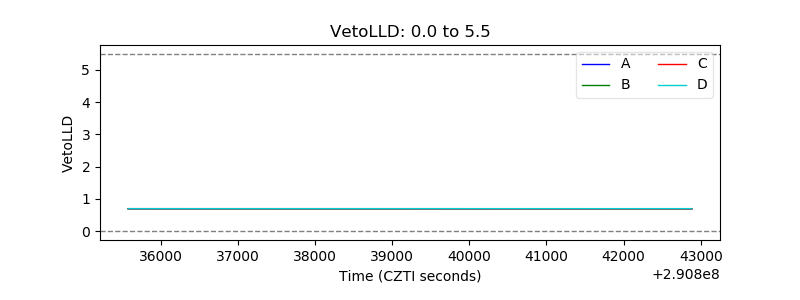 |
| Alpha Counter | 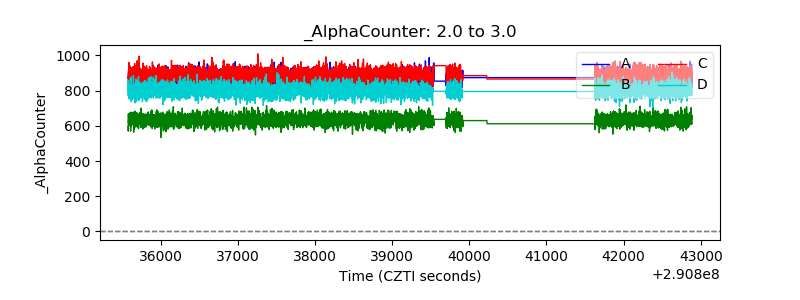 |
| _CPM_Rate | 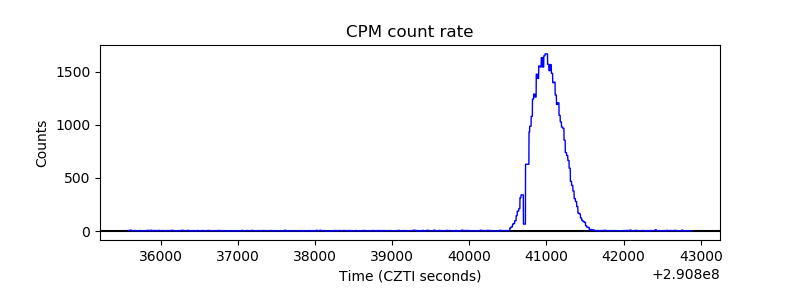 |
| CZT Counter | 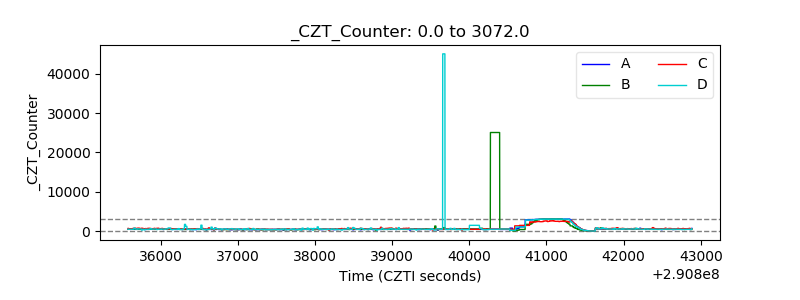 |
| +2.5 Volts monitor |  |
| +5 Volts monitor |  |
| _ROLL_ROT | 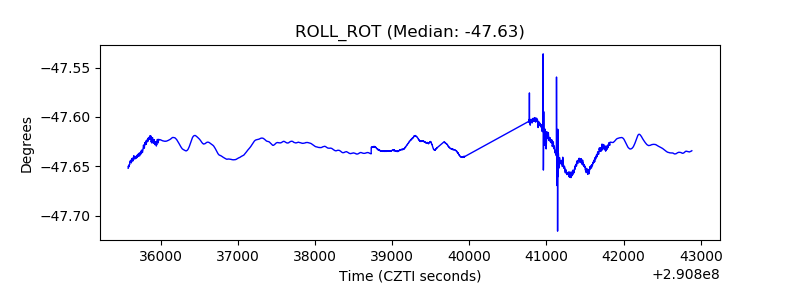 |
| _Roll_DEC | 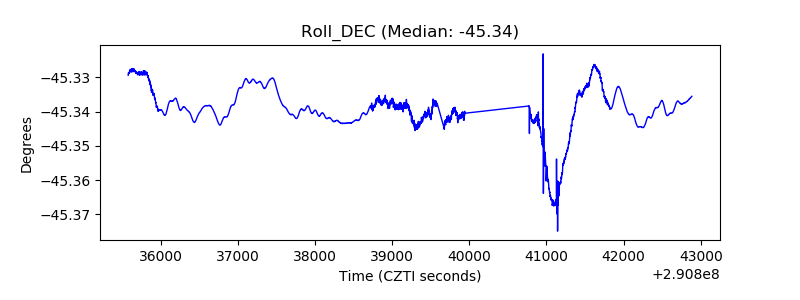 |
| _Roll_RA | 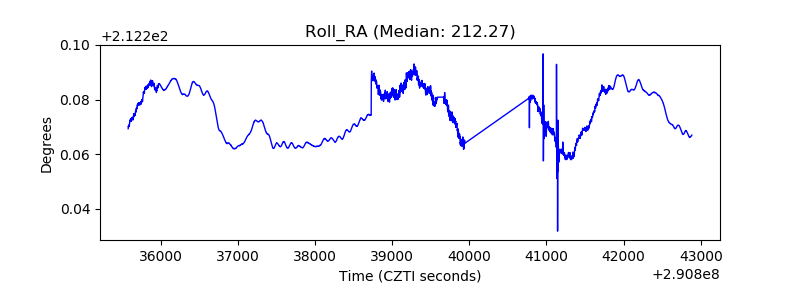 |
| Veto Counter | 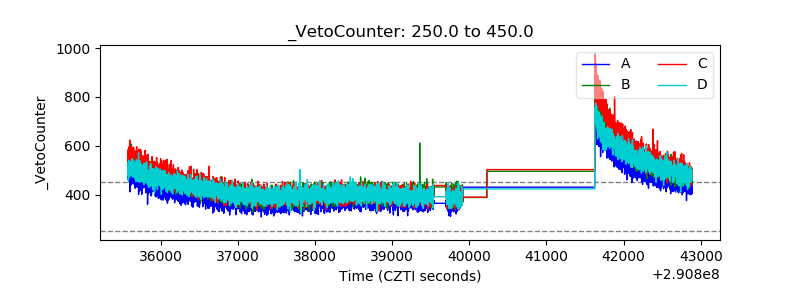 |