| Param | Original file | Final file |
|---|---|---|
| Filename | modeM0/AS1A05_024T01_9000002810_18800cztM0_level2.evt | modeM0/AS1A05_024T01_9000002810_18800cztM0_level2_quad_clean.evt |
| Size (bytes) | 472,106,880 | 84,504,960 |
| Size | 450.2 MB | 80.6 MB |
| Events in quadrant A | 2,982,298 | 543,646 |
| Events in quadrant B | 3,045,229 | 556,075 |
| Events in quadrant C | 3,390,778 | 531,943 |
| Events in quadrant D | 4,478,639 | 514,815 |
| Mode SS | |||
|---|---|---|---|
| Quadrant | BADHDUFLAG | Total packets | Discarded packets |
| A | 0 | 120 | 0 |
| B | 0 | 122 | 2 |
| C | 0 | 122 | 2 |
| D | 0 | 121 | 3 |
| Mode M9 | |||
|---|---|---|---|
| Quadrant | BADHDUFLAG | Total packets | Discarded packets |
| A | 0 | 13 | 1 |
| B | 0 | 12 | 0 |
| C | 0 | 12 | 0 |
| D | 0 | 12 | 0 |
| Mode M0 | |||
|---|---|---|---|
| Quadrant | BADHDUFLAG | Total packets | Discarded packets |
| A | 0 | 12532 | 75 |
| B | 0 | 12705 | 70 |
| C | 0 | 13929 | 97 |
| D | 0 | 17181 | 75 |
| Quadrant | Total seconds | Saturated seconds | Saturation percentage |
|---|---|---|---|
| A | 5902 | 60 | 1.016605% |
| B | 5913 | 64 | 1.082361% |
| C | 5907 | 108 | 1.828339% |
| D | 5911 | 450 | 7.612925% |
Noise dominated data is calculated using 1-second bins in cleaned event files. If a bin has >2000 counts, and if more than 50% of those come from <1% of pixels, then it is considered to be noise-dominated and hence unusable.
| Quadrant | # 1 sec bins | Bins with >0 counts | Bins with >2000 counts | High rate bins dominated by noise | Noise dominated (total time) | Noise dominated (detector-on time) | Marked lightcurve |
|---|---|---|---|---|---|---|---|
| A | 7094 | 5915 | 4 | 4 | 0.06% | 0.07% | 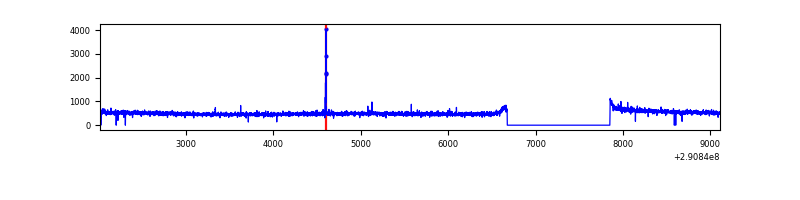 |
| B | 7093 | 5919 | 1 | 1 | 0.01% | 0.02% | 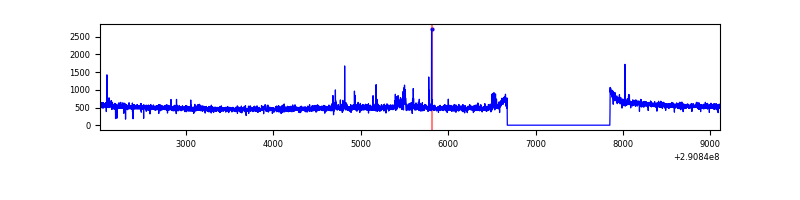 |
| C | 7093 | 5917 | 5 | 5 | 0.07% | 0.08% | 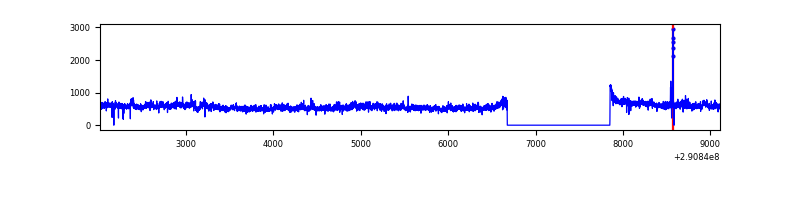 |
| D | 7093 | 5918 | 292 | 292 | 4.12% | 4.93% | 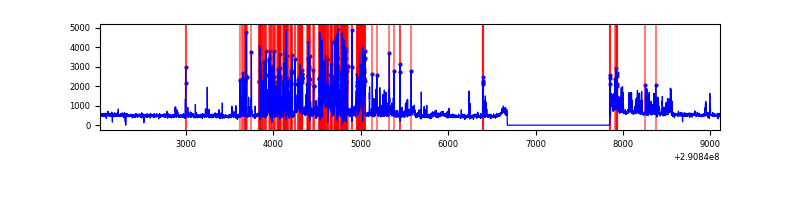 |
Top three noisy pixels from each quadrant. If the there are fewer than three noisy pixels in the level2.evt file, extra rows are filled as -1
| Pixel properties | Quadrant properties | ||||||
|---|---|---|---|---|---|---|---|
| Quadrant | DetID | PixID | Counts | Sigma | Mean | Median | Sigma |
| A | 6 | 16 | 15961 | 99.6 | 768 | 752 | 152.7 |
| A | 13 | 254 | 9709 | 58.66 | 768 | 752 | 152.7 |
| A | 11 | 29 | 7577 | 44.7 | 768 | 752 | 152.7 |
| B | 6 | 36 | 22676 | 152.93 | 762 | 744 | 143.4 |
| B | 0 | 230 | 17440 | 116.42 | 762 | 744 | 143.4 |
| B | 12 | 111 | 16690 | 111.19 | 762 | 744 | 143.4 |
| C | 3 | 233 | 325683 | 1880.8 | 747 | 754 | 172.8 |
| C | 14 | 238 | 116495 | 669.95 | 747 | 754 | 172.8 |
| C | 9 | 54 | 38193 | 216.71 | 747 | 754 | 172.8 |
| D | 5 | 222 | 1367979 | 7771.02 | 734 | 714 | 175.9 |
| D | 9 | 68 | 215940 | 1223.26 | 734 | 714 | 175.9 |
| D | 1 | 52 | 69968 | 393.61 | 734 | 714 | 175.9 |
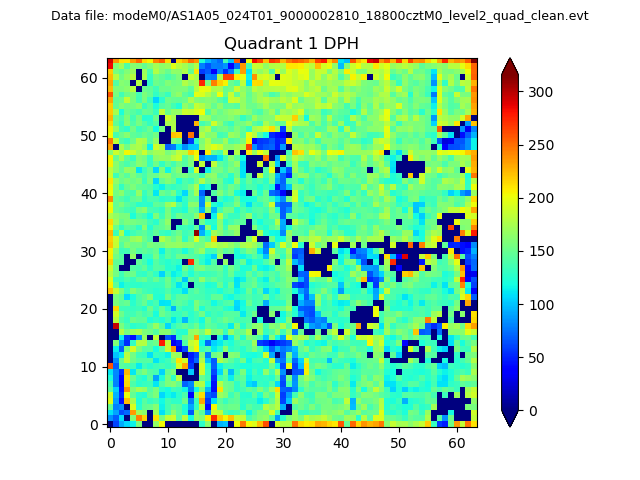
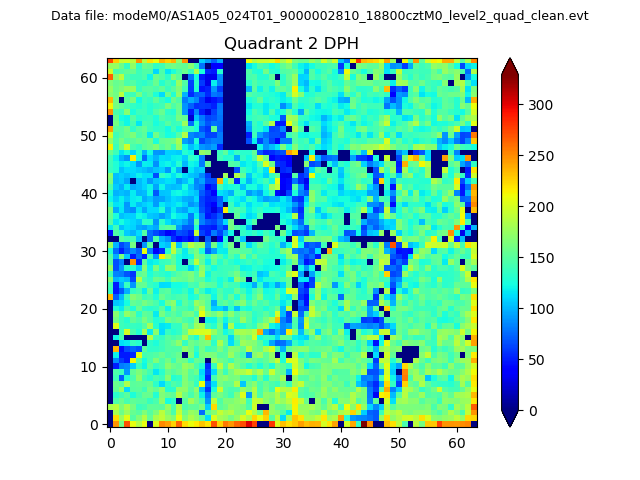
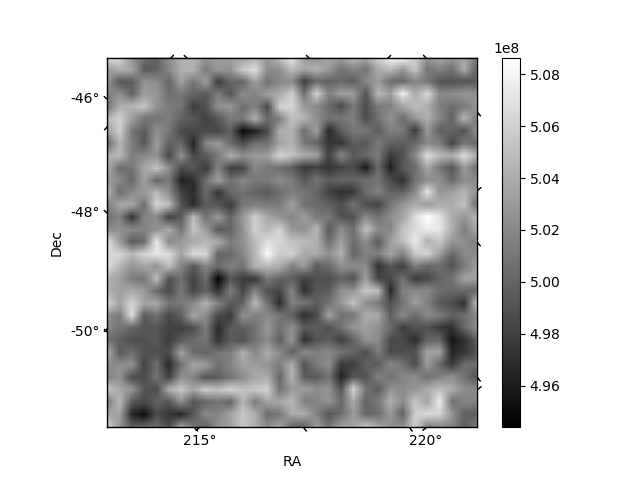
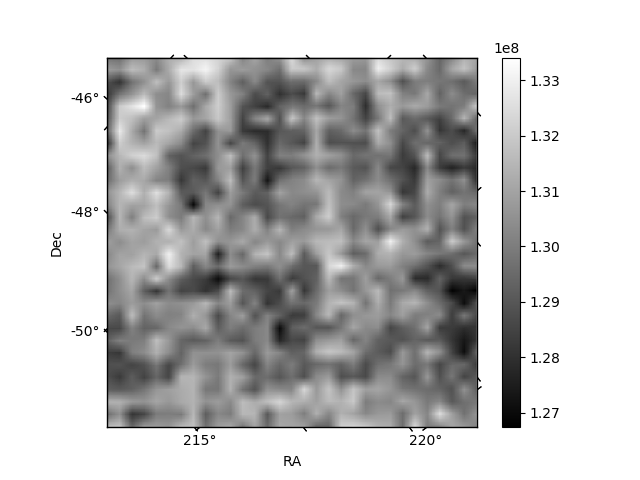
Histogram calculated using DETX and DETY for each event in the final _common_clean file
| Quadrant A |  |
 |
Quadrant B |
|---|---|---|---|
| Quadrant D | 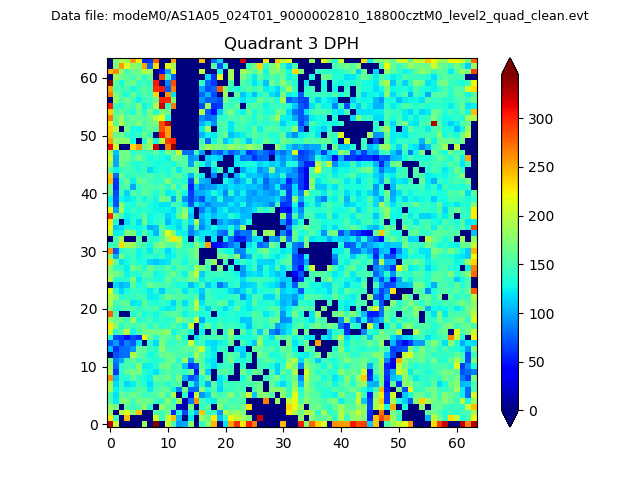 |
 |
Quadrant C |
| Plot type | Count rate plots | Images |
|---|---|---|
| Comparison with Poisson distribution Blue bars denote a histogram of data divided into 1 sec bins. Red curve is a Poisson curve with rate = median count rate of data. |
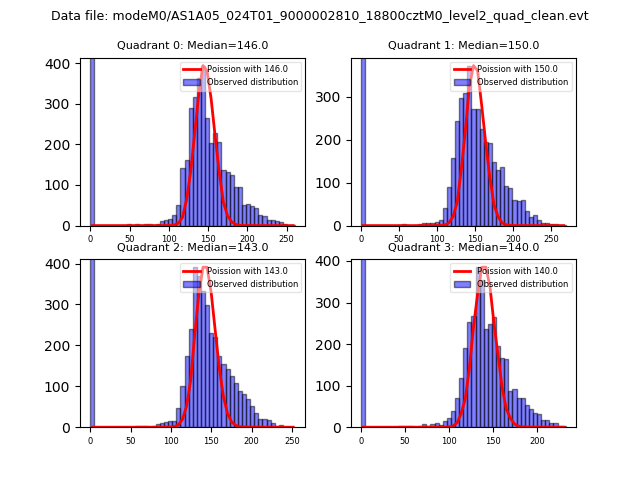 |
 |
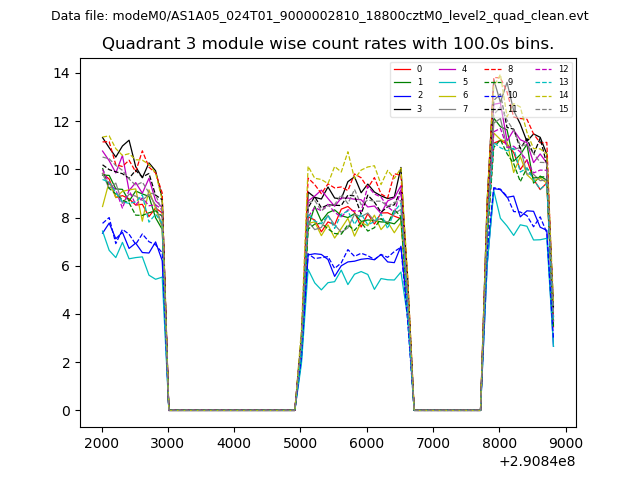
| Quadrant-wise count rates Data is divided into 100 sec bins |
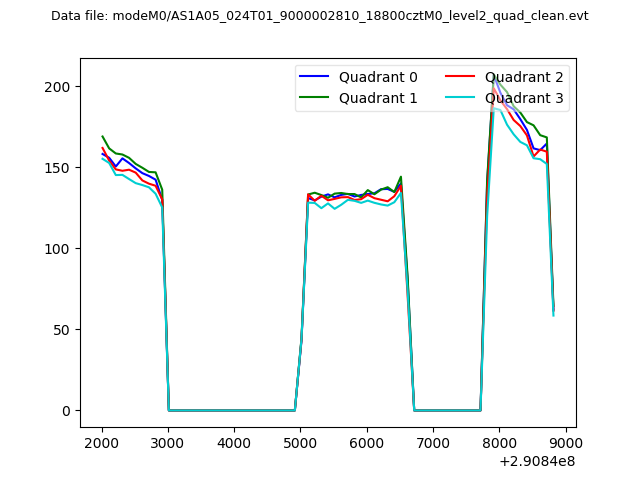 |
|
| Module-wise count rates for Quadrant A Data is divided into 100 sec bins |
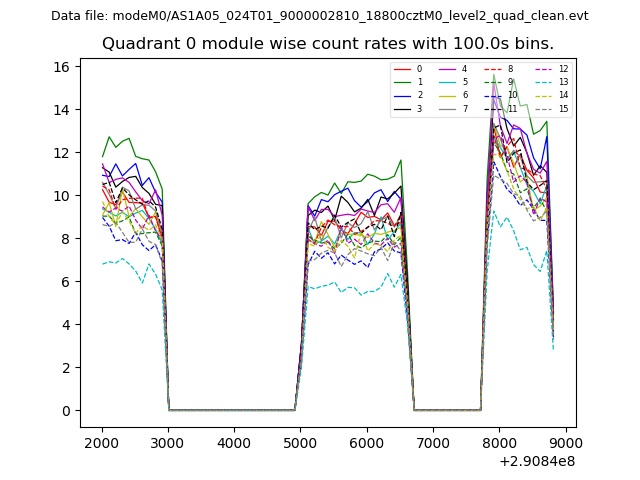 |
 |
| Module-wise count rates for Quadrant B Data is divided into 100 sec bins |
 |
 |
| Module-wise count rates for Quadrant C Data is divided into 100 sec bins |
 |
 |
| Module-wise count rates for Quadrant D Data is divided into 100 sec bins |
 |
 |
| Parameter | Plot |
|---|---|
| CZT HV Monitor |  |
| D_VDD | 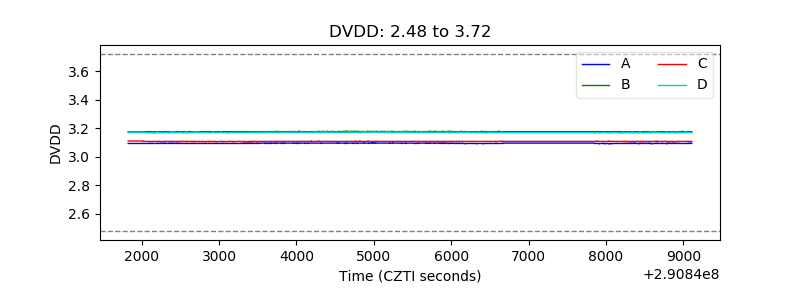 |
| Temperature 1 |  |
| Veto HV Monitor | 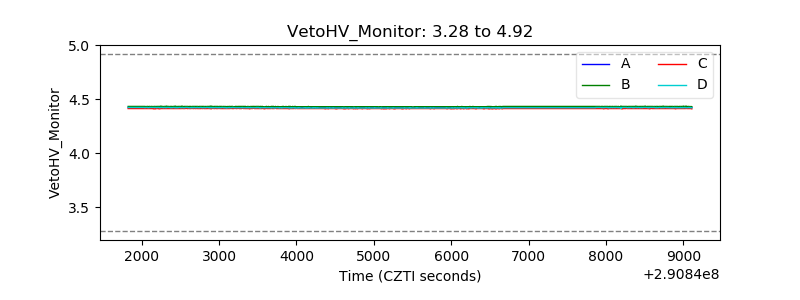 |
| Veto LLD | 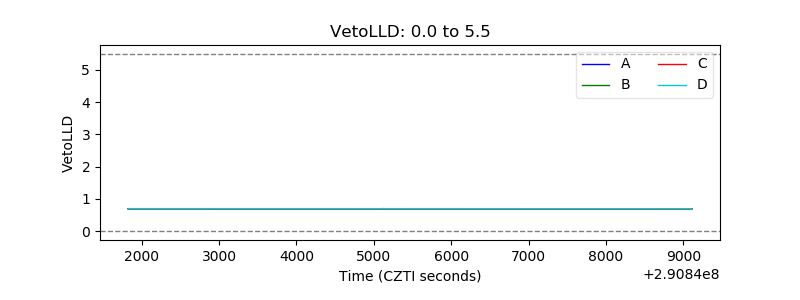 |
| Alpha Counter | 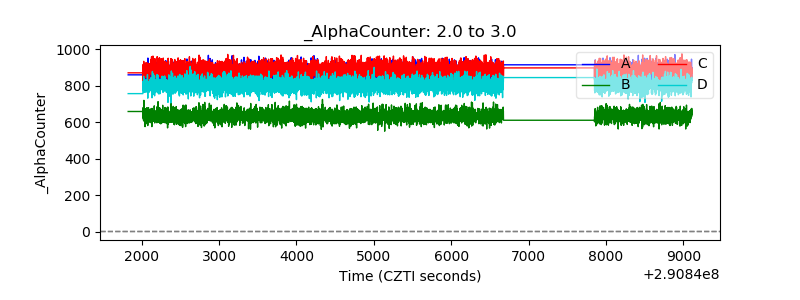 |
| _CPM_Rate | 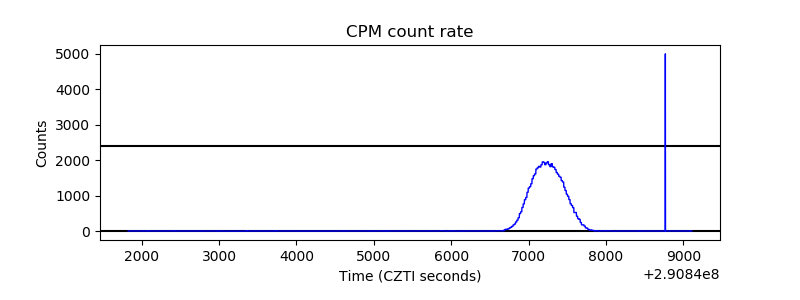 |
| CZT Counter | 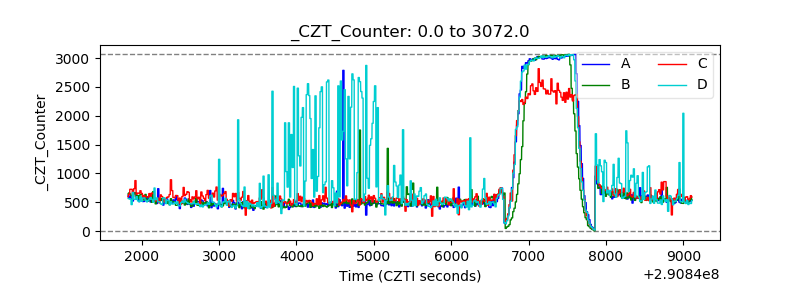 |
| +2.5 Volts monitor |  |
| +5 Volts monitor | 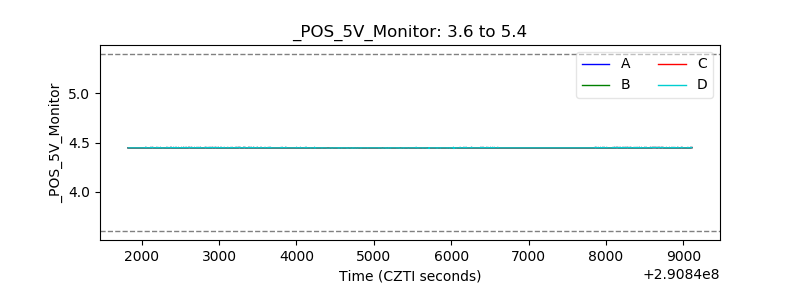 |
| _ROLL_ROT | 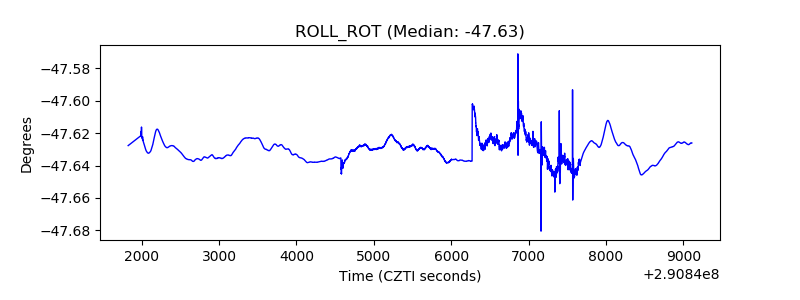 |
| _Roll_DEC | 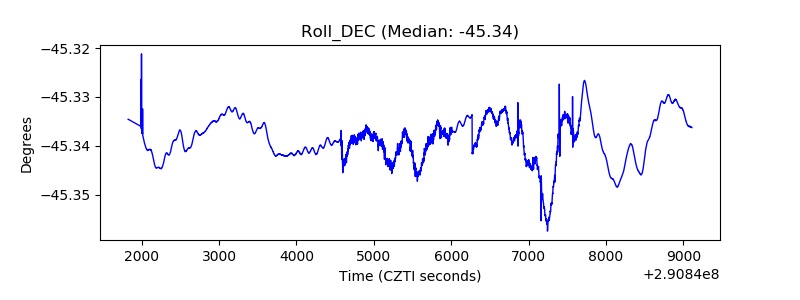 |
| _Roll_RA | 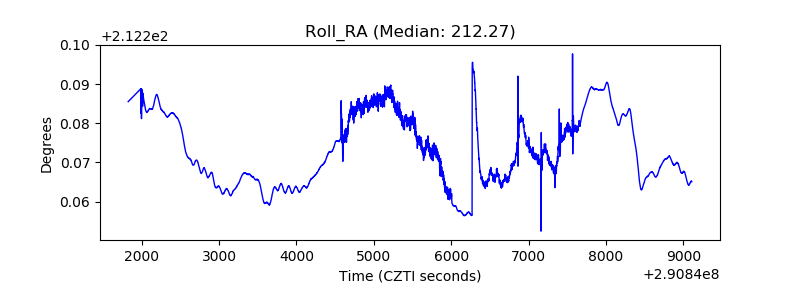 |
| Veto Counter | 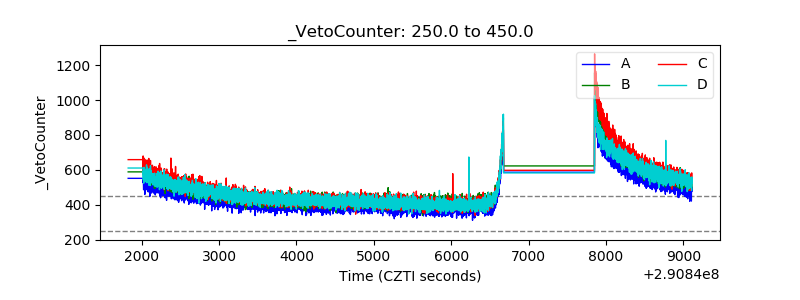 |