| Param | Original file | Final file |
|---|---|---|
| Filename | modeM0/AS1A05_024T01_9000002810_18802cztM0_level2.evt | modeM0/AS1A05_024T01_9000002810_18802cztM0_level2_quad_clean.evt |
| Size (bytes) | 493,554,240 | 73,045,440 |
| Size | 470.7 MB | 69.7 MB |
| Events in quadrant A | 3,359,999 | 453,080 |
| Events in quadrant B | 3,556,337 | 459,131 |
| Events in quadrant C | 3,507,054 | 440,240 |
| Events in quadrant D | 4,107,208 | 430,480 |
| Mode SS | |||
|---|---|---|---|
| Quadrant | BADHDUFLAG | Total packets | Discarded packets |
| A | 0 | 124 | 0 |
| B | 0 | 124 | 0 |
| C | 0 | 124 | 0 |
| D | 0 | 124 | 0 |
| Mode M9 | |||
|---|---|---|---|
| Quadrant | BADHDUFLAG | Total packets | Discarded packets |
| A | 0 | 13 | 0 |
| B | 0 | 13 | 0 |
| C | 0 | 13 | 0 |
| D | 0 | 13 | 0 |
| Mode M0 | |||
|---|---|---|---|
| Quadrant | BADHDUFLAG | Total packets | Discarded packets |
| A | 0 | 13682 | 1 |
| B | 0 | 14315 | 1 |
| C | 0 | 14227 | 2 |
| D | 0 | 16153 | 1 |
| Quadrant | Total seconds | Saturated seconds | Saturation percentage |
|---|---|---|---|
| A | 6145 | 130 | 2.115541% |
| B | 6146 | 161 | 2.619590% |
| C | 6145 | 161 | 2.620016% |
| D | 6145 | 273 | 4.442636% |
Noise dominated data is calculated using 1-second bins in cleaned event files. If a bin has >2000 counts, and if more than 50% of those come from <1% of pixels, then it is considered to be noise-dominated and hence unusable.
| Quadrant | # 1 sec bins | Bins with >0 counts | Bins with >2000 counts | High rate bins dominated by noise | Noise dominated (total time) | Noise dominated (detector-on time) | Marked lightcurve |
|---|---|---|---|---|---|---|---|
| A | 7400 | 6146 | 0 | 0 | 0.00% | 0.00% | 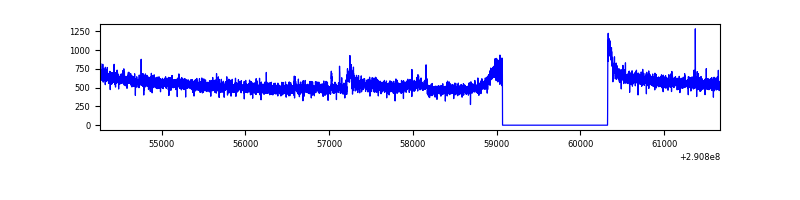 |
| B | 7401 | 6147 | 14 | 14 | 0.19% | 0.23% | 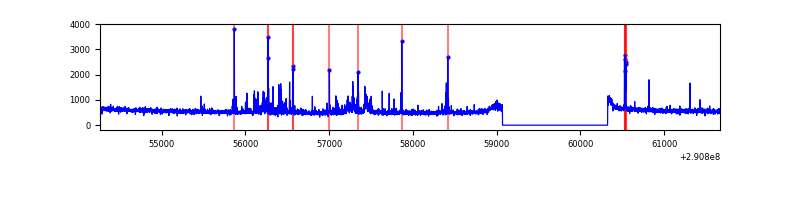 |
| C | 7400 | 6146 | 1 | 1 | 0.01% | 0.02% | 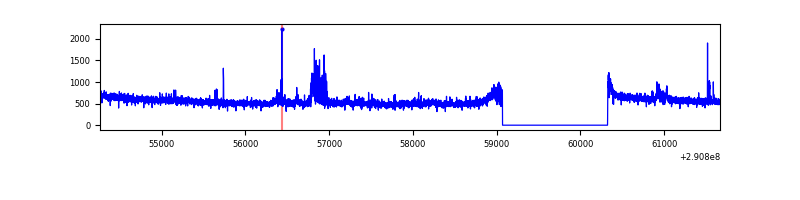 |
| D | 7400 | 6146 | 148 | 148 | 2.00% | 2.41% | 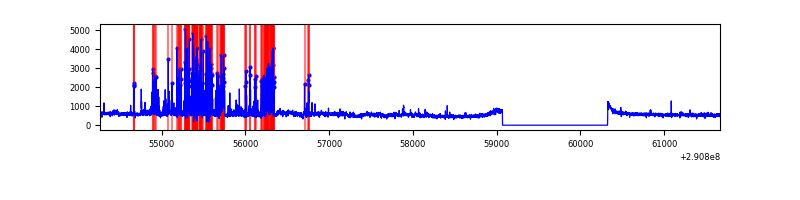 |
Top three noisy pixels from each quadrant. If the there are fewer than three noisy pixels in the level2.evt file, extra rows are filled as -1
| Pixel properties | Quadrant properties | ||||||
|---|---|---|---|---|---|---|---|
| Quadrant | DetID | PixID | Counts | Sigma | Mean | Median | Sigma |
| A | 15 | 191 | 64285 | 376.75 | 854 | 838 | 168.4 |
| A | 13 | 254 | 10195 | 55.56 | 854 | 838 | 168.4 |
| A | 0 | 226 | 7681 | 40.63 | 854 | 838 | 168.4 |
| B | 7 | 220 | 105614 | 674.41 | 841 | 821 | 155.4 |
| B | 6 | 36 | 70319 | 447.27 | 841 | 821 | 155.4 |
| B | 0 | 189 | 17879 | 109.78 | 841 | 821 | 155.4 |
| C | 3 | 233 | 174665 | 929.14 | 817 | 823 | 187.1 |
| C | 14 | 238 | 129817 | 689.44 | 817 | 823 | 187.1 |
| C | 9 | 54 | 10433 | 51.36 | 817 | 823 | 187.1 |
| D | 5 | 222 | 473608 | 2433.88 | 822 | 801 | 194.3 |
| D | 1 | 52 | 472250 | 2426.89 | 822 | 801 | 194.3 |
| D | 7 | 238 | 45808 | 231.68 | 822 | 801 | 194.3 |
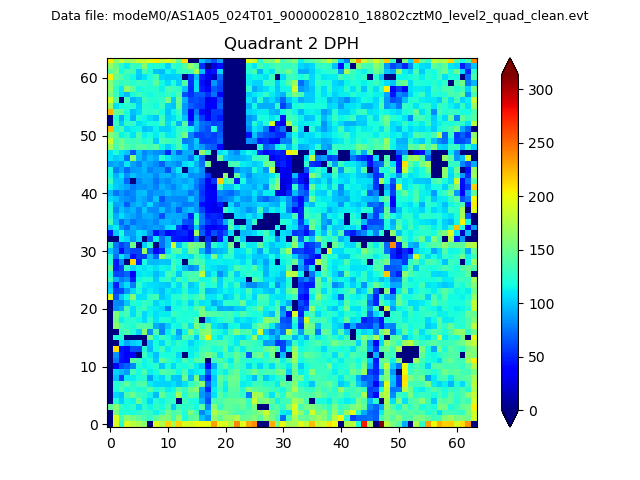
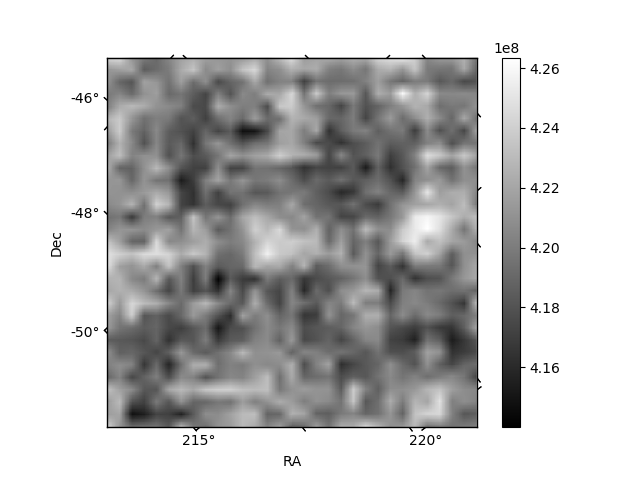
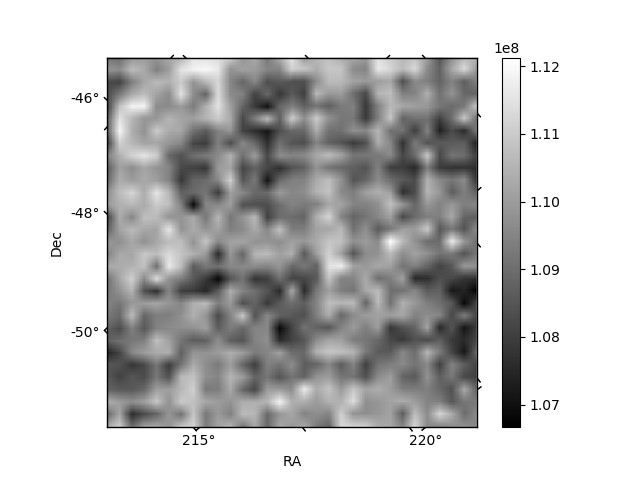
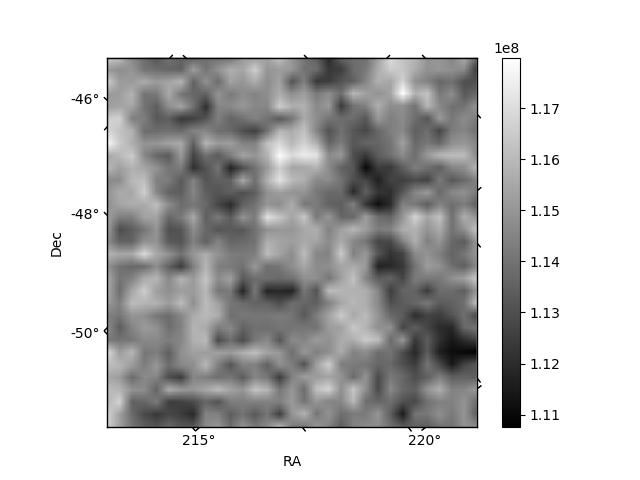
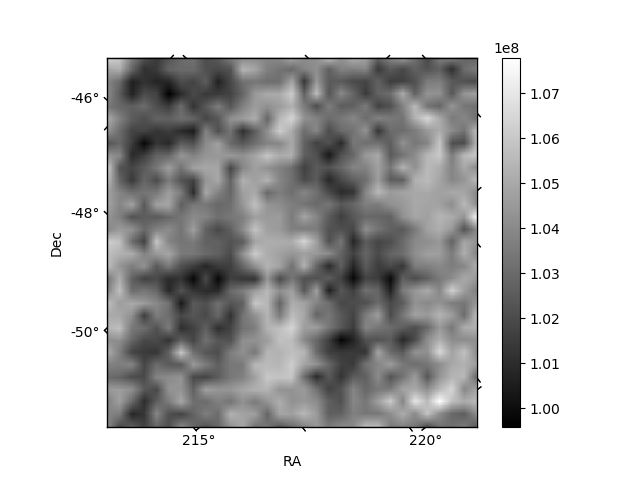
Histogram calculated using DETX and DETY for each event in the final _common_clean file
| Quadrant A | 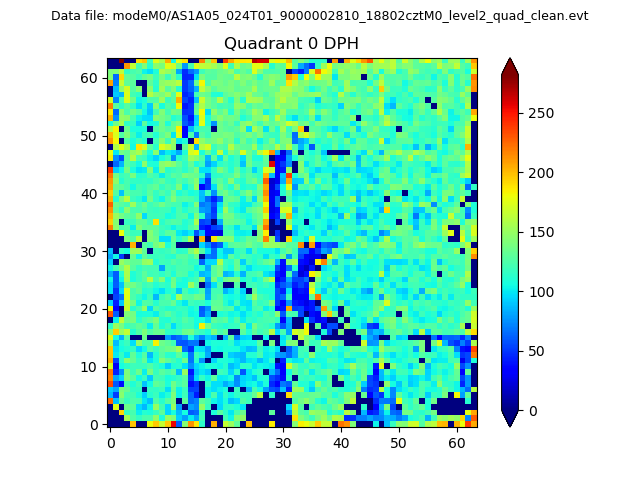 |
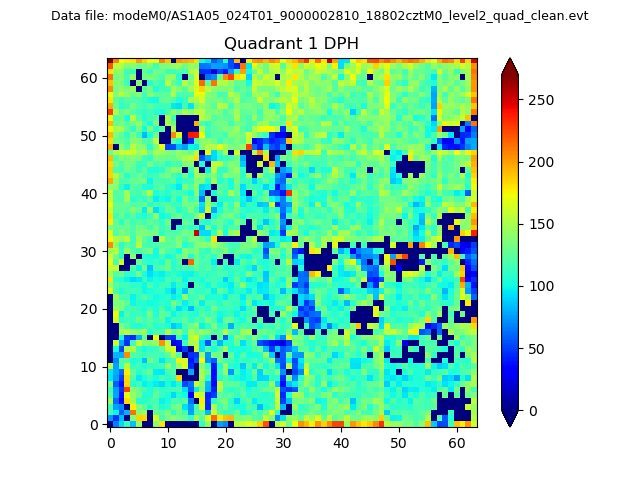 |
Quadrant B |
|---|---|---|---|
| Quadrant D | 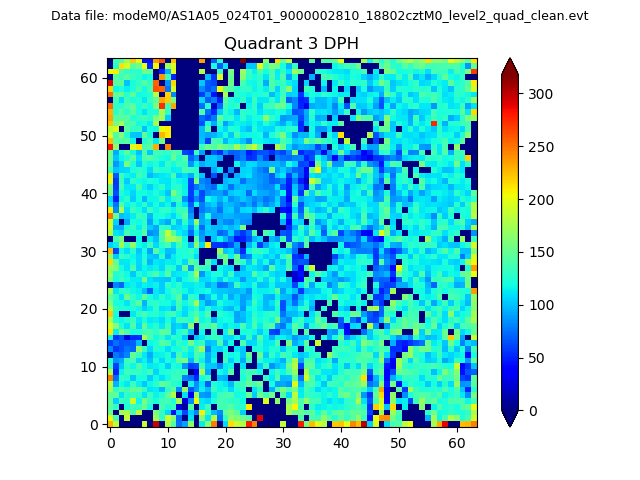 |
 |
Quadrant C |
| Plot type | Count rate plots | Images |
|---|---|---|
| Comparison with Poisson distribution Blue bars denote a histogram of data divided into 1 sec bins. Red curve is a Poisson curve with rate = median count rate of data. |
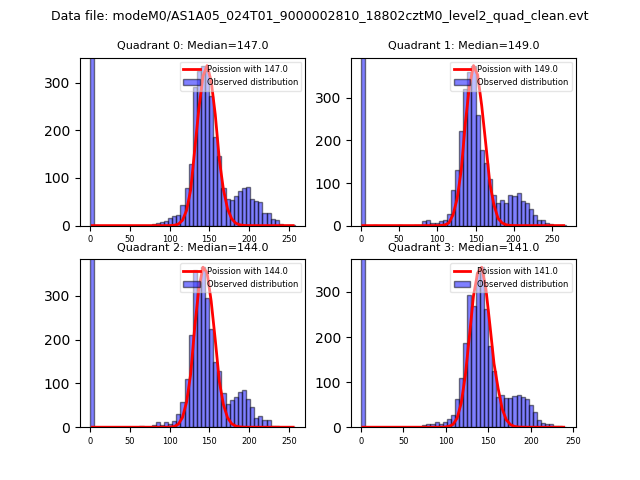 |
 |
| Quadrant-wise count rates Data is divided into 100 sec bins |
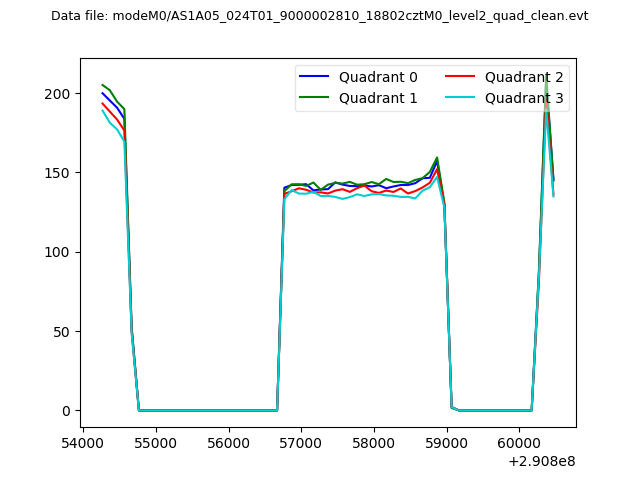 |
|
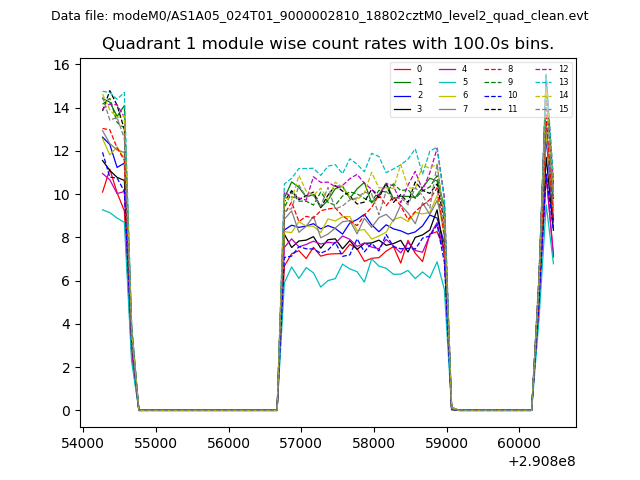
| Module-wise count rates for Quadrant A Data is divided into 100 sec bins |
 |
 |
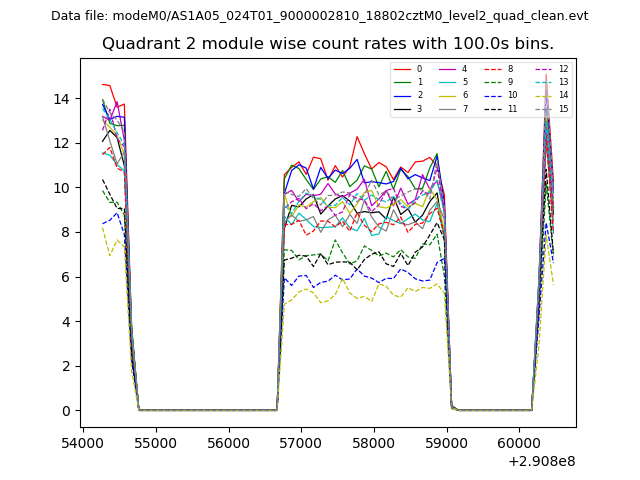
| Module-wise count rates for Quadrant B Data is divided into 100 sec bins |
 |
 |
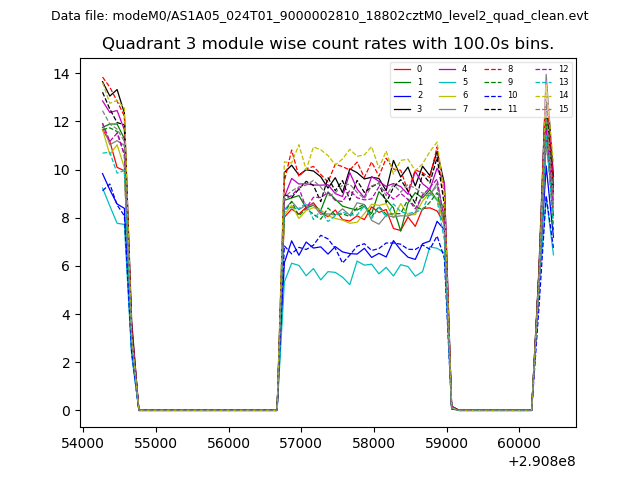
| Module-wise count rates for Quadrant C Data is divided into 100 sec bins |
 |
 |
| Module-wise count rates for Quadrant D Data is divided into 100 sec bins |
 |
 |
| Parameter | Plot |
|---|---|
| CZT HV Monitor | 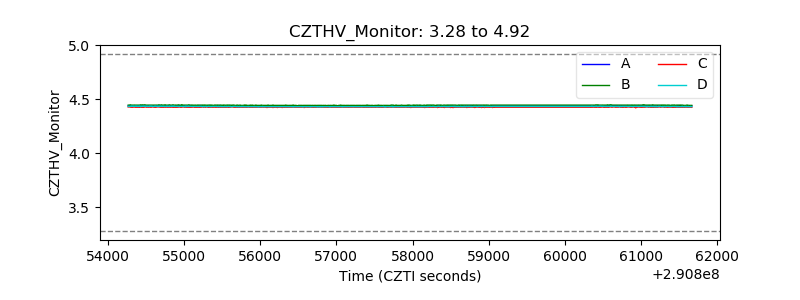 |
| D_VDD | 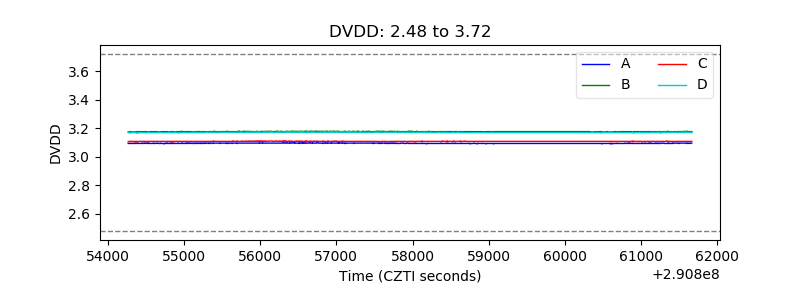 |
| Temperature 1 | 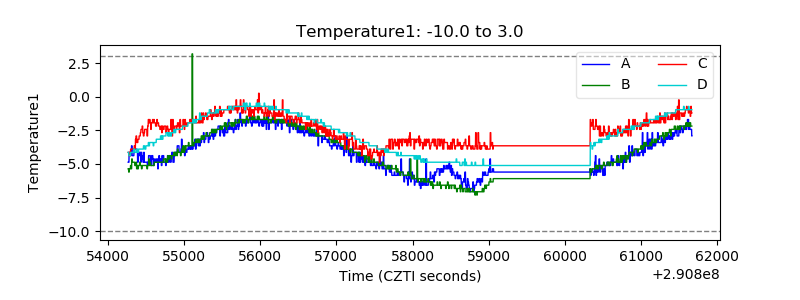 |
| Veto HV Monitor | 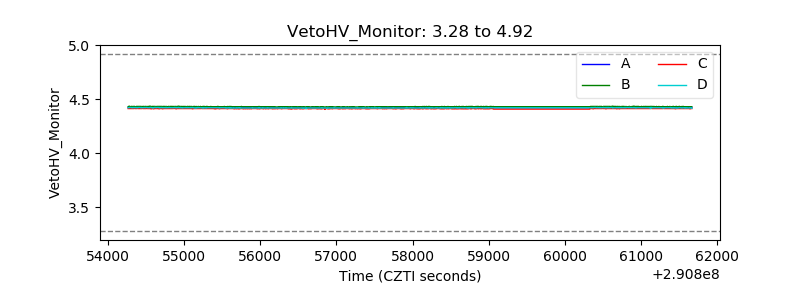 |
| Veto LLD | 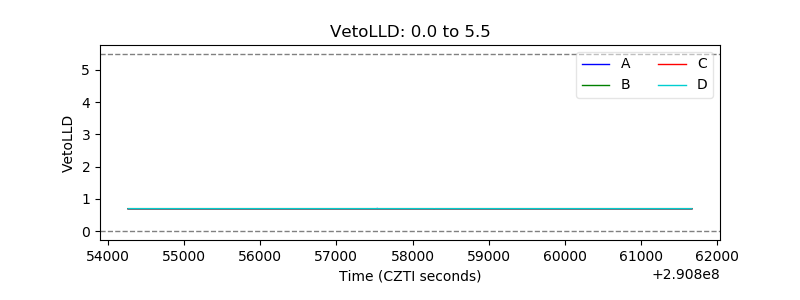 |
| Alpha Counter | 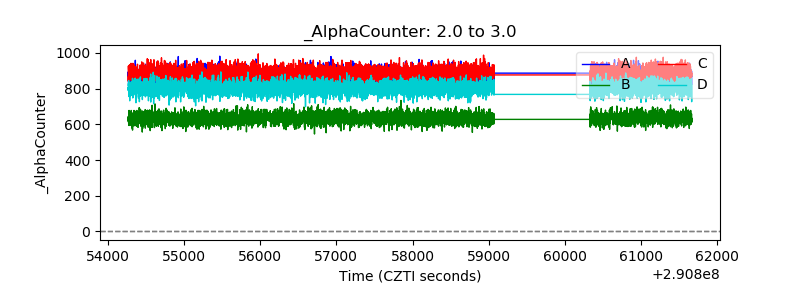 |
| _CPM_Rate | 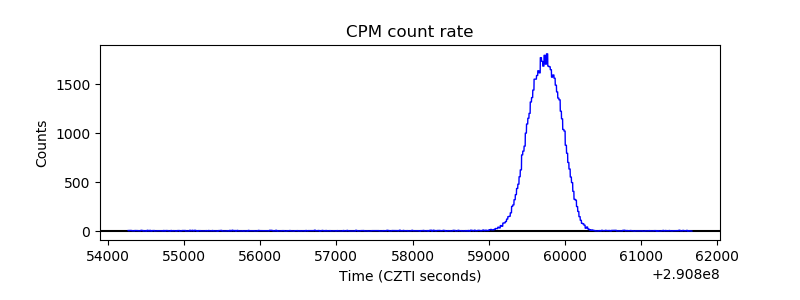 |
| CZT Counter | 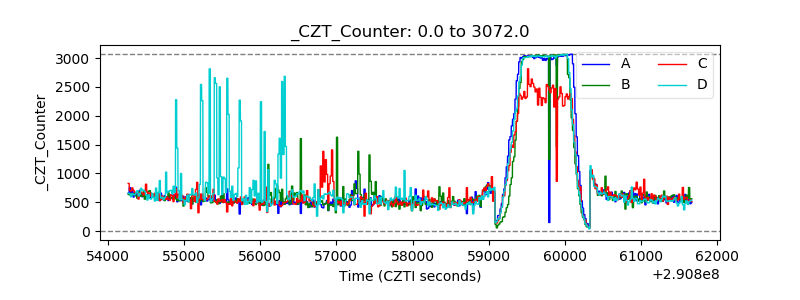 |
| +2.5 Volts monitor |  |
| +5 Volts monitor |  |
| _ROLL_ROT |  |
| _Roll_DEC |  |
| _Roll_RA | 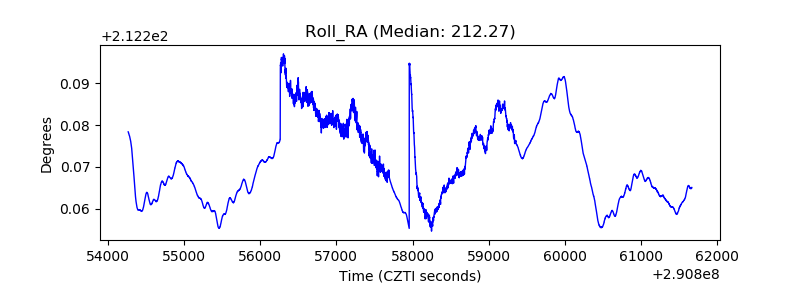 |
| Veto Counter | 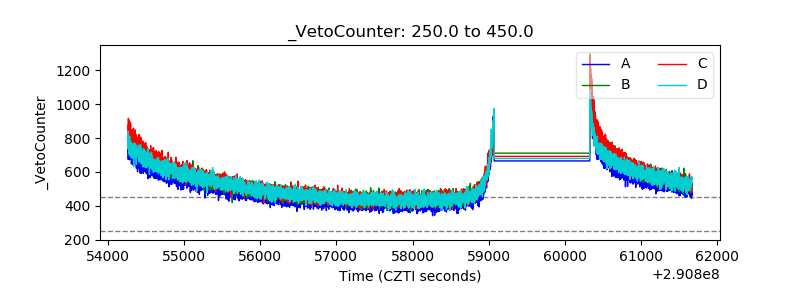 |