| Param | Original file | Final file |
|---|---|---|
| Filename | modeM0/AS1A05_024T01_9000002810_18804cztM0_level2.evt | modeM0/AS1A05_024T01_9000002810_18804cztM0_level2_quad_clean.evt |
| Size (bytes) | 499,466,880 | 76,570,560 |
| Size | 476.3 MB | 73.0 MB |
| Events in quadrant A | 3,427,058 | 471,357 |
| Events in quadrant B | 3,541,911 | 476,467 |
| Events in quadrant C | 3,496,452 | 454,749 |
| Events in quadrant D | 4,203,930 | 447,113 |
| Mode SS | |||
|---|---|---|---|
| Quadrant | BADHDUFLAG | Total packets | Discarded packets |
| A | 0 | 136 | 0 |
| B | 0 | 136 | 0 |
| C | 0 | 136 | 0 |
| D | 0 | 136 | 0 |
| Mode M9 | |||
|---|---|---|---|
| Quadrant | BADHDUFLAG | Total packets | Discarded packets |
| A | 0 | 13 | 0 |
| B | 0 | 14 | 0 |
| C | 0 | 14 | 0 |
| D | 0 | 14 | 0 |
| Mode M0 | |||
|---|---|---|---|
| Quadrant | BADHDUFLAG | Total packets | Discarded packets |
| A | 0 | 14246 | 2 |
| B | 0 | 14502 | 2 |
| C | 0 | 14497 | 2 |
| D | 0 | 16851 | 2 |
| Quadrant | Total seconds | Saturated seconds | Saturation percentage |
|---|---|---|---|
| A | 6729 | 132 | 1.961658% |
| B | 6729 | 137 | 2.035964% |
| C | 6729 | 135 | 2.006242% |
| D | 6729 | 467 | 6.940110% |
Noise dominated data is calculated using 1-second bins in cleaned event files. If a bin has >2000 counts, and if more than 50% of those come from <1% of pixels, then it is considered to be noise-dominated and hence unusable.
| Quadrant | # 1 sec bins | Bins with >0 counts | Bins with >2000 counts | High rate bins dominated by noise | Noise dominated (total time) | Noise dominated (detector-on time) | Marked lightcurve |
|---|---|---|---|---|---|---|---|
| A | 7789 | 6730 | 0 | 0 | 0.00% | 0.00% | 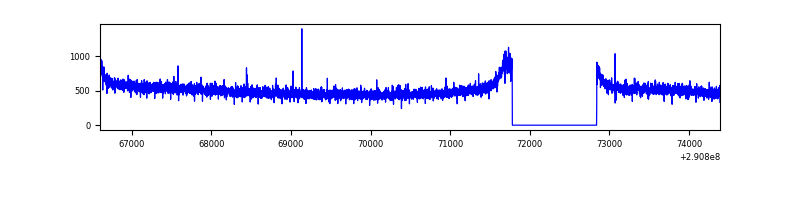 |
| B | 7789 | 6730 | 1 | 1 | 0.01% | 0.01% | 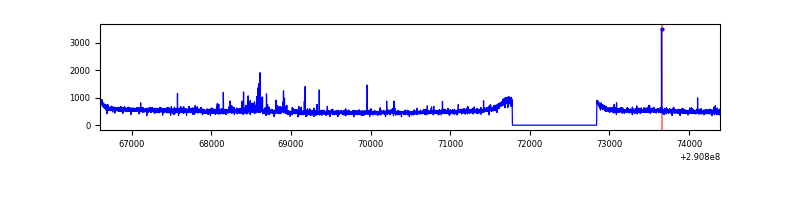 |
| C | 7789 | 6730 | 0 | 0 | 0.00% | 0.00% | 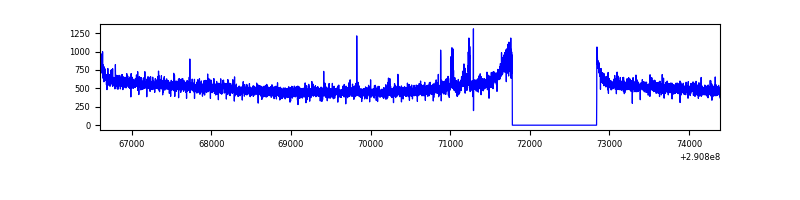 |
| D | 7789 | 6730 | 243 | 243 | 3.12% | 3.61% | 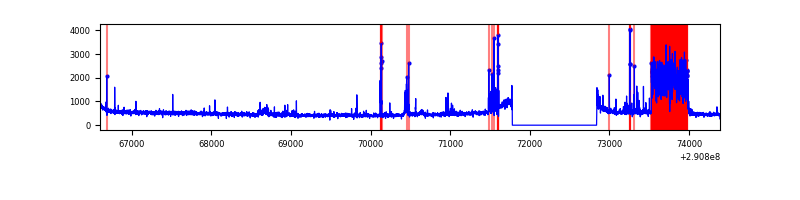 |
Top three noisy pixels from each quadrant. If the there are fewer than three noisy pixels in the level2.evt file, extra rows are filled as -1
| Pixel properties | Quadrant properties | ||||||
|---|---|---|---|---|---|---|---|
| Quadrant | DetID | PixID | Counts | Sigma | Mean | Median | Sigma |
| A | 11 | 29 | 13135 | 69.41 | 883 | 865 | 176.8 |
| A | 13 | 254 | 11389 | 59.53 | 883 | 865 | 176.8 |
| A | 0 | 226 | 7839 | 39.45 | 883 | 865 | 176.8 |
| B | 6 | 36 | 45935 | 274.52 | 876 | 856 | 164.2 |
| B | 12 | 111 | 19268 | 112.13 | 876 | 856 | 164.2 |
| B | 7 | 220 | 17581 | 101.85 | 876 | 856 | 164.2 |
| C | 14 | 238 | 131265 | 666.63 | 843 | 850 | 195.6 |
| C | 3 | 233 | 77393 | 391.26 | 843 | 850 | 195.6 |
| C | 13 | 61 | 6023 | 26.44 | 843 | 850 | 195.6 |
| D | 1 | 52 | 891591 | 4371.98 | 846 | 823 | 203.7 |
| D | 7 | 223 | 58305 | 282.13 | 846 | 823 | 203.7 |
| D | 7 | 238 | 34064 | 163.15 | 846 | 823 | 203.7 |
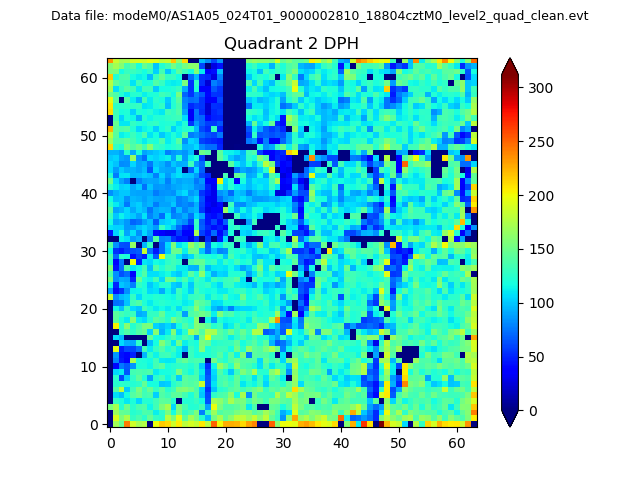
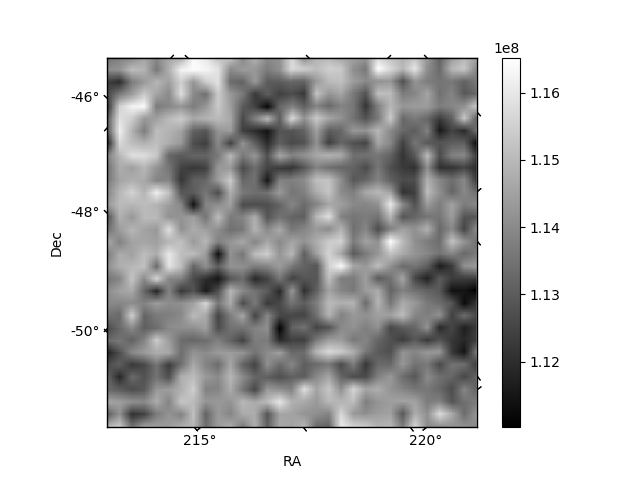
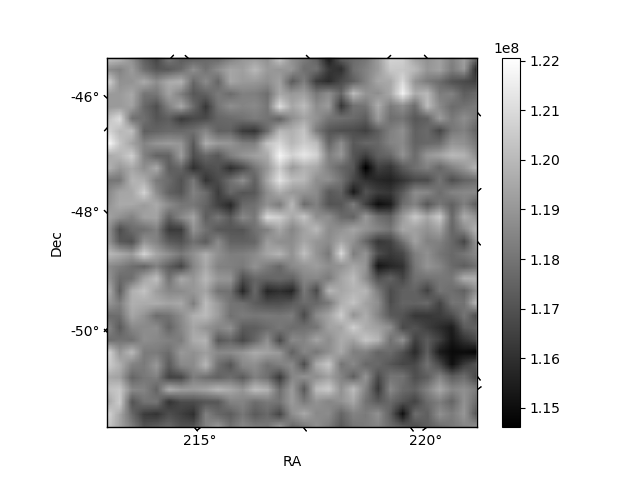
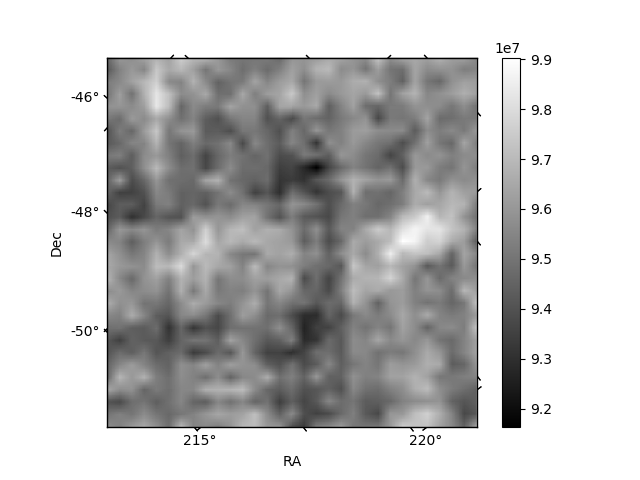
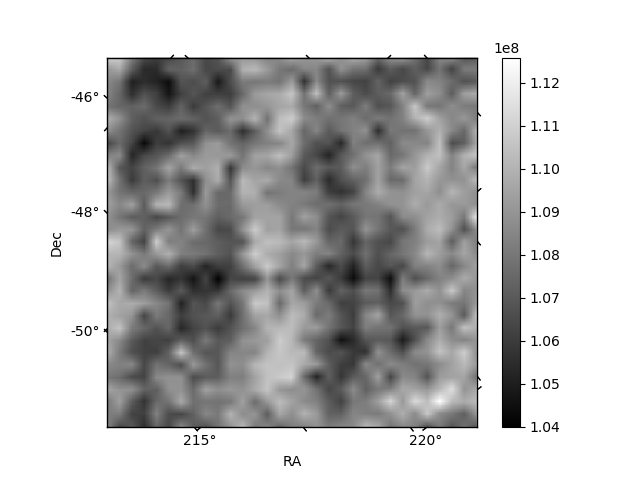
Histogram calculated using DETX and DETY for each event in the final _common_clean file
| Quadrant A | 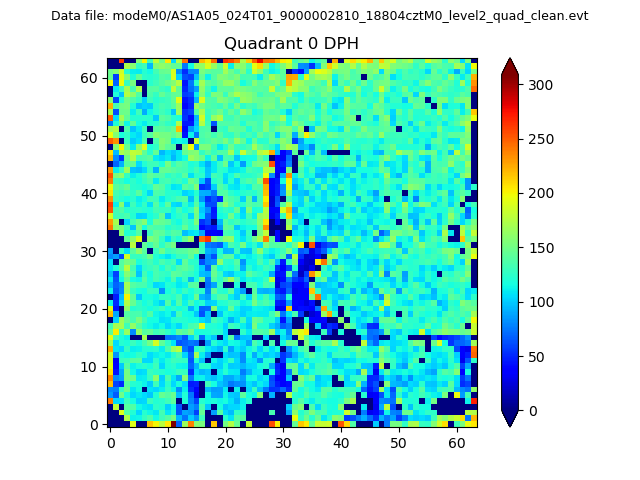 |
 |
Quadrant B |
|---|---|---|---|
| Quadrant D |  |
 |
Quadrant C |
| Plot type | Count rate plots | Images |
|---|---|---|
| Comparison with Poisson distribution Blue bars denote a histogram of data divided into 1 sec bins. Red curve is a Poisson curve with rate = median count rate of data. |
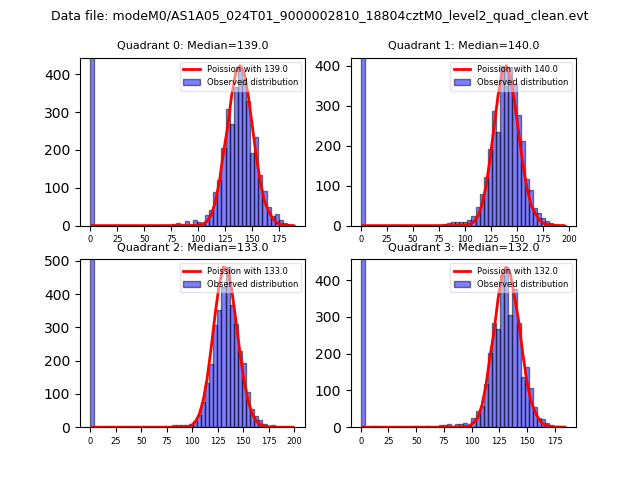 |
 |
| Quadrant-wise count rates Data is divided into 100 sec bins |
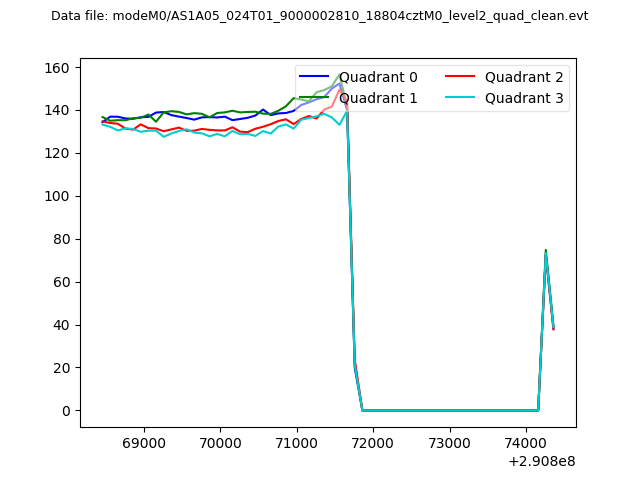 |
|
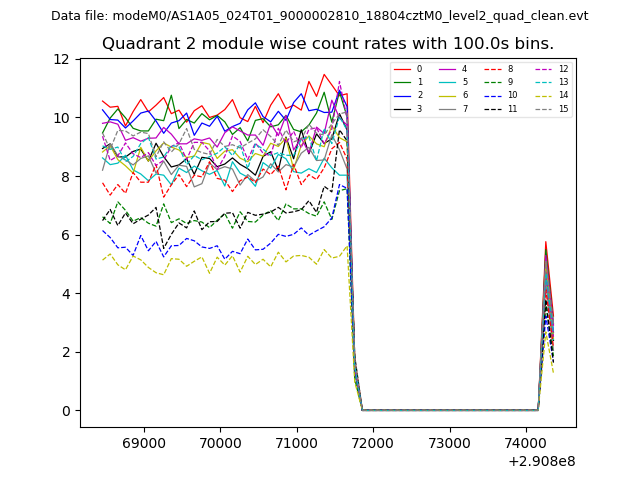
| Module-wise count rates for Quadrant A Data is divided into 100 sec bins |
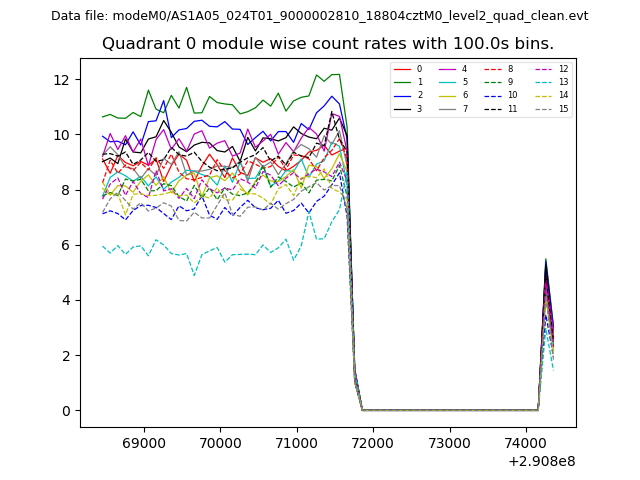 |
 |
| Module-wise count rates for Quadrant B Data is divided into 100 sec bins |
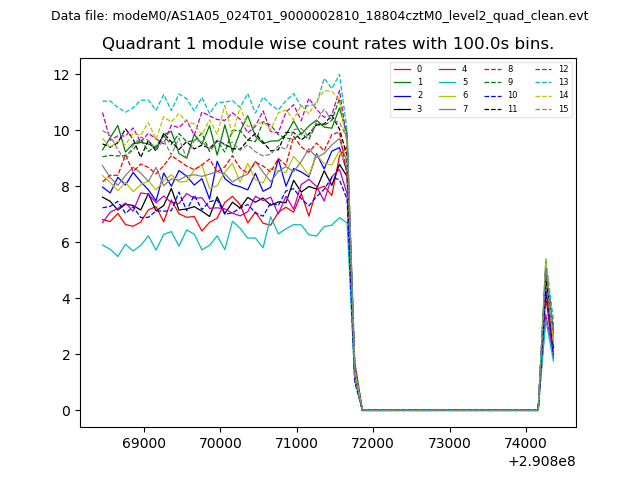 |
 |
| Module-wise count rates for Quadrant C Data is divided into 100 sec bins |
 |
 |
| Module-wise count rates for Quadrant D Data is divided into 100 sec bins |
 |
 |
| Parameter | Plot |
|---|---|
| CZT HV Monitor | 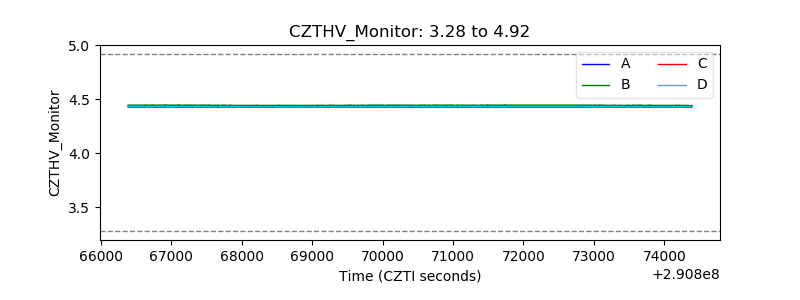 |
| D_VDD | 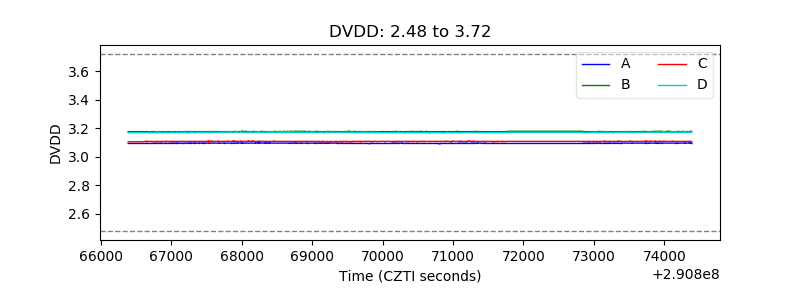 |
| Temperature 1 | 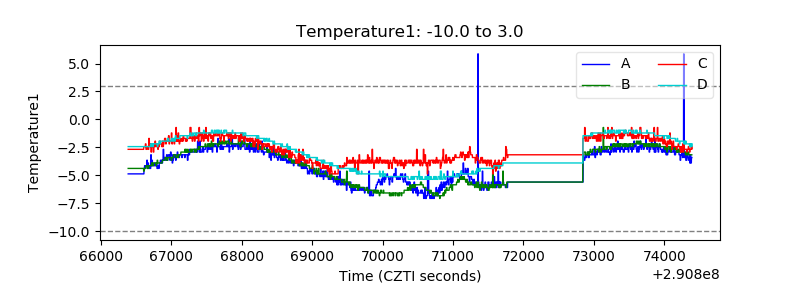 |
| Veto HV Monitor | 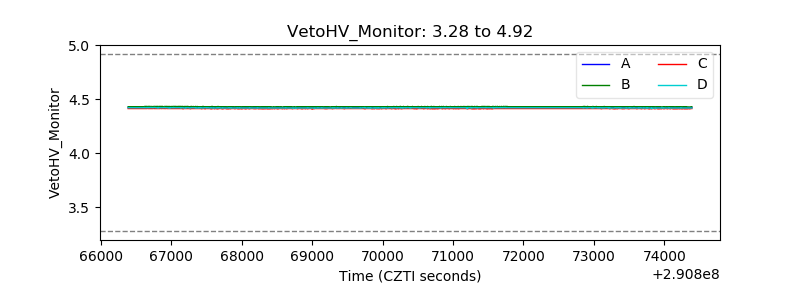 |
| Veto LLD | 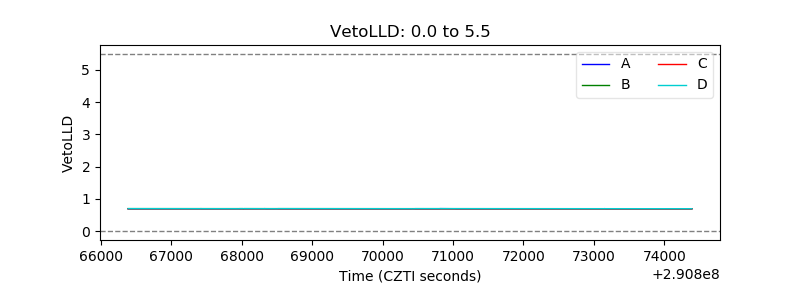 |
| Alpha Counter | 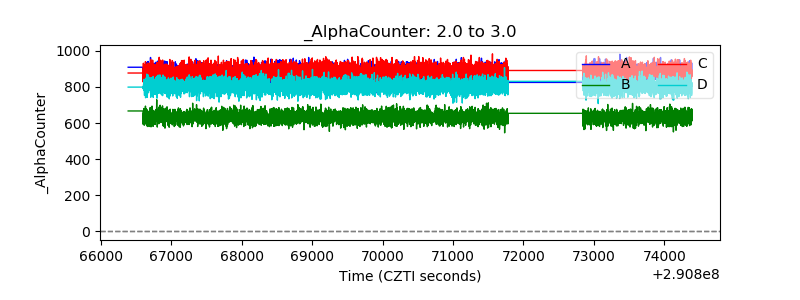 |
| _CPM_Rate | 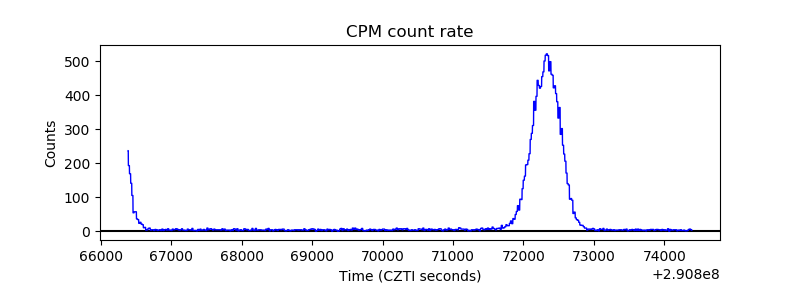 |
| CZT Counter | 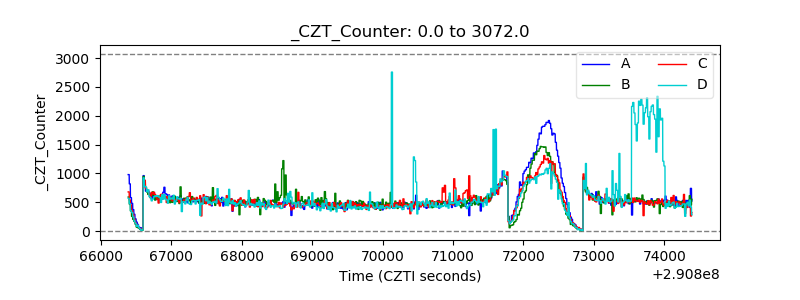 |
| +2.5 Volts monitor |  |
| +5 Volts monitor |  |
| _ROLL_ROT | 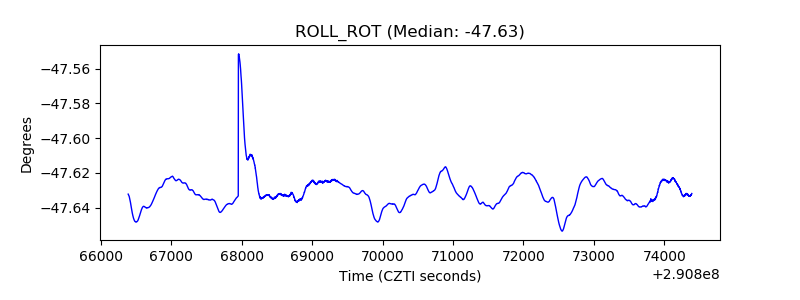 |
| _Roll_DEC | 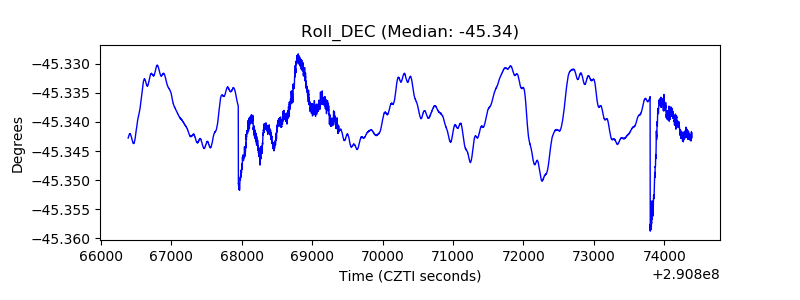 |
| _Roll_RA | 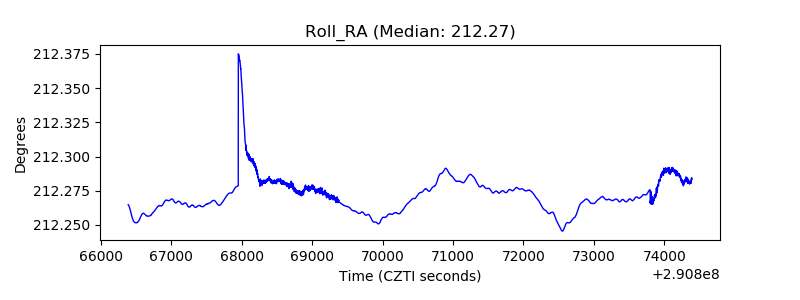 |
| Veto Counter | 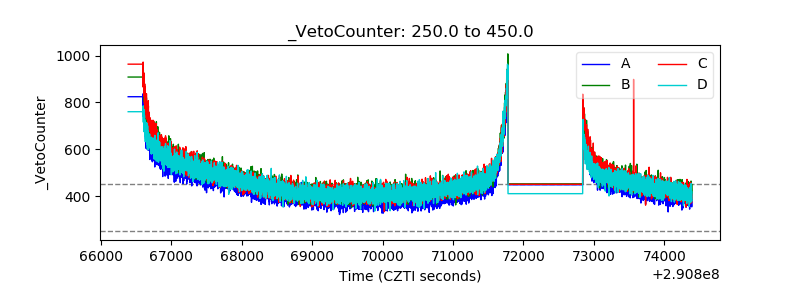 |