| Param | Original file | Final file |
|---|---|---|
| Filename | modeM0/AS1A05_024T01_9000002810_18806cztM0_level2.evt | modeM0/AS1A05_024T01_9000002810_18806cztM0_level2_quad_clean.evt |
| Size (bytes) | 127,719,360 | 20,448,000 |
| Size | 121.8 MB | 19.5 MB |
| Events in quadrant A | 928,770 | 119,889 |
| Events in quadrant B | 982,892 | 121,541 |
| Events in quadrant C | 931,995 | 117,524 |
| Events in quadrant D | 887,717 | 116,462 |
| Mode SS | |||
|---|---|---|---|
| Quadrant | BADHDUFLAG | Total packets | Discarded packets |
| A | 0 | 40 | 0 |
| B | 0 | 40 | 0 |
| C | 0 | 40 | 0 |
| D | 0 | 40 | 0 |
| Mode M0 | |||
|---|---|---|---|
| Quadrant | BADHDUFLAG | Total packets | Discarded packets |
| A | 0 | 3987 | 0 |
| B | 0 | 4106 | 0 |
| C | 0 | 4005 | 0 |
| D | 0 | 3963 | 0 |
| Quadrant | Total seconds | Saturated seconds | Saturation percentage |
|---|---|---|---|
| A | 1964 | 6 | 0.305499% |
| B | 1965 | 4 | 0.203562% |
| C | 1965 | 13 | 0.661578% |
| D | 1965 | 0 | 0.000000% |
Noise dominated data is calculated using 1-second bins in cleaned event files. If a bin has >2000 counts, and if more than 50% of those come from <1% of pixels, then it is considered to be noise-dominated and hence unusable.
| Quadrant | # 1 sec bins | Bins with >0 counts | Bins with >2000 counts | High rate bins dominated by noise | Noise dominated (total time) | Noise dominated (detector-on time) | Marked lightcurve |
|---|---|---|---|---|---|---|---|
| A | 1964 | 1964 | 0 | 0 | 0.00% | 0.00% | 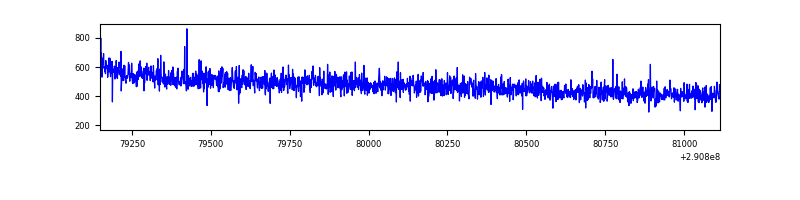 |
| B | 1965 | 1965 | 1 | 1 | 0.05% | 0.05% | 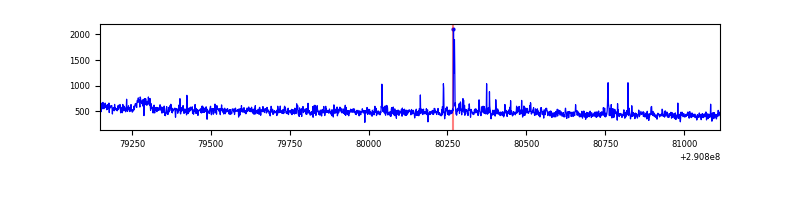 |
| C | 1965 | 1965 | 1 | 1 | 0.05% | 0.05% | 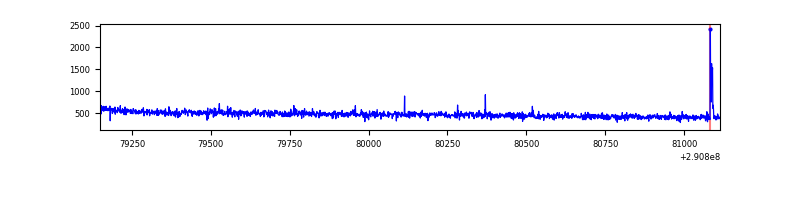 |
| D | 1965 | 1965 | 0 | 0 | 0.00% | 0.00% | 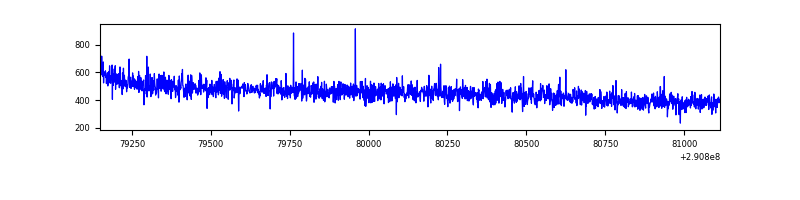 |
Top three noisy pixels from each quadrant. If the there are fewer than three noisy pixels in the level2.evt file, extra rows are filled as -1
| Pixel properties | Quadrant properties | ||||||
|---|---|---|---|---|---|---|---|
| Quadrant | DetID | PixID | Counts | Sigma | Mean | Median | Sigma |
| A | 13 | 254 | 3146 | 57.68 | 240 | 234 | 50.5 |
| A | 8 | 144 | 2359 | 42.09 | 240 | 234 | 50.5 |
| A | 0 | 226 | 2171 | 38.37 | 240 | 234 | 50.5 |
| B | 6 | 36 | 13897 | 289.75 | 238 | 232 | 47.2 |
| B | 7 | 220 | 12610 | 262.46 | 238 | 232 | 47.2 |
| B | 0 | 197 | 11128 | 231.04 | 238 | 232 | 47.2 |
| C | 14 | 238 | 35258 | 645.59 | 226 | 226 | 54.3 |
| C | 9 | 54 | 11331 | 204.65 | 226 | 226 | 54.3 |
| C | 3 | 233 | 4491 | 78.6 | 226 | 226 | 54.3 |
| D | 2 | 234 | 9412 | 156.64 | 230 | 223 | 58.7 |
| D | 7 | 238 | 7211 | 119.12 | 230 | 223 | 58.7 |
| D | 14 | 34 | 4923 | 80.12 | 230 | 223 | 58.7 |
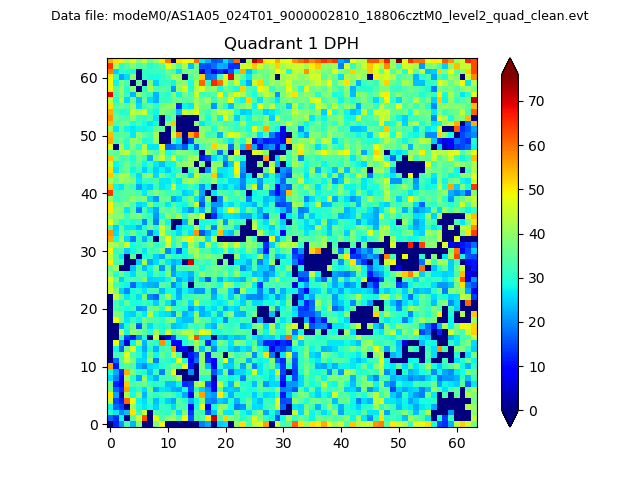
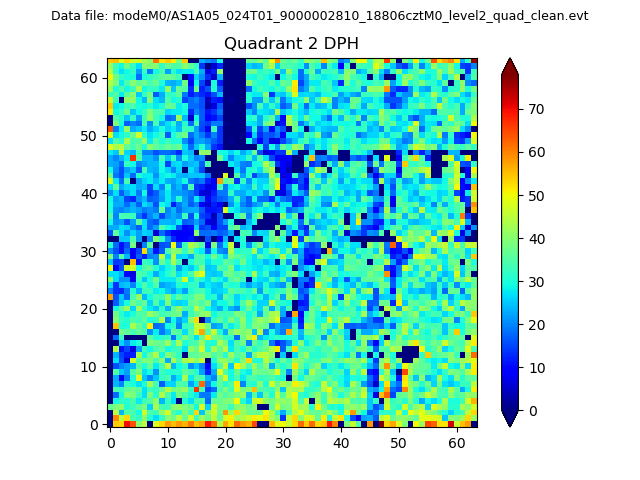
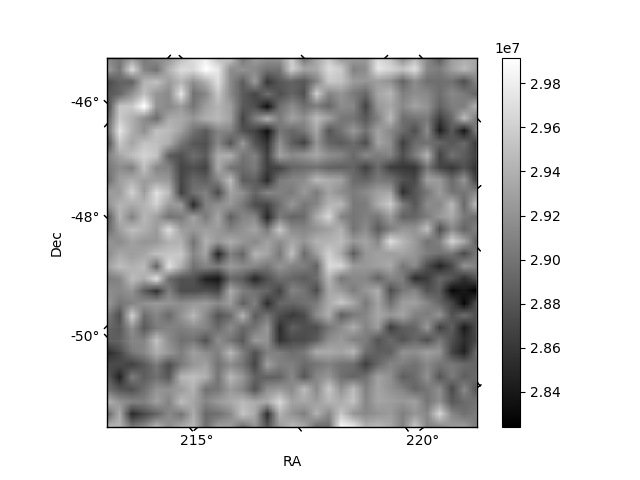
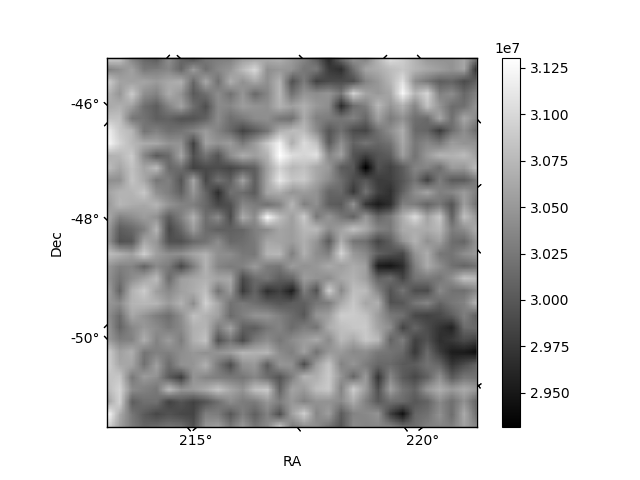
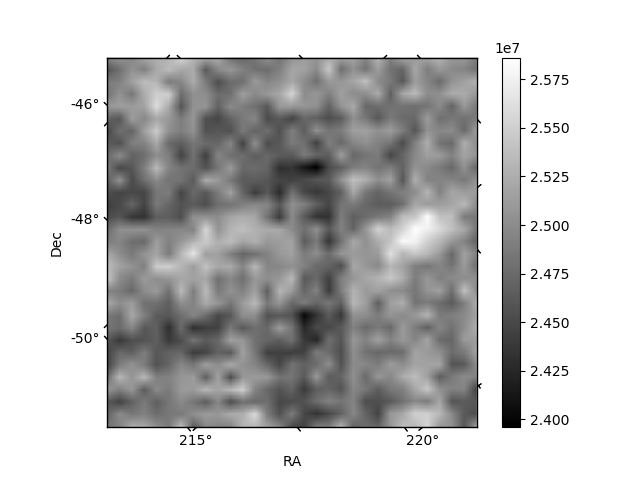
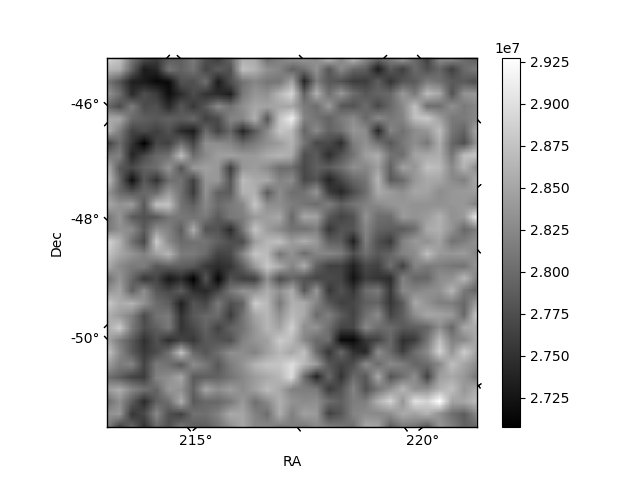
Histogram calculated using DETX and DETY for each event in the final _common_clean file
| Quadrant A |  |
 |
Quadrant B |
|---|---|---|---|
| Quadrant D | 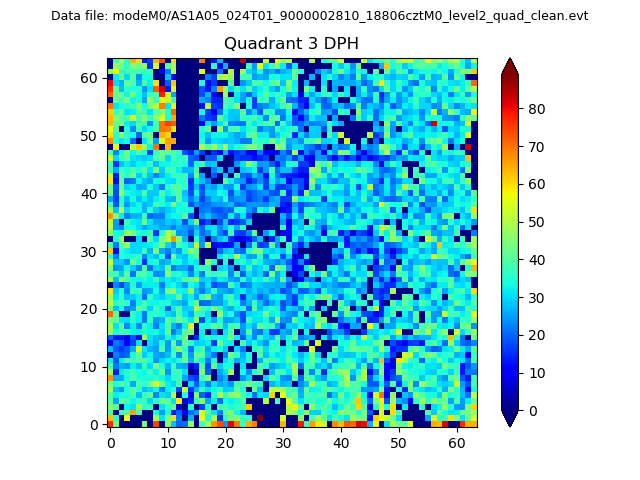 |
 |
Quadrant C |
| Plot type | Count rate plots | Images |
|---|---|---|
| Comparison with Poisson distribution Blue bars denote a histogram of data divided into 1 sec bins. Red curve is a Poisson curve with rate = median count rate of data. |
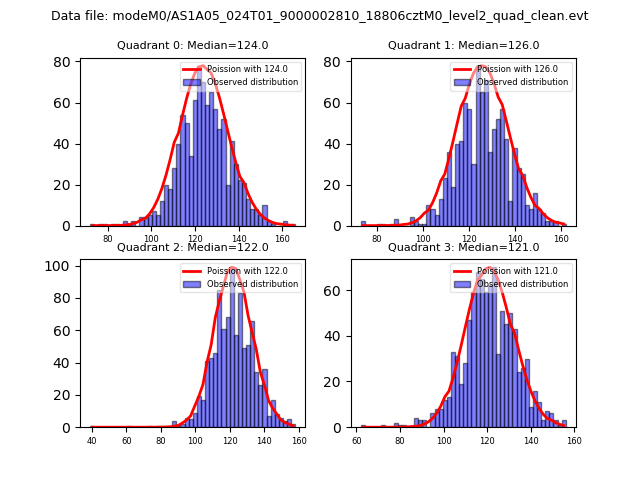 |
 |
| Quadrant-wise count rates Data is divided into 100 sec bins |
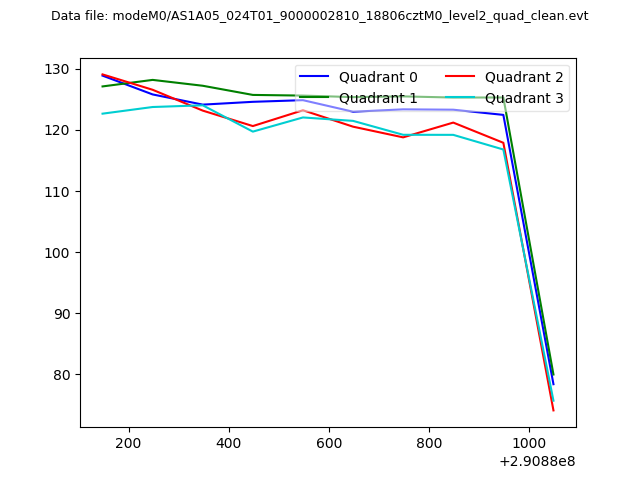 |
|
| Module-wise count rates for Quadrant A Data is divided into 100 sec bins |
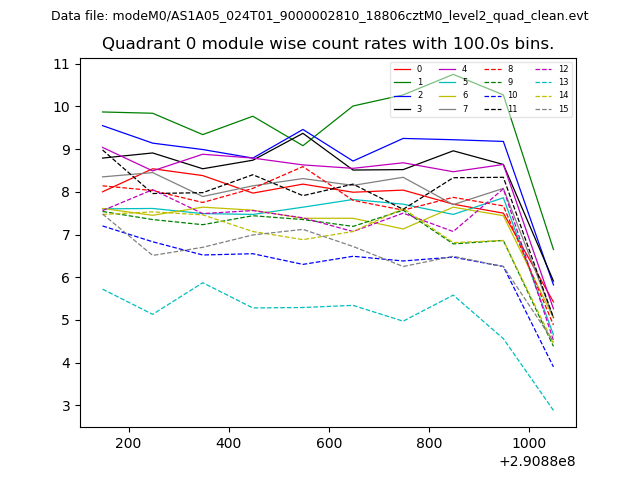 |
 |
| Module-wise count rates for Quadrant B Data is divided into 100 sec bins |
 |
 |
| Module-wise count rates for Quadrant C Data is divided into 100 sec bins |
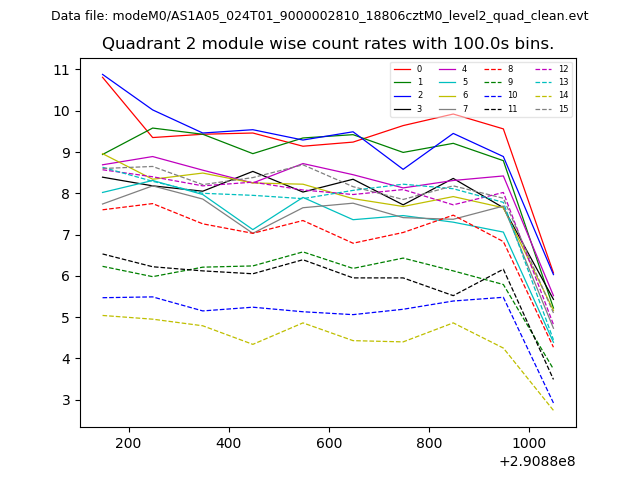 |
 |
| Module-wise count rates for Quadrant D Data is divided into 100 sec bins |
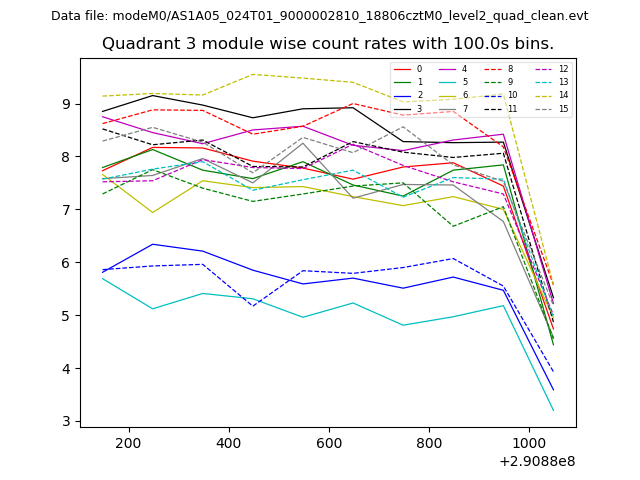 |
 |
| Parameter | Plot |
|---|---|
| CZT HV Monitor |  |
| D_VDD | 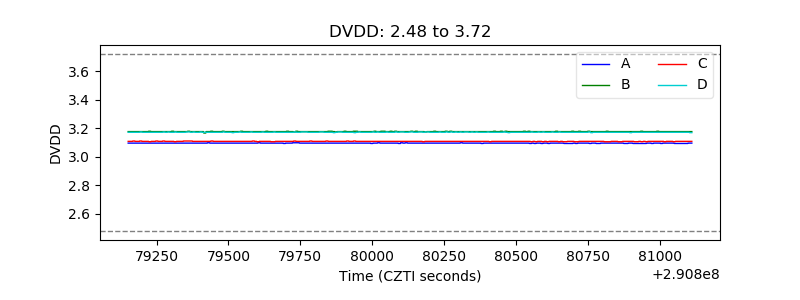 |
| Temperature 1 | 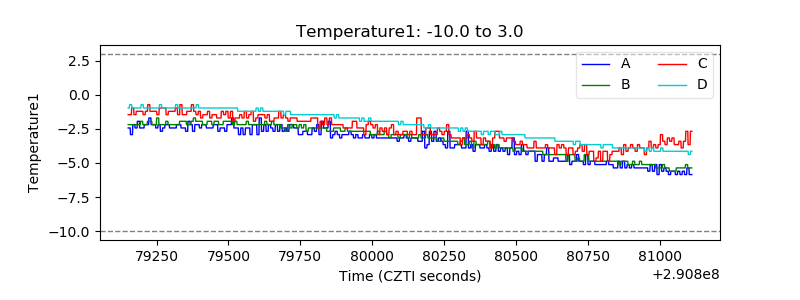 |
| Veto HV Monitor | 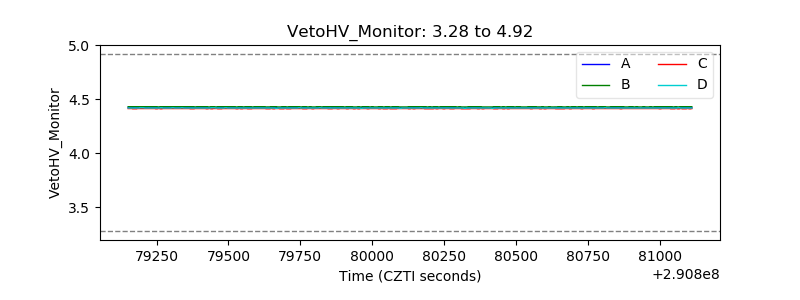 |
| Veto LLD |  |
| Alpha Counter | 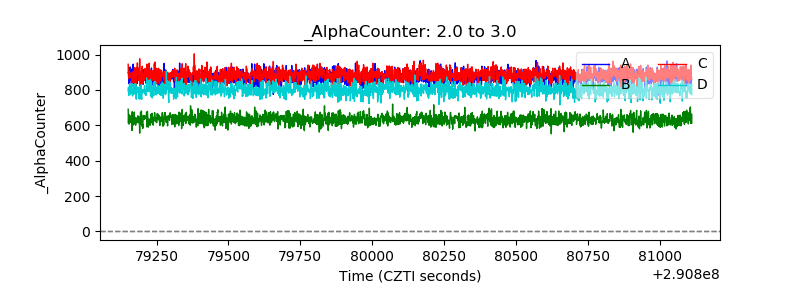 |
| _CPM_Rate | 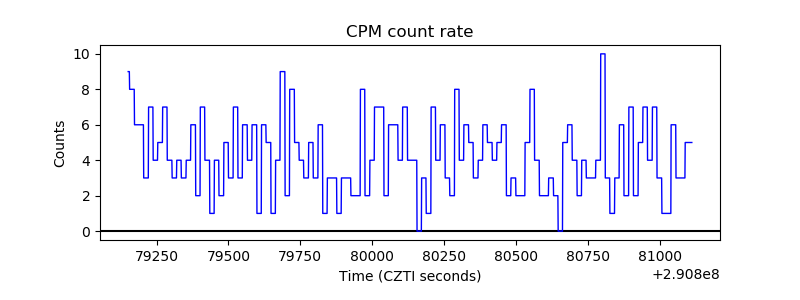 |
| CZT Counter | 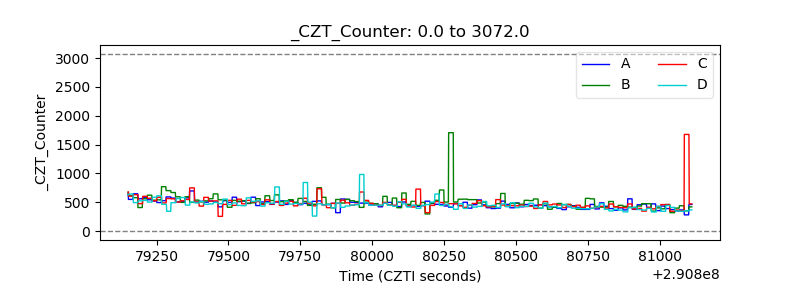 |
| +2.5 Volts monitor |  |
| +5 Volts monitor | 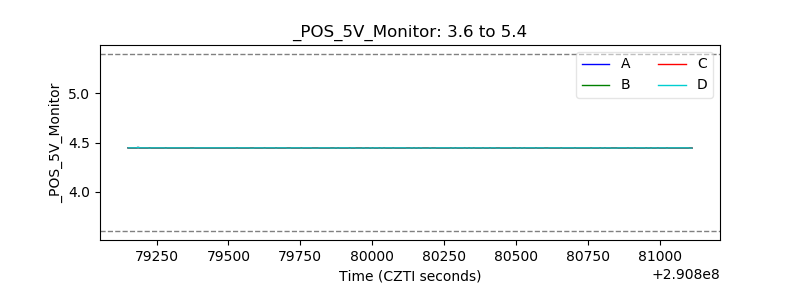 |
| _ROLL_ROT | 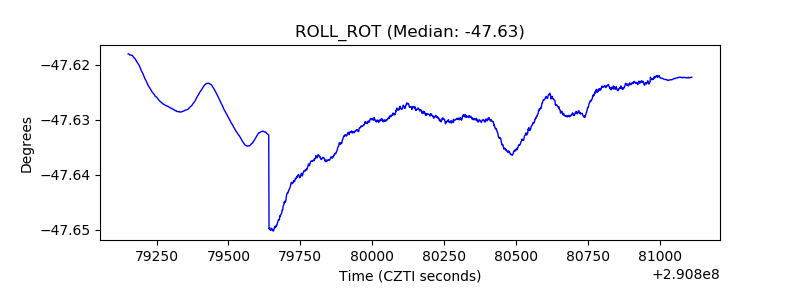 |
| _Roll_DEC | 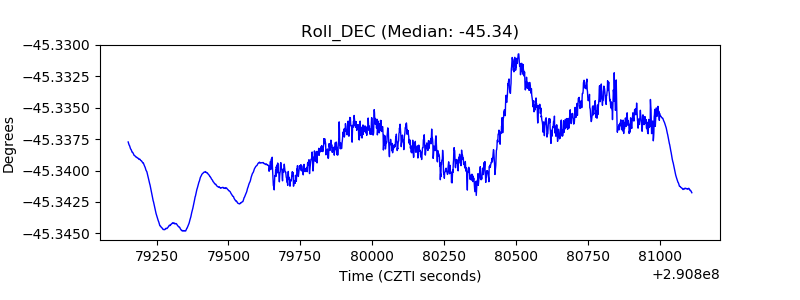 |
| _Roll_RA |  |
| Veto Counter | 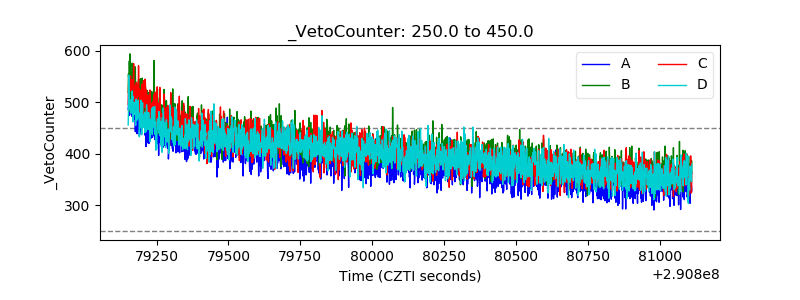 |