| Param | Original file | Final file |
|---|---|---|
| Filename | modeM0/AS1A05_088T03_9000002808cztM0_level2.fits | modeM0/AS1A05_088T03_9000002808cztM0_level2_quad_clean.evt |
| Size (bytes) | 401,088,960 | 356,656,320 |
| Size | 382.5 MB | 340.1 MB |
| Events in quadrant A | 2,487,820 | 2,064,357 |
| Events in quadrant B | 2,385,900 | 2,115,477 |
| Events in quadrant C | 2,448,630 | 2,049,414 |
| Events in quadrant D | 2,153,018 | 1,899,999 |
| Mode M0 | |||
|---|---|---|---|
| Quadrant | BADHDUFLAG | Total packets | Discarded packets |
| A | 0 | 93764 | 0 |
| B | 0 | 86005 | 0 |
| C | 0 | 81668 | 0 |
| D | 0 | 89740 | 0 |
| Mode SS | |||
|---|---|---|---|
| Quadrant | BADHDUFLAG | Total packets | Discarded packets |
| A | 0 | 790 | 0 |
| B | 0 | 790 | 0 |
| C | 0 | 790 | 0 |
| D | 0 | 790 | 0 |
| Mode M9 | |||
|---|---|---|---|
| Quadrant | BADHDUFLAG | Total packets | Discarded packets |
| A | 0 | 79 | 0 |
| B | 0 | 79 | 0 |
| C | 0 | 79 | 0 |
| D | 0 | 79 | 0 |
| Quadrant | Total seconds | Saturated seconds | Saturation percentage |
|---|---|---|---|
| A | 38918 | 1347 | 3.461123% |
| B | 38918 | 784 | 2.014492% |
| C | 38918 | 767 | 1.970810% |
| D | 38918 | 791 | 2.032479% |
Noise dominated data is calculated using 1-second bins in cleaned event files. If a bin has >2000 counts, and if more than 50% of those come from <1% of pixels, then it is considered to be noise-dominated and hence unusable.
| Quadrant | # 1 sec bins | Bins with >0 counts | Bins with >2000 counts | High rate bins dominated by noise | Noise dominated (total time) | Noise dominated (detector-on time) | Marked lightcurve |
|---|---|---|---|---|---|---|---|
| A | 46568 | 38919 | 0 | 0 | 0.00% | 0.00% |  |
| B | 46568 | 38918 | 0 | 0 | 0.00% | 0.00% |  |
| C | 46568 | 38918 | 0 | 0 | 0.00% | 0.00% | 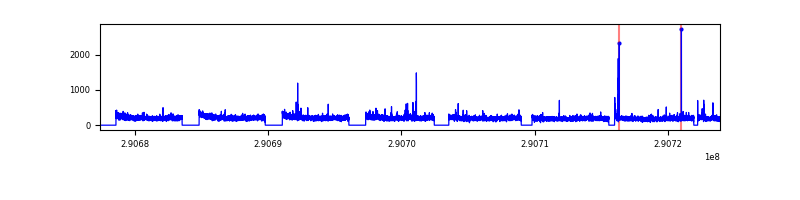 |
| D | 46568 | 38918 | 0 | 0 | 0.00% | 0.00% | 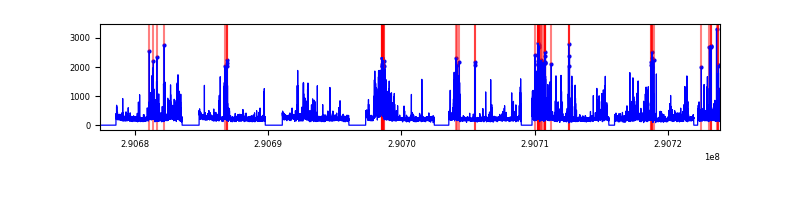 |
Top three noisy pixels from each quadrant. If the there are fewer than three noisy pixels in the level2.evt file, extra rows are filled as -1
| Pixel properties | Quadrant properties | ||||||
|---|---|---|---|---|---|---|---|
| Quadrant | DetID | PixID | Counts | Sigma | Mean | Median | Sigma |
| A | 0 | 29 | 2418 | 11.46 | 648 | 610 | 157.8 |
| A | 7 | 110 | 1958 | 8.54 | 648 | 610 | 157.8 |
| A | 9 | 19 | 1835 | 7.76 | 648 | 610 | 157.8 |
| B | 2 | 9 | 1855 | 10.12 | 630 | 604 | 123.6 |
| B | 2 | 8 | 1626 | 8.27 | 630 | 604 | 123.6 |
| B | 5 | 128 | 1545 | 7.61 | 630 | 604 | 123.6 |
| C | 1 | 80 | 1875 | 7.69 | 646 | 605 | 165.2 |
| C | 1 | 81 | 1826 | 7.39 | 646 | 605 | 165.2 |
| C | 12 | 241 | 1675 | 6.48 | 646 | 605 | 165.2 |
| D | 10 | 190 | 1654 | 6.68 | 615 | 564 | 163.0 |
| D | 10 | 189 | 1569 | 6.16 | 615 | 564 | 163.0 |
| D | 7 | 3 | 1541 | 5.99 | 615 | 564 | 163.0 |
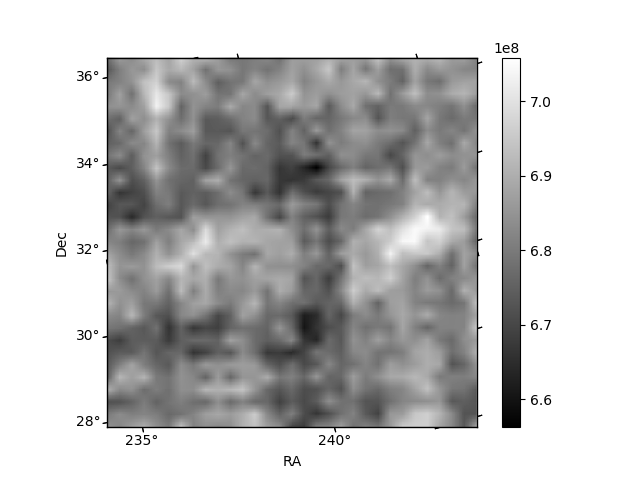
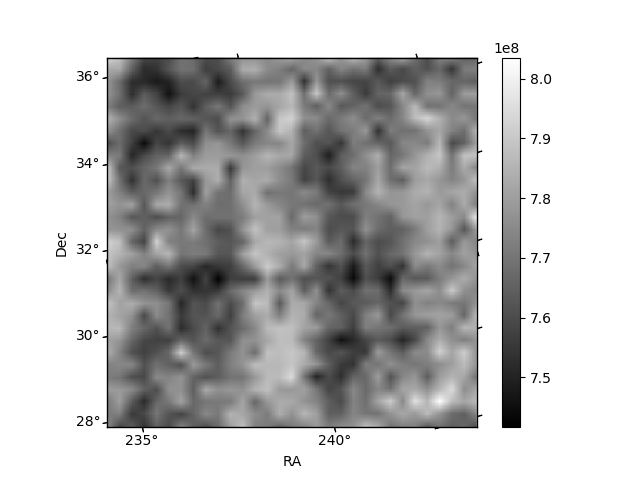
Histogram calculated using DETX and DETY for each event in the final _common_clean file
| Quadrant A |  |
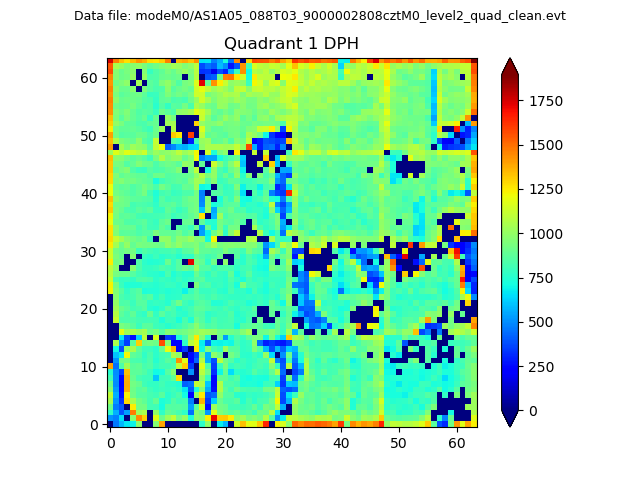 |
Quadrant B |
|---|---|---|---|
| Quadrant D |  |
 |
Quadrant C |
| Plot type | Count rate plots | Images |
|---|---|---|
| Comparison with Poisson distribution Blue bars denote a histogram of data divided into 1 sec bins. Red curve is a Poisson curve with rate = median count rate of data. |
 |
 |
| Quadrant-wise count rates Data is divided into 100 sec bins |
 |
|
| Module-wise count rates for Quadrant A Data is divided into 100 sec bins |
 |
 |
| Module-wise count rates for Quadrant B Data is divided into 100 sec bins |
 |
 |
| Module-wise count rates for Quadrant C Data is divided into 100 sec bins |
 |
 |
| Module-wise count rates for Quadrant D Data is divided into 100 sec bins |
 |
 |
| Parameter | Plot |
|---|---|
| CZT HV Monitor | 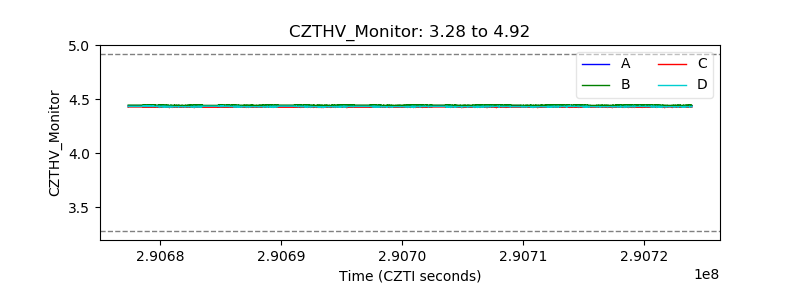 |
| D_VDD |  |
| Temperature 1 | 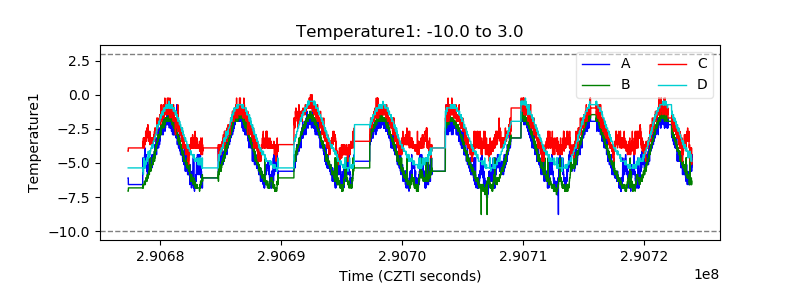 |
| Veto HV Monitor |  |
| Veto LLD |  |
| Alpha Counter |  |
| _CPM_Rate |  |
| CZT Counter |  |
| +2.5 Volts monitor |  |
| +5 Volts monitor |  |
| _ROLL_ROT |  |
| _Roll_DEC |  |
| _Roll_RA | 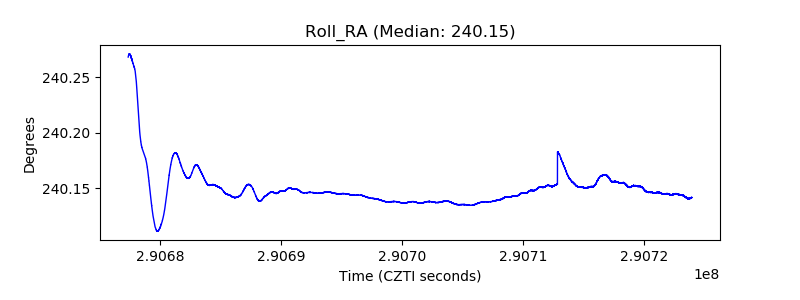 |
| Veto Counter |  |