| Param | Original file | Final file |
|---|---|---|
| Filename | modeM0/AS1A05_088T03_9000002808_18773cztM0_level2.evt | modeM0/AS1A05_088T03_9000002808_18773cztM0_level2_quad_clean.evt |
| Size (bytes) | 482,063,040 | 80,907,840 |
| Size | 459.7 MB | 77.2 MB |
| Events in quadrant A | 3,556,301 | 505,119 |
| Events in quadrant B | 3,668,031 | 511,945 |
| Events in quadrant C | 3,462,694 | 493,946 |
| Events in quadrant D | 3,477,455 | 492,055 |
| Mode M0 | |||
|---|---|---|---|
| Quadrant | BADHDUFLAG | Total packets | Discarded packets |
| A | 0 | 14466 | 2 |
| B | 0 | 14771 | 2 |
| C | 0 | 13989 | 2 |
| D | 0 | 14158 | 2 |
| Mode SS | |||
|---|---|---|---|
| Quadrant | BADHDUFLAG | Total packets | Discarded packets |
| A | 0 | 130 | 0 |
| B | 0 | 130 | 0 |
| C | 0 | 130 | 0 |
| D | 0 | 130 | 0 |
| Mode M9 | |||
|---|---|---|---|
| Quadrant | BADHDUFLAG | Total packets | Discarded packets |
| A | 0 | 18 | 0 |
| B | 0 | 19 | 0 |
| C | 0 | 19 | 0 |
| D | 0 | 19 | 0 |
| Quadrant | Total seconds | Saturated seconds | Saturation percentage |
|---|---|---|---|
| A | 6406 | 117 | 1.826413% |
| B | 6406 | 148 | 2.310334% |
| C | 6406 | 124 | 1.935685% |
| D | 6406 | 96 | 1.498595% |
Noise dominated data is calculated using 1-second bins in cleaned event files. If a bin has >2000 counts, and if more than 50% of those come from <1% of pixels, then it is considered to be noise-dominated and hence unusable.
| Quadrant | # 1 sec bins | Bins with >0 counts | Bins with >2000 counts | High rate bins dominated by noise | Noise dominated (total time) | Noise dominated (detector-on time) | Marked lightcurve |
|---|---|---|---|---|---|---|---|
| A | 7691 | 6407 | 7 | 7 | 0.09% | 0.11% | 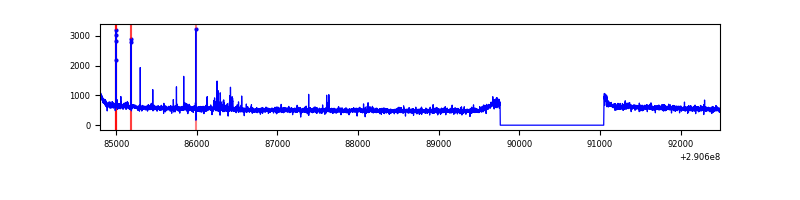 |
| B | 7691 | 6407 | 23 | 23 | 0.30% | 0.36% | 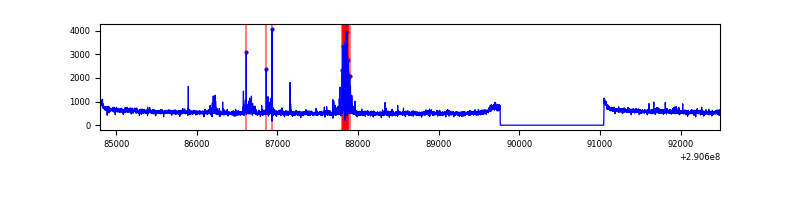 |
| C | 7691 | 6407 | 0 | 0 | 0.00% | 0.00% | 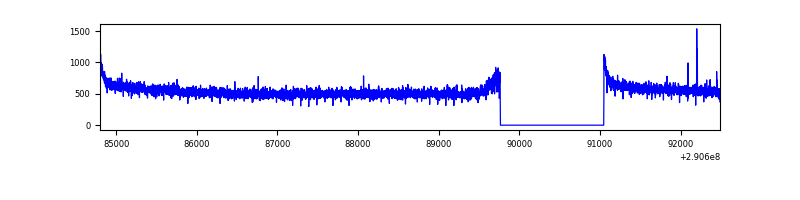 |
| D | 7691 | 6407 | 10 | 10 | 0.13% | 0.16% | 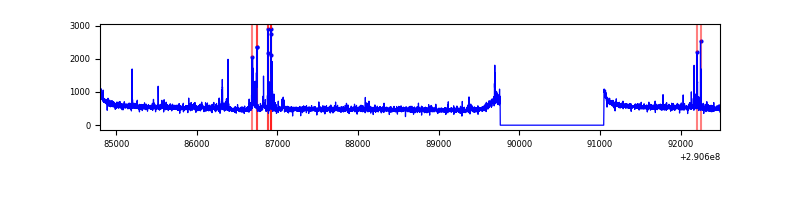 |
Top three noisy pixels from each quadrant. If the there are fewer than three noisy pixels in the level2.evt file, extra rows are filled as -1
| Pixel properties | Quadrant properties | ||||||
|---|---|---|---|---|---|---|---|
| Quadrant | DetID | PixID | Counts | Sigma | Mean | Median | Sigma |
| A | 6 | 16 | 67889 | 374.49 | 899 | 885 | 178.9 |
| A | 15 | 192 | 17239 | 91.4 | 899 | 885 | 178.9 |
| A | 13 | 254 | 9946 | 50.64 | 899 | 885 | 178.9 |
| B | 7 | 220 | 152225 | 921.62 | 881 | 861 | 164.2 |
| B | 0 | 229 | 31190 | 184.67 | 881 | 861 | 164.2 |
| B | 4 | 216 | 20120 | 117.26 | 881 | 861 | 164.2 |
| C | 14 | 238 | 136268 | 698.94 | 849 | 857 | 193.7 |
| C | 0 | 207 | 7873 | 36.21 | 849 | 857 | 193.7 |
| C | 3 | 233 | 7399 | 33.77 | 849 | 857 | 193.7 |
| D | 14 | 34 | 75504 | 359.41 | 872 | 852 | 207.7 |
| D | 1 | 52 | 71354 | 339.43 | 872 | 852 | 207.7 |
| D | 2 | 234 | 30002 | 140.34 | 872 | 852 | 207.7 |
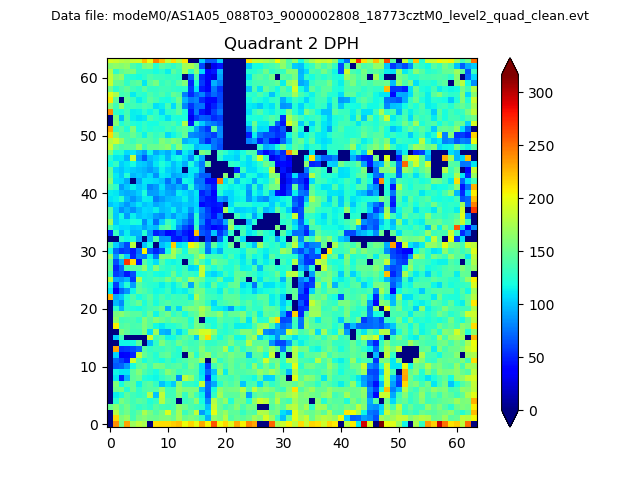
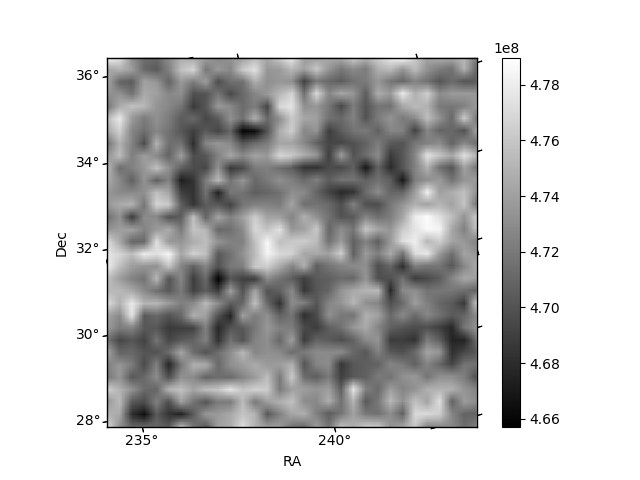
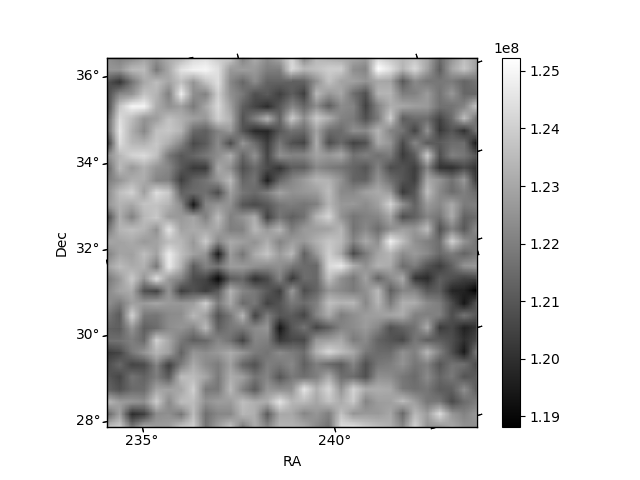
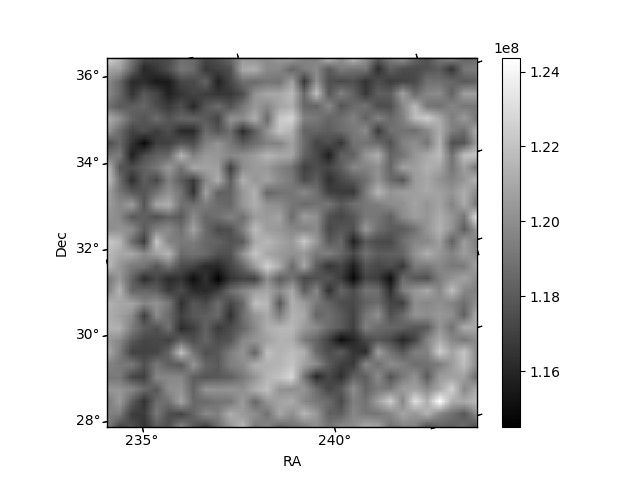
Histogram calculated using DETX and DETY for each event in the final _common_clean file
| Quadrant A | 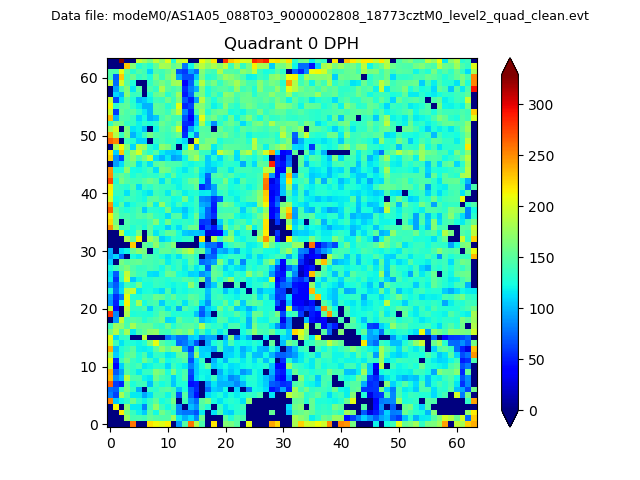 |
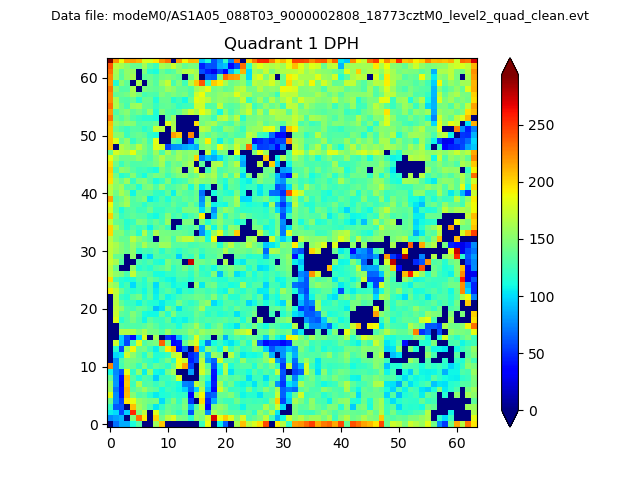 |
Quadrant B |
|---|---|---|---|
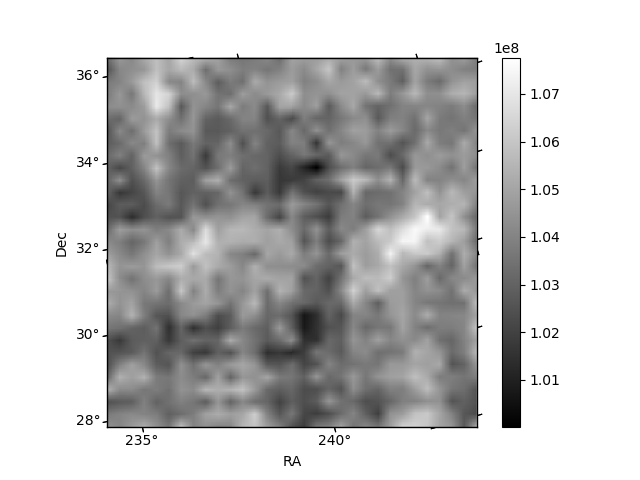
| Quadrant D | 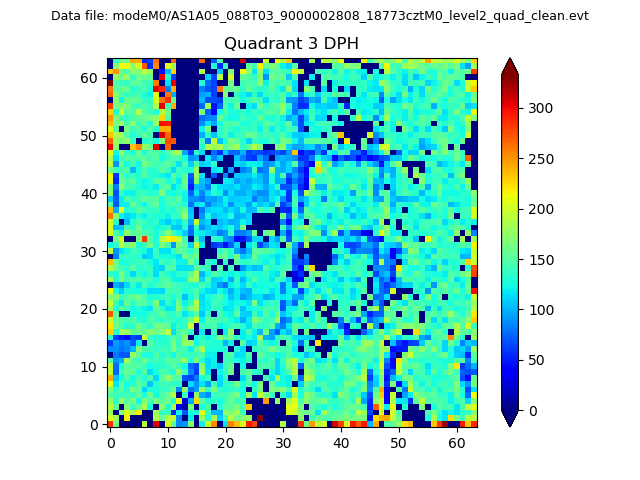 |
 |
Quadrant C |
| Plot type | Count rate plots | Images |
|---|---|---|
| Comparison with Poisson distribution Blue bars denote a histogram of data divided into 1 sec bins. Red curve is a Poisson curve with rate = median count rate of data. |
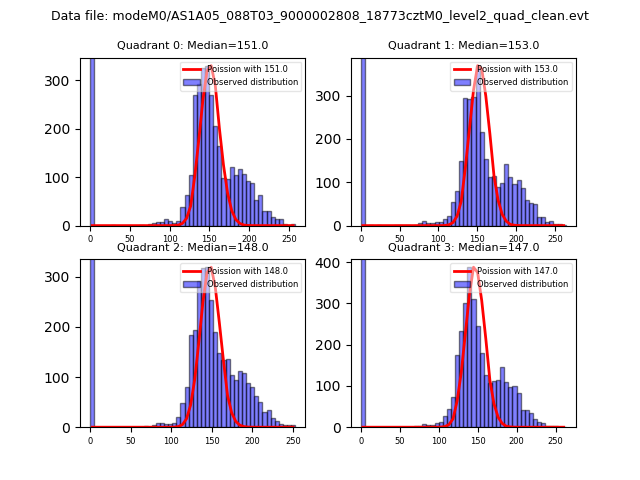 |
 |
| Quadrant-wise count rates Data is divided into 100 sec bins |
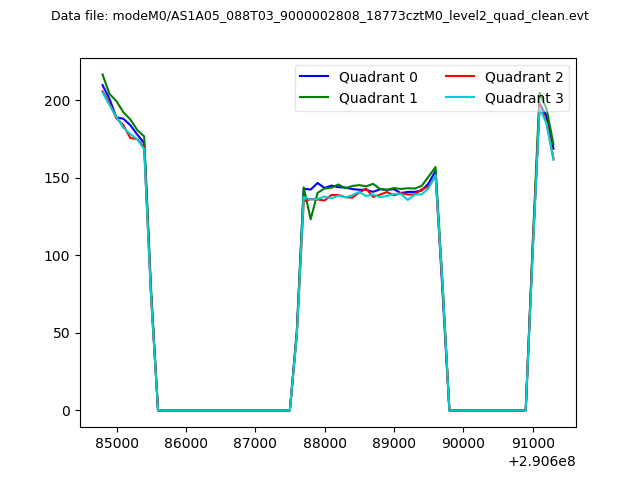 |
|
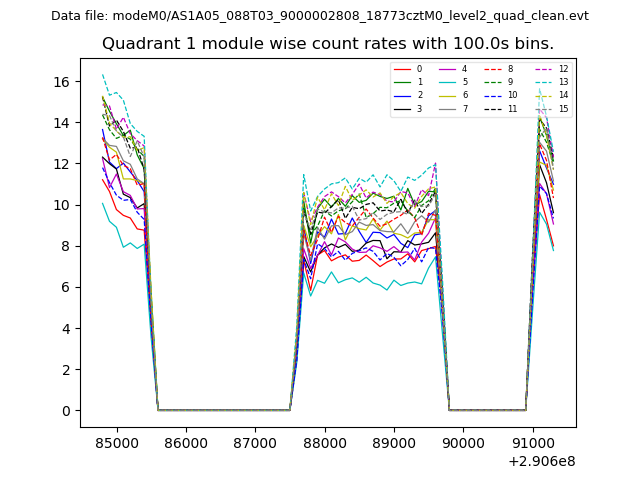
| Module-wise count rates for Quadrant A Data is divided into 100 sec bins |
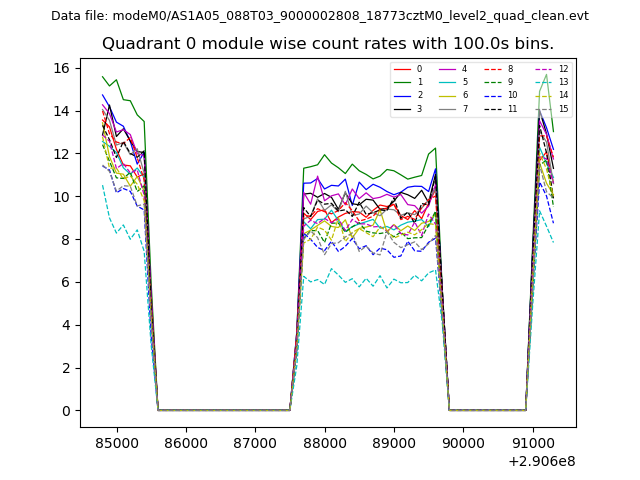 |
 |
| Module-wise count rates for Quadrant B Data is divided into 100 sec bins |
 |
 |
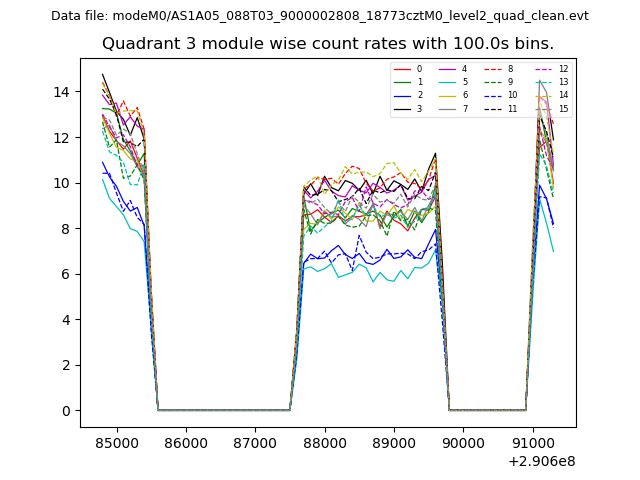
| Module-wise count rates for Quadrant C Data is divided into 100 sec bins |
 |
 |
| Module-wise count rates for Quadrant D Data is divided into 100 sec bins |
 |
 |
| Parameter | Plot |
|---|---|
| CZT HV Monitor |  |
| D_VDD | 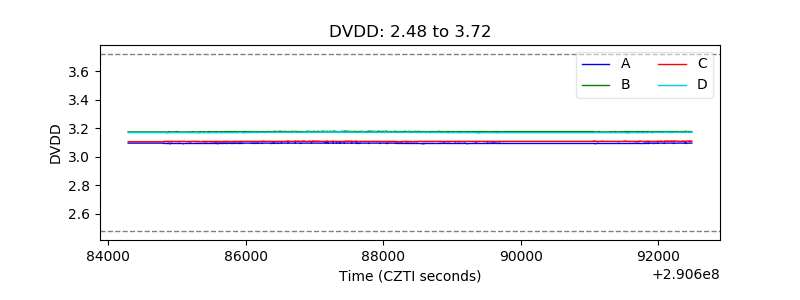 |
| Temperature 1 | 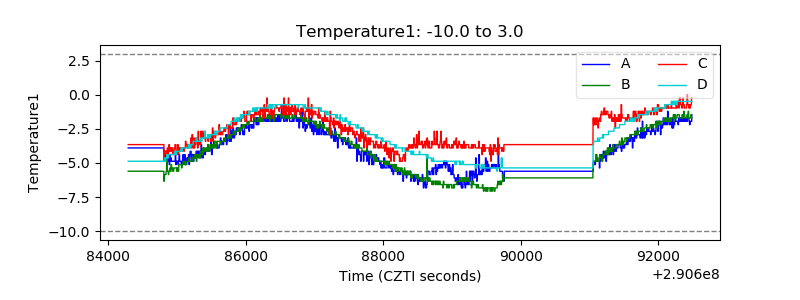 |
| Veto HV Monitor | 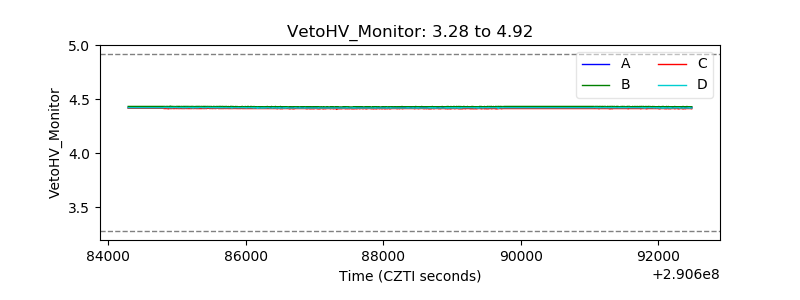 |
| Veto LLD | 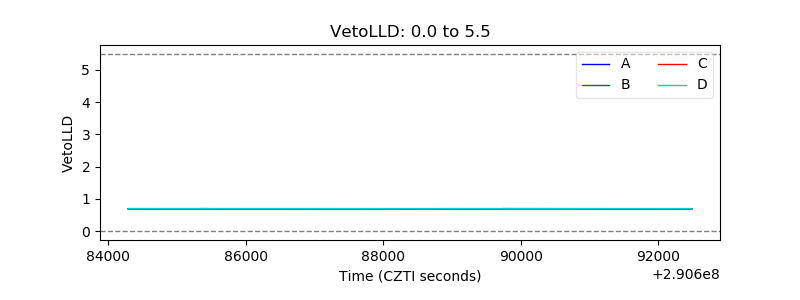 |
| Alpha Counter | 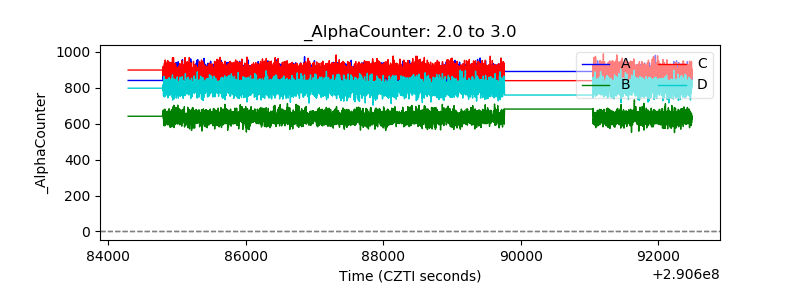 |
| _CPM_Rate | 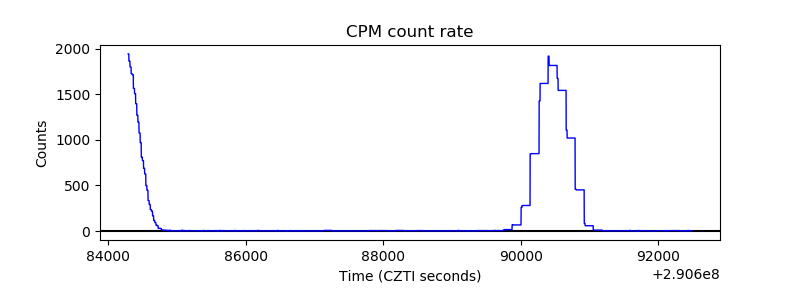 |
| CZT Counter | 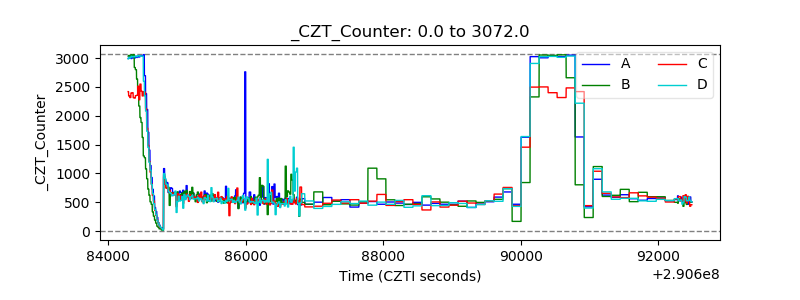 |
| +2.5 Volts monitor | 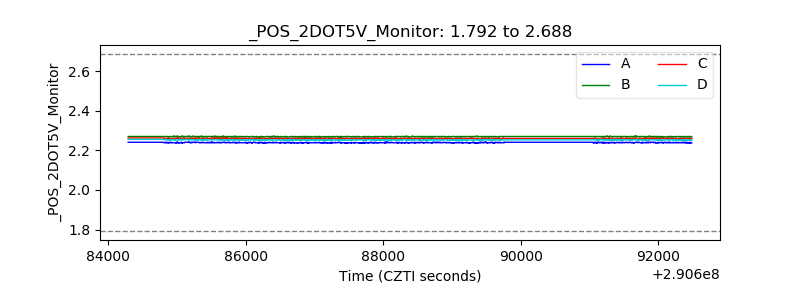 |
| +5 Volts monitor |  |
| _ROLL_ROT | 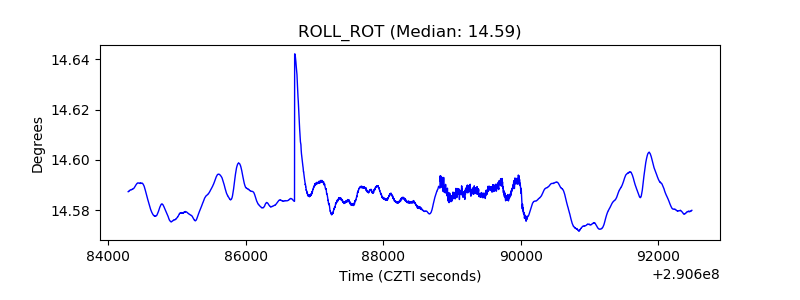 |
| _Roll_DEC | 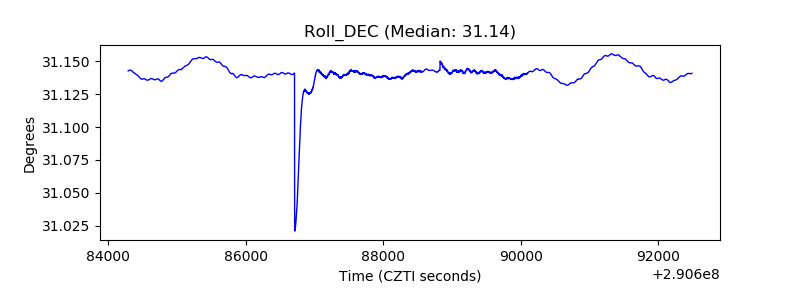 |
| _Roll_RA | 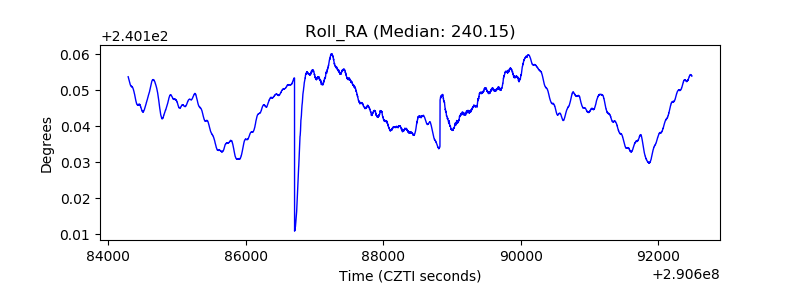 |
| Veto Counter | 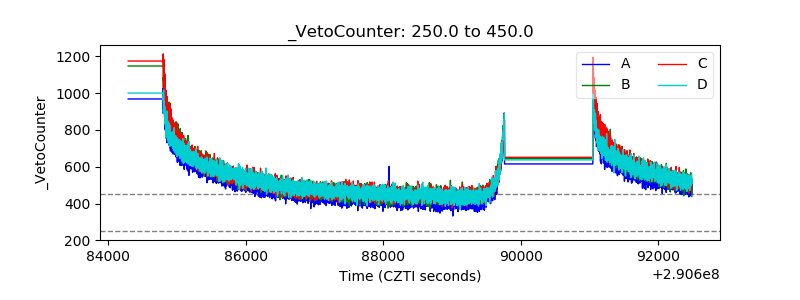 |